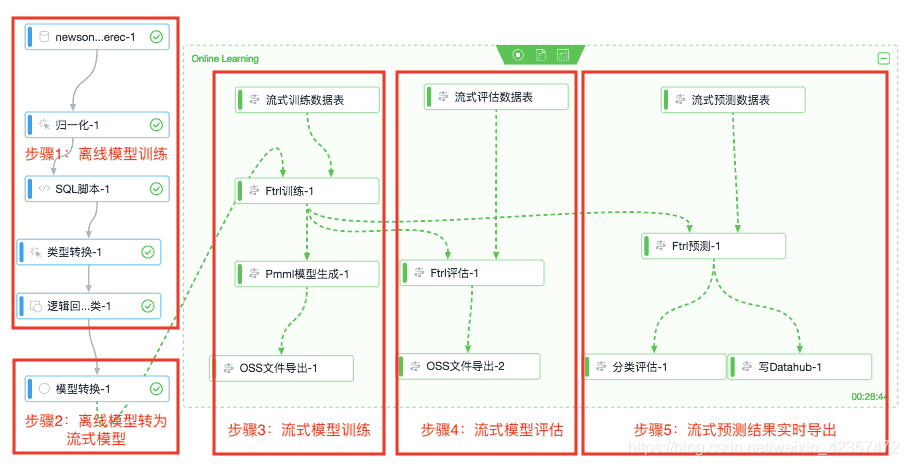
ftrl在线模型优化器 流式计算更新
参考:https://segmentfault.com/a/1190000017994411https://blog.csdn.net/m0_37870649/article/details/104673471ftrl流式更新模型结构图参考# %load FTRL_Optimizer.py# Date: 2018-08-17 09:09# Author: Enneng Yang# Abstract
·
参考:
https://segmentfault.com/a/1190000017994411
https://blog.csdn.net/m0_37870649/article/details/104673471
ftrl流式更新模型结构图参考
# %load FTRL_Optimizer.py
# Date: 2018-08-17 09:09
# Author: Enneng Yang
# Abstract:FTRL

import sys
import numpy as np
import matplotlib.pyplot as plt
import tensorflow as tf
from mpl_toolkits.mplot3d import Axes3D
from tensorflow.examples.tutorials.mnist import input_data


mnist = input_data.read_data_sets("Data/MNIST_data/", one_hot=True)

method_name = 'FTRL'
# training Parameters
learning_rate = 0.001
training_epochs = 50
batch_size = 100
display_step = 1

# tf Graph Input
x = tf.placeholder(tf.float32, [None, 784])  # mnist data image of shape: 28*28=784
y = tf.placeholder(tf.float32, [None, 10])  # 0-9 digits recognition: 10 classes

# Set model weights
W = tf.Variable(tf.zeros([784, 10]))
b = tf.Variable(tf.zeros([10]))

# Construct model
pred = tf.nn.softmax(tf.matmul(x, W) + b)  # Softmax

# Minimize error using cross entropy
cost = tf.reduce_mean(-tf.reduce_sum(y * tf.log(pred), reduction_indices=1))

optimizer = tf.train.FtrlOptimizer(learning_rate=learning_rate).minimize(cost)

# Initializing the variables
init = tf.global_variables_initializer()

all_loss = []
all_step = []

plt.title('Optimization method:' + method_name)
plt.xlabel('training_epochs')
plt.ylabel('loss')

# Launch the graph
with tf.Session() as sess:
    sess.run(init)
    # Training cycle
    for epoch in range(training_epochs):

        avg_cost = 0.
        epoch_cost = 0.

        total_batch = int(mnist.train.num_examples / batch_size)

        # Loop over all batches
        for i in range(total_batch):
            batch_x, batch_y = mnist.train.next_batch(batch_size)

            # Run optimization op (backprop) and cost op (to get loss value)
            _, c_ = sess.run([optimizer, cost], feed_dict={x: batch_x, y: batch_y})

            # Compute average loss
            epoch_cost += c_

        avg_cost = epoch_cost / total_batch

        # opt loss
        all_loss.append(avg_cost)
        all_step.append(epoch)

        # Display logs per epoch step
        if epoch % display_step == 0:
            print("Epoch:", '%04d' % (epoch + 1), "cost=", "{:.9f}".format(avg_cost))

    print("Optimization Finished!")

plt.plot(all_step, all_loss, color='red', label=method_name)
plt.legend(loc='best')

plt.show()
plt.pause(1000)

DAMO开发者矩阵,由阿里巴巴达摩院和中国互联网协会联合发起,致力于探讨最前沿的技术趋势与应用成果,搭建高质量的交流与分享平台,推动技术创新与产业应用链接,围绕“人工智能与新型计算”构建开放共享的开发者生态。
更多推荐
 0
0 0
0- 0


 已为社区贡献1条内容

所有评论(0)