机器学习作业3.7,1、2
·
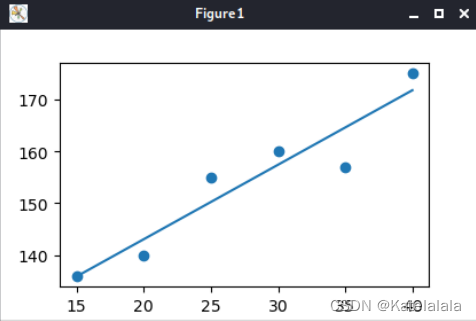
1、用sklearn.linear_model包中的LinearRegression对表3-1所示的示例进行线性回归实验,比较结果。
|
温度/℃ |
15 |
20 |
25 |
30 |
35 |
40 |
|
小花数量/朵 |
136 |
140 |
155 |
160 |
157 |
175 |
import matplotlib.pyplot as plt
import numpy as np
from sklearn.linear_model import LinearRegression
#plt.axis([0, 50, 0, 300])
data = np.array([[15,136], [20,140],[25,155], [30,160], [35,157], [40,175]], np.int32)
x = data[:,0:-1]#从第0列开始到倒数第2列停止
y = data[:,-1] #取出最后一列

print(np.shape(x), np.shape(y))
model = LinearRegression().fit(x,y)
print(model.predict([[169]]))  #注意model.predict()中要预测的数据跟训练数据x的shape保持一致
print(model.coef_)#coef_:回归系数(斜率)
print(model.intercept_)#intercept_:截距项
print(model.score(x,y))# 返回预测的决定系数R^2;

plt.scatter(x,y)
plt.plot(x, model.predict(x))
plt.show()
- 写出用迭代法求解方程
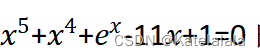 的迭代关系式。
import math
#def f(x):
x=0
for i in range(50):
 x=(x**5+x**4+(math.e**x)+1)/11
 print(str(i)+":"+str(x))

DAMO开发者矩阵,由阿里巴巴达摩院和中国互联网协会联合发起,致力于探讨最前沿的技术趋势与应用成果,搭建高质量的交流与分享平台,推动技术创新与产业应用链接,围绕“人工智能与新型计算”构建开放共享的开发者生态。
更多推荐

 1
1 0
0- 0


 已为社区贡献2条内容

所有评论(0)