Halcon从图像中提取线条,并计算这些线条的一些特征,如长度、宽度和对比度
以下代码同样是使用HALCON软件编写的,主要用于从图像中提取线条,并计算这些线条的一些特征,如长度、宽度和对比度
dev_update_off ()
read_image (Angio, ‘angio-part’)
get_image_size (Angio, Width, Height)
dev_close_window ()
dev_open_window (0, 0, Width, Height, ‘black’, WindowID)
set_display_font (WindowID, 14, ‘mono’, ‘true’, ‘false’)
dev_display (Angio)
disp_message (WindowID, ‘Original image’, ‘window’, 12, 12, ‘black’, ‘true’)
disp_continue_message (WindowID, ‘black’, ‘true’)
stop ()
calculate_lines_gauss_parameters (8, [12,0], Sigma, Low, High)
lines_gauss (Angio, Lines, Sigma, Low, High, ‘dark’, ‘true’, ‘parabolic’, ‘true’)
select_contours_xld (Lines, RelLines, ‘length’, 5.0, 999, 0, 0)
dev_set_colored (12)
dev_display (Angio)
dev_display (RelLines)
disp_message (WindowID, ‘Extracted lines’, ‘window’, 12, 12, ‘black’, ‘true’)
disp_continue_message (WindowID, ‘black’, ‘true’)
stop ()
count_obj (RelLines, Number)
sort_contours_xld (RelLines, RelLines, ‘lower_left’, ‘true’, ‘row’)
gen_empty_obj (PrintedLines)
for I := 1 to Number by 1
dev_display (Angio)
dev_set_color (‘white’)
dev_display (PrintedLines)
select_obj (RelLines, Line, I)
dev_set_color (‘green’)
dev_display (Line)
concat_obj (PrintedLines, Line, PrintedLines)
get_contour_xld (Line, Row, Col)
meanRow := sum(Row) / |Row|
meanCol := sum(Col) / |Col|
get_contour_attrib_xld (Line, ‘width_left’, WidthL)
get_contour_attrib_xld (Line, ‘width_right’, WidthR)
get_contour_attrib_xld (Line, ‘contrast’, Contrast)
meanContrast := sum(Contrast) / |Contrast|
* To display the lines widths, the point at which the gray value drops
* to 25% of the contrast between the line and the background will be
* displayed. This point is given by sqrt(3/4) for the parabolic line
* model.
Diameter := (WidthL + WidthR) * sqrt(0.75)
Diam := sum(Diameter) / |Diameter|
if (meanRow > Height - 50)
disp_message (WindowID, 'diam: ’ + Diam, ‘image’, Height - 70, meanCol, ‘yellow’, ‘false’)
else
disp_message (WindowID, 'diam: ’ + Diam, ‘image’, meanRow, meanCol, ‘yellow’, ‘false’)
endif
disp_message (WindowID, ‘Diameters of line segments’, ‘window’, 135, 60, ‘black’, ‘true’)
if (I < 5)
disp_continue_message (WindowID, ‘black’, ‘true’)
stop ()
else
wait_seconds (0.2)
endif
endfor
dev_update_on ()
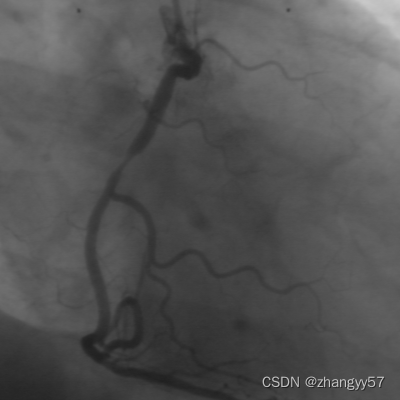
以下是代码的主要功能和步骤:
图像读取和显示:
禁用图像更新。
读取名为angio-part的图像。
获取图像的宽度和高度。
关闭当前窗口,打开一个新的窗口以显示图像。
设置窗口字体,并显示原始图像。
线条提取:
使用高斯滤波器的参数计算来提取线条。
应用lines_gauss函数来检测图像中的线条,使用高斯滤波和阈值方法。
选择长度大于5.像素的线条。
线条显示和特征计算:
显示原始图像和提取的线条。
计算线条的数量,并按左下角的坐标对线条进行排序。
创建一个空的对象PrintedLines用于后续显示。
循环处理每条线条:
对于每条线条,显示原始图像和之前的线条集合。
选择当前循环的线条,并以绿色显示。
将当前线条添加到PrintedLines中。
计算线条的中心位置(行和列的平均值)。
获取线条的左侧宽度、右侧宽度和对比度,并计算平均对比度。
根据抛物线模型,计算线条的直径(宽度的总和乘以一个因子)。
显示线条直径:
如果线条中心的行位置接近图像底部,就在图像底部显示直径信息;否则,在线条中心位置显示。
显示所有线条直径的标题信息。
循环控制:
如果是前5条线条,显示信息后暂停,等待用户操作。
如果超过5条线条,每条线条显示.2秒后自动继续。
图像更新:
启用图像更新。
整体来看,这段代码通过HALCON软件实现了从医学图像(如血管造影图像)中提取线条,并计算和显示这些线条的特征,如长度、宽度和对比度。这对于医学图像分析、血管分割和特征提取等应用场景非常有用。

DAMO开发者矩阵,由阿里巴巴达摩院和中国互联网协会联合发起,致力于探讨最前沿的技术趋势与应用成果,搭建高质量的交流与分享平台,推动技术创新与产业应用链接,围绕“人工智能与新型计算”构建开放共享的开发者生态。
更多推荐

 15
15 0
0- 0


 已为社区贡献5条内容

所有评论(0)