计算机毕设选题神器:Python+Django医用耗材采集数据分析系统完整教程
计算机毕设选题神器:Python+Django医用耗材采集数据分析系统完整教程
🍊作者:计算机毕设匠心工作室
🍊简介:毕业后就一直专业从事计算机软件程序开发,至今也有8年工作经验。擅长Java、Python、微信小程序、安卓、大数据、PHP、.NET|C#、Golang等。
擅长:按照需求定制化开发项目、 源码、对代码进行完整讲解、文档撰写、ppt制作。
🍊心愿:点赞 👍 收藏 ⭐评论 📝
👇🏻 精彩专栏推荐订阅 👇🏻 不然下次找不到哟~
Java实战项目
Python实战项目
微信小程序|安卓实战项目
大数据实战项目
PHP|C#.NET|Golang实战项目
🍅 ↓↓文末获取源码联系↓↓🍅
这里写目录标题
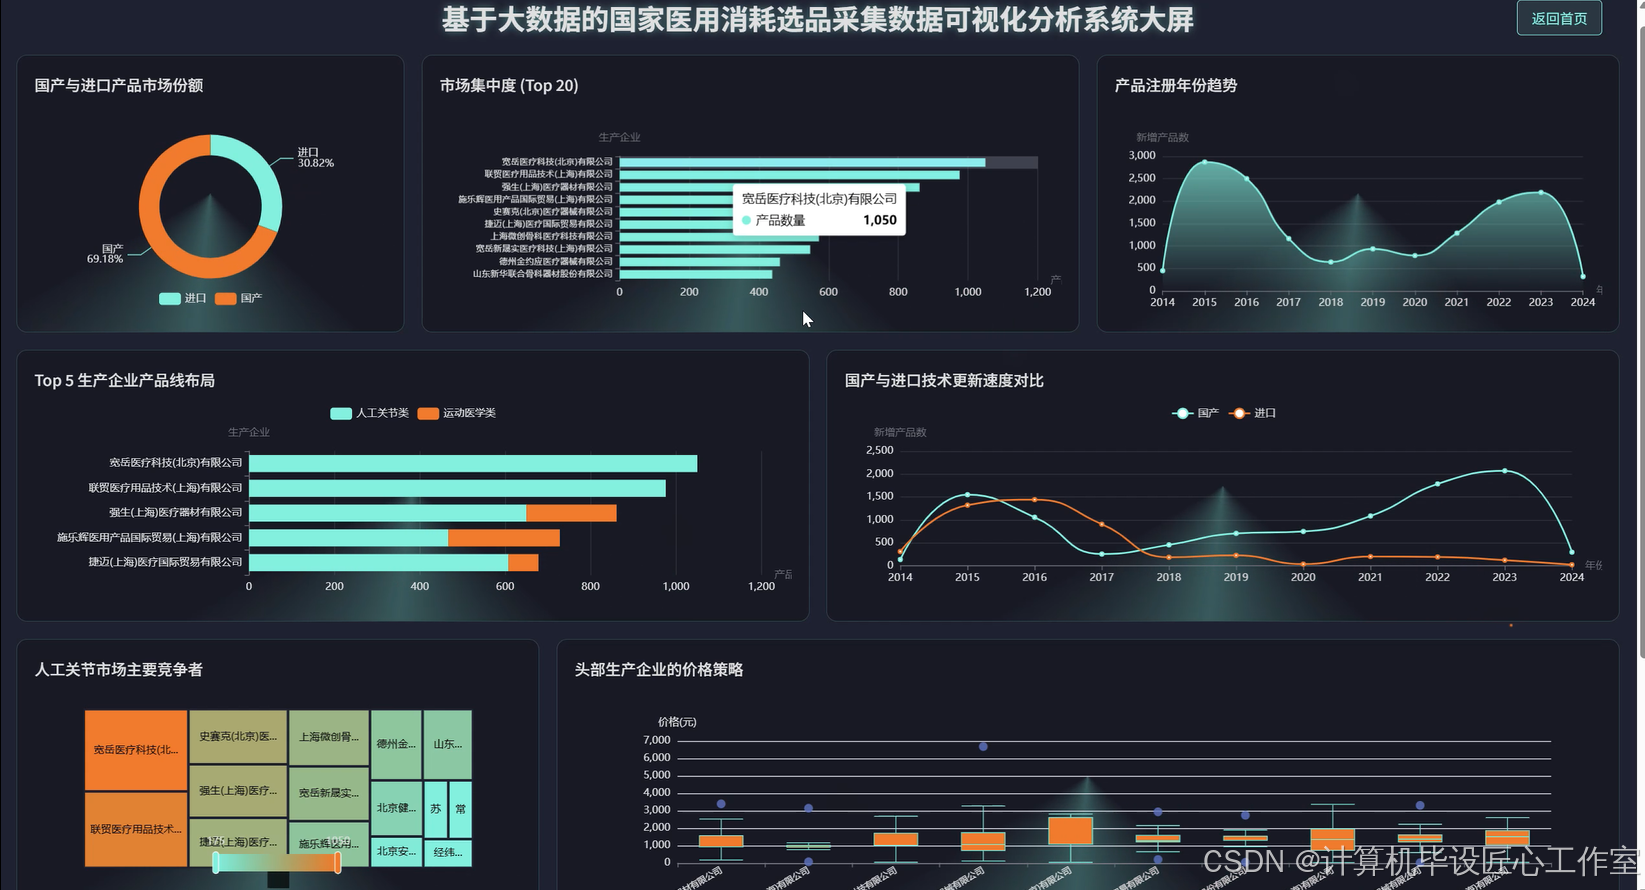
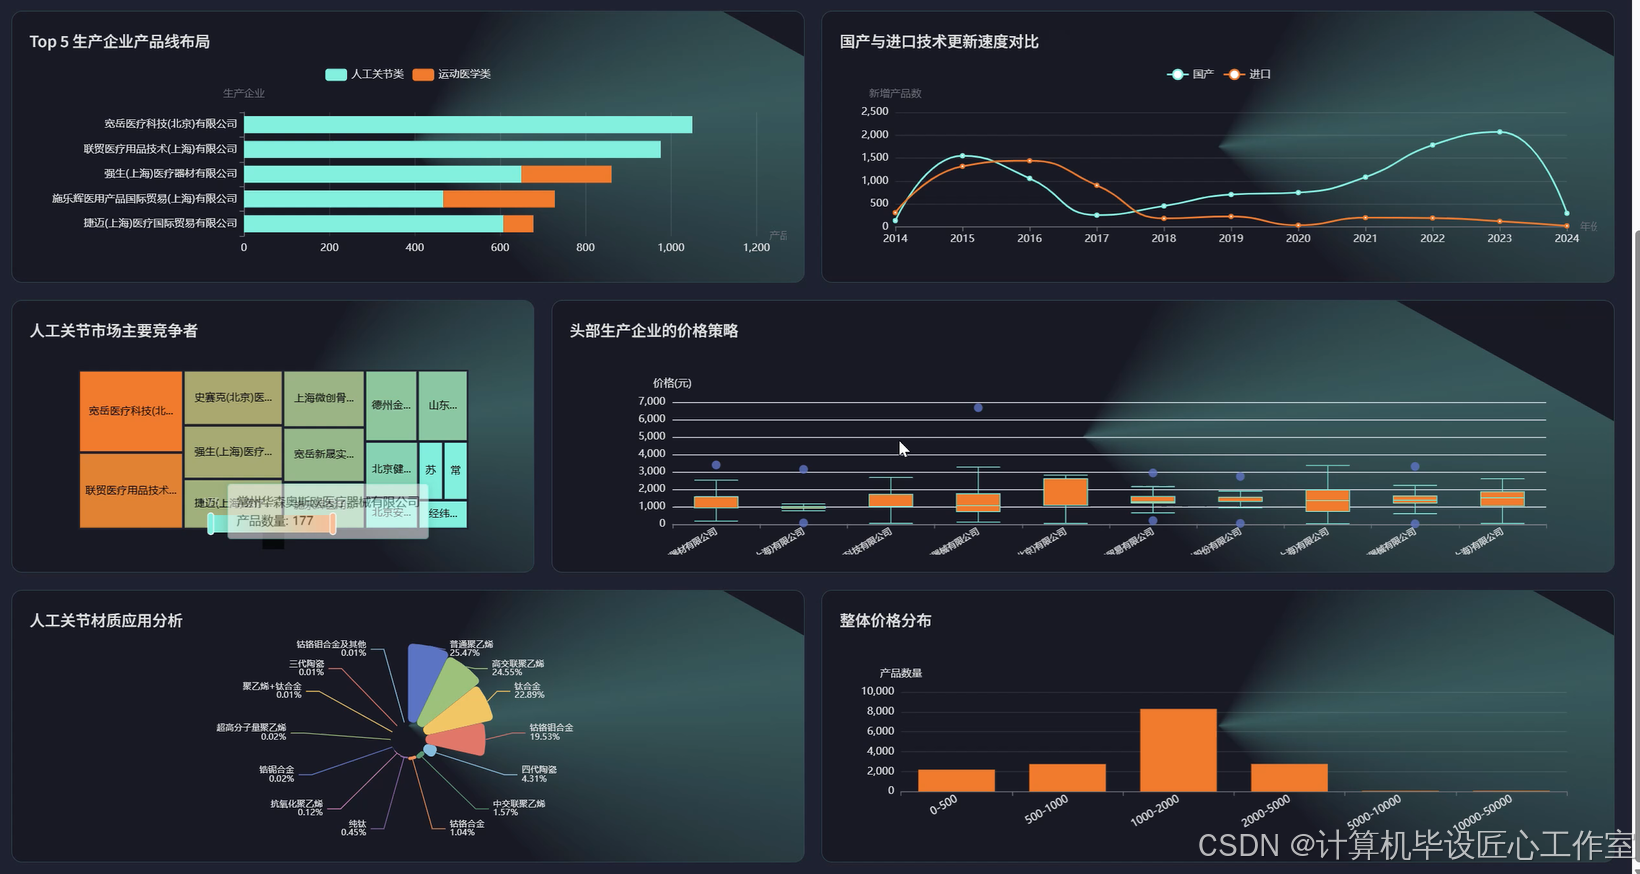
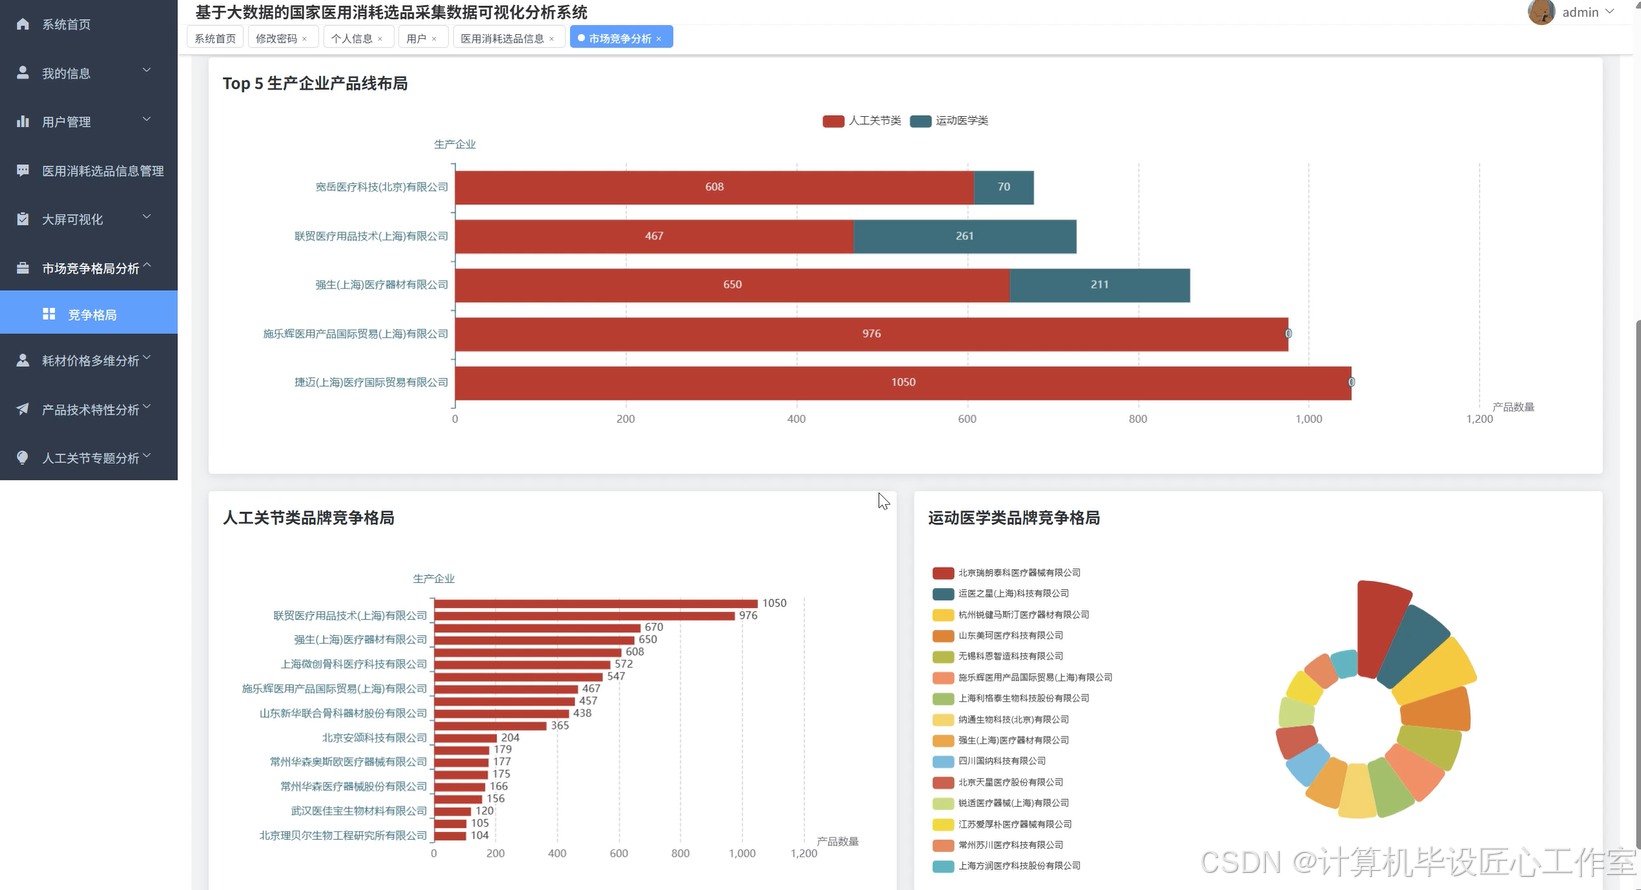
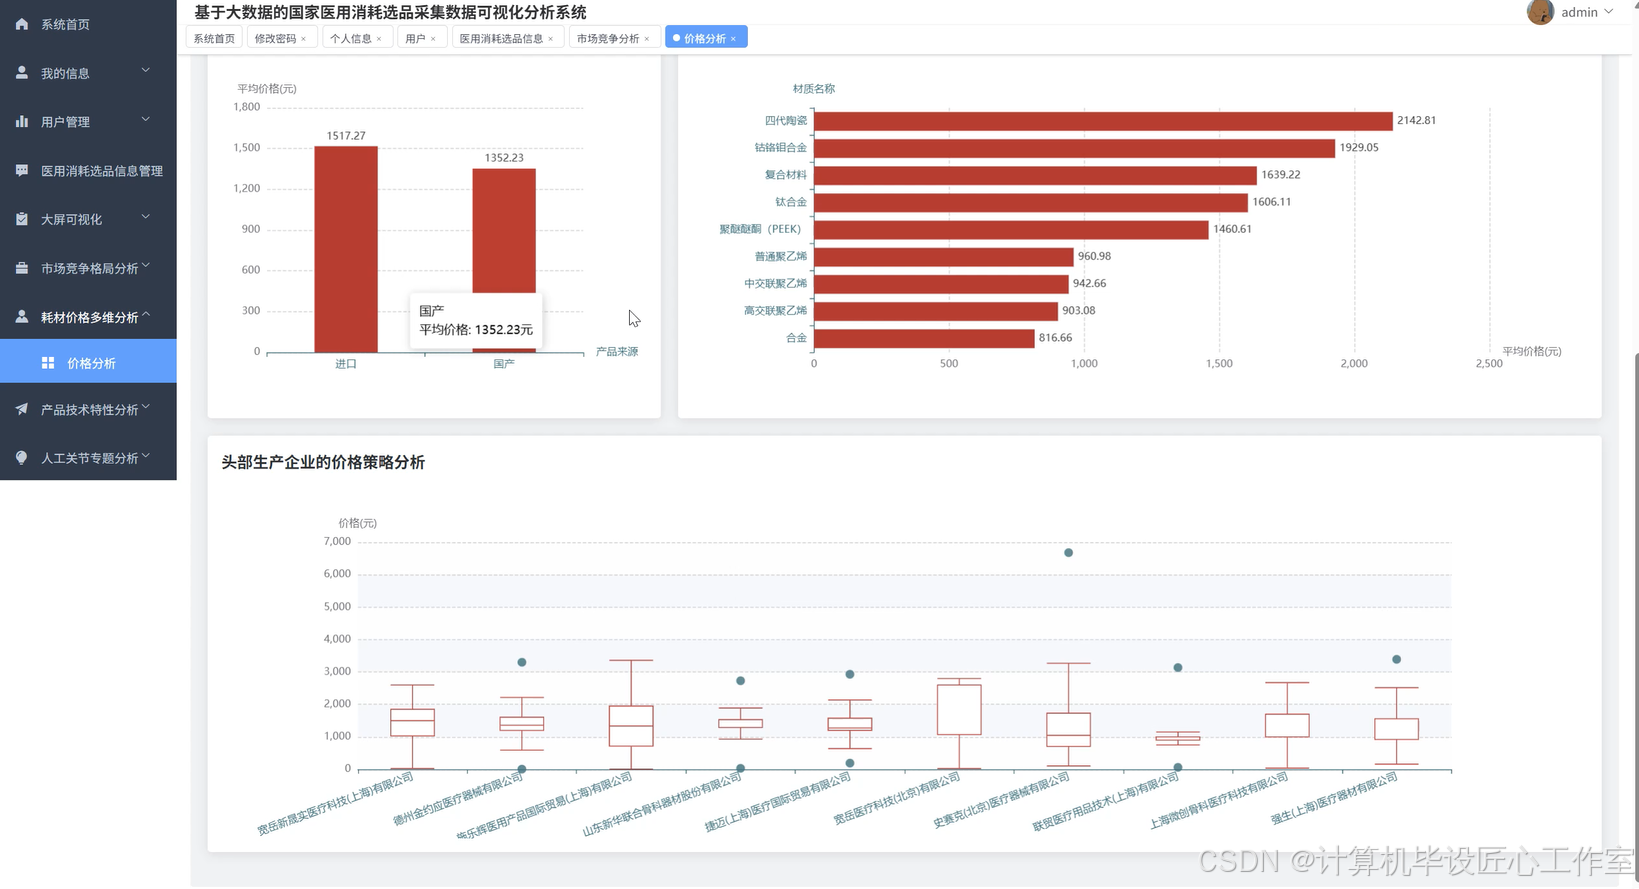
基于大数据的国家医用消耗选品采集数据可视化分析系统-功能介绍
基于大数据的国家医用消耗选品采集数据可视化分析系统是一套综合性的医疗耗材数据处理与分析平台,采用Hadoop分布式存储架构和Spark大数据计算引擎作为核心技术支撑。系统通过Python语言开发,基于Django框架构建后端服务,前端采用Vue+ElementUI+Echarts技术栈实现交互界面和数据可视化展示。系统主要功能涵盖医用耗材数据的采集、清洗、存储和多维度分析,能够对国家集中采购的医用消耗品进行价格水平分析、市场竞争格局评估、产品特性趋势研判以及特定品类的专题分析。通过Spark SQL和Pandas、NumPy等数据处理工具,系统可以高效处理大规模医疗耗材数据,运用HDFS分布式文件系统确保数据安全存储,同时借助MySQL数据库进行结构化数据管理。系统最终通过Echarts图表库将分析结果以直观的可视化形式呈现,为医疗机构采购决策、政府监管部门政策制定以及医疗耗材生产企业市场策略调整提供数据支持和决策参考。
基于大数据的国家医用消耗选品采集数据可视化分析系统-选题背景意义
选题背景
随着我国医疗卫生事业的快速发展和医改政策的深入推进,医用耗材在医疗服务中的地位日益重要,其采购管理也面临着前所未有的挑战。国家医保局自2019年开始实施高值医用耗材集中带量采购政策,旨在通过规模化采购降低医疗成本,规范市场秩序。在这一背景下,医用耗材的品种繁多、价格差异显著、技术更新迅速等特点使得传统的人工分析方式已难以满足大规模数据处理需求。医疗机构在选择耗材时需要综合考虑产品质量、价格水平、供应商信誉等多重因素,而政府监管部门也需要实时掌握市场动态,制定合理的采购政策。目前市场上缺乏专门针对医用耗材数据进行深度分析的信息系统,大部分医疗机构和监管部门仍依赖传统的表格统计方式处理数据,效率低下且容易出错。因此,构建一套基于大数据技术的医用耗材采集分析系统,对于提高数据处理效率、优化采购决策具有重要的现实需求。
选题意义
本课题的研究具有多方面的实际应用价值和理论探索意义。从技术角度来看,该系统将大数据处理技术应用于医疗耗材管理领域,为传统医疗行业数字化转型提供了技术方案参考,有助于推动医疗信息化建设进程。从管理实践层面分析,系统能够帮助医疗机构建立科学的耗材选择机制,通过数据驱动的方式替代经验导向的决策模式,提升采购管理的规范性和效率。对于政府监管部门而言,系统提供的市场分析功能可以辅助制定更加精准的政策措施,监控市场价格变动,预防垄断行为的发生。从学术研究价值来说,本课题探索了大数据技术在特定垂直领域的应用模式,为后续相关研究提供了实践基础。同时,系统的可视化分析功能使复杂的数据关系变得直观易懂,降低了专业人员使用门槛,提高了数据分析成果的传播效果。虽然作为毕业设计项目,系统在功能完善性和处理规模上存在一定局限,但其设计理念和技术架构仍具有一定的参考价值,为解决实际问题提供了有益尝试。
基于大数据的国家医用消耗选品采集数据可视化分析系统-技术选型
大数据框架:Hadoop+Spark(本次没用Hive,支持定制)
开发语言:Python+Java(两个版本都支持)
后端框架:Django+Spring Boot(Spring+SpringMVC+Mybatis)(两个版本都支持)
前端:Vue+ElementUI+Echarts+HTML+CSS+JavaScript+jQuery
详细技术点:Hadoop、HDFS、Spark、Spark SQL、Pandas、NumPy
数据库:MySQL
基于大数据的国家医用消耗选品采集数据可视化分析系统-视频展示
计算机毕设选题神器:Python+Django医用耗材采集数据分析系统完整教程
基于大数据的国家医用消耗选品采集数据可视化分析系统-图片展示
基于大数据的国家医用消耗选品采集数据可视化分析系统-代码展示
from pyspark.sql import SparkSession
from pyspark.sql.functions import col, avg, count, desc, asc, when, regexp_extract
import pandas as pd
import numpy as np
from django.http import JsonResponse
from django.views.decorators.csrf import csrf_exempt
import json
spark = SparkSession.builder.appName("MedicalSuppliesAnalysis").config("spark.sql.adaptive.enabled", "true").getOrCreate()
@csrf_exempt
def price_level_analysis(request):
df = spark.read.format("jdbc").option("url", "jdbc:mysql://localhost:3306/medical_db").option("dbtable", "medical_supplies").option("user", "root").option("password", "password").option("driver", "com.mysql.cj.jdbc.Driver").load()
df_cleaned = df.filter(col("price").isNotNull() & (col("price") > 0))
price_stats = df_cleaned.agg({"price": "min", "price": "max", "price": "avg", "price": "stddev"}).collect()[0]
min_price = float(price_stats[0])
max_price = float(price_stats[1])
avg_price = float(price_stats[2])
std_price = float(price_stats[3])
price_ranges = [(0, 100), (100, 500), (500, 1000), (1000, 5000), (5000, float('inf'))]
range_counts = []
for min_range, max_range in price_ranges:
if max_range == float('inf'):
count_in_range = df_cleaned.filter(col("price") >= min_range).count()
else:
count_in_range = df_cleaned.filter((col("price") >= min_range) & (col("price") < max_range)).count()
range_counts.append({"range": f"{min_range}-{max_range if max_range != float('inf') else '以上'}", "count": count_in_range})
category_price_avg = df_cleaned.groupBy("product_category").agg(avg("price").alias("avg_price"), count("*").alias("product_count")).orderBy(desc("avg_price"))
category_price_data = [{"category": row["product_category"], "avg_price": round(float(row["avg_price"]), 2), "count": row["product_count"]} for row in category_price_avg.collect()]
domestic_import_df = df_cleaned.withColumn("product_source", when(col("registration_number").rlike("^国械"), "国产").otherwise("进口"))
source_price_comparison = domestic_import_df.groupBy("product_source").agg(avg("price").alias("avg_price"), count("*").alias("count")).collect()
source_data = [{"source": row["product_source"], "avg_price": round(float(row["avg_price"]), 2), "count": row["count"]} for row in source_price_comparison]
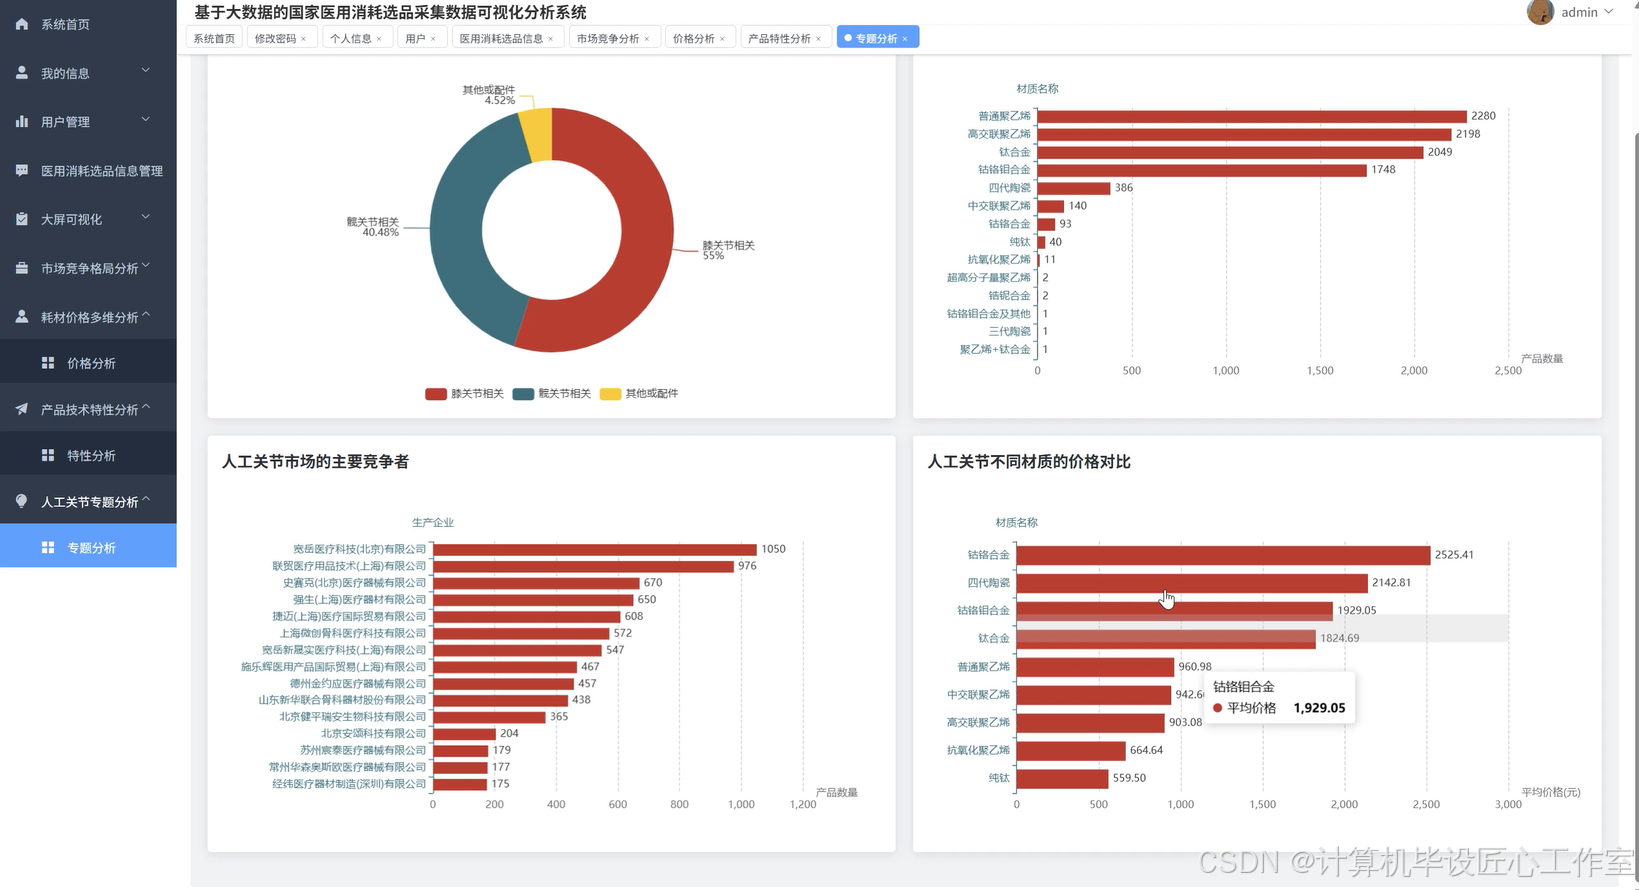
material_price_analysis = df_cleaned.filter(col("material_name").isNotNull()).groupBy("material_name").agg(avg("price").alias("avg_price"), count("*").alias("count")).filter(col("count") >= 10).orderBy(desc("avg_price"))
material_data = [{"material": row["material_name"], "avg_price": round(float(row["avg_price"]), 2), "count": row["count"]} for row in material_price_analysis.collect()[:20]]
top_companies = df_cleaned.groupBy("manufacturer").agg(count("*").alias("product_count")).orderBy(desc("product_count")).limit(10)
company_price_data = []
for company_row in top_companies.collect():
company_name = company_row["manufacturer"]
company_products = df_cleaned.filter(col("manufacturer") == company_name)
price_percentiles = company_products.select("price").rdd.map(lambda x: float(x[0])).collect()
price_percentiles.sort()
percentile_25 = np.percentile(price_percentiles, 25)
percentile_50 = np.percentile(price_percentiles, 50)
percentile_75 = np.percentile(price_percentiles, 75)
company_price_data.append({"company": company_name, "q1": round(percentile_25, 2), "median": round(percentile_50, 2), "q3": round(percentile_75, 2), "min": round(min(price_percentiles), 2), "max": round(max(price_percentiles), 2)})
result = {"overall_stats": {"min_price": round(min_price, 2), "max_price": round(max_price, 2), "avg_price": round(avg_price, 2), "std_price": round(std_price, 2)}, "price_distribution": range_counts, "category_price": category_price_data, "source_comparison": source_data, "material_analysis": material_data, "company_price_strategy": company_price_data}
return JsonResponse(result)
@csrf_exempt
def market_competition_analysis(request):
df = spark.read.format("jdbc").option("url", "jdbc:mysql://localhost:3306/medical_db").option("dbtable", "medical_supplies").option("user", "root").option("password", "password").option("driver", "com.mysql.cj.jdbc.Driver").load()
df_valid = df.filter(col("manufacturer").isNotNull() & (col("manufacturer") != ""))
brand_concentration = df_valid.groupBy("manufacturer").agg(count("*").alias("product_count")).orderBy(desc("product_count"))
top_20_brands = brand_concentration.limit(20).collect()
total_products = df_valid.count()
brand_data = []
cumulative_share = 0
for i, row in enumerate(top_20_brands):
share = round((row["product_count"] / total_products) * 100, 2)
cumulative_share += share
brand_data.append({"rank": i+1, "manufacturer": row["manufacturer"], "product_count": row["product_count"], "market_share": share, "cumulative_share": round(cumulative_share, 2)})
domestic_import_df = df_valid.withColumn("product_source", when(col("registration_number").rlike("^国械"), "国产").otherwise("进口"))
source_distribution = domestic_import_df.groupBy("product_source").agg(count("*").alias("count")).collect()
source_share_data = []
for row in source_distribution:
share = round((row["count"] / total_products) * 100, 2)
source_share_data.append({"source": row["product_source"], "count": row["count"], "percentage": share})
top_5_companies = brand_concentration.limit(5).collect()
company_portfolio_data = []
for company_row in top_5_companies:
company_name = company_row["manufacturer"]
company_categories = df_valid.filter(col("manufacturer") == company_name).groupBy("product_category").agg(count("*").alias("category_count")).orderBy(desc("category_count"))
categories = [{"category": row["product_category"], "count": row["category_count"]} for row in company_categories.collect()]
total_company_products = sum([cat["count"] for cat in categories])
for category in categories:
category["percentage"] = round((category["count"] / total_company_products) * 100, 2)
company_portfolio_data.append({"company": company_name, "total_products": total_company_products, "category_distribution": categories})
key_categories = ["人工关节类", "心血管介入器械", "眼科人工晶体", "骨科植入物"]
category_competition_data = []
for category in key_categories:
if df_valid.filter(col("product_category") == category).count() > 0:
category_brands = df_valid.filter(col("product_category") == category).groupBy("manufacturer").agg(count("*").alias("count")).orderBy(desc("count"))
category_total = df_valid.filter(col("product_category") == category).count()
top_brands_in_category = []
for row in category_brands.limit(10).collect():
brand_share = round((row["count"] / category_total) * 100, 2)
top_brands_in_category.append({"manufacturer": row["manufacturer"], "count": row["count"], "share": brand_share})
hhi_index = sum([(brand["share"] / 100) ** 2 for brand in top_brands_in_category])
market_concentration = "高度集中" if hhi_index > 0.25 else "中度集中" if hhi_index > 0.15 else "低度集中"
category_competition_data.append({"category": category, "total_products": category_total, "top_brands": top_brands_in_category, "hhi_index": round(hhi_index, 4), "concentration_level": market_concentration})
result = {"brand_concentration": brand_data, "market_share": source_share_data, "company_portfolio": company_portfolio_data, "category_competition": category_competition_data}
return JsonResponse(result)
@csrf_exempt
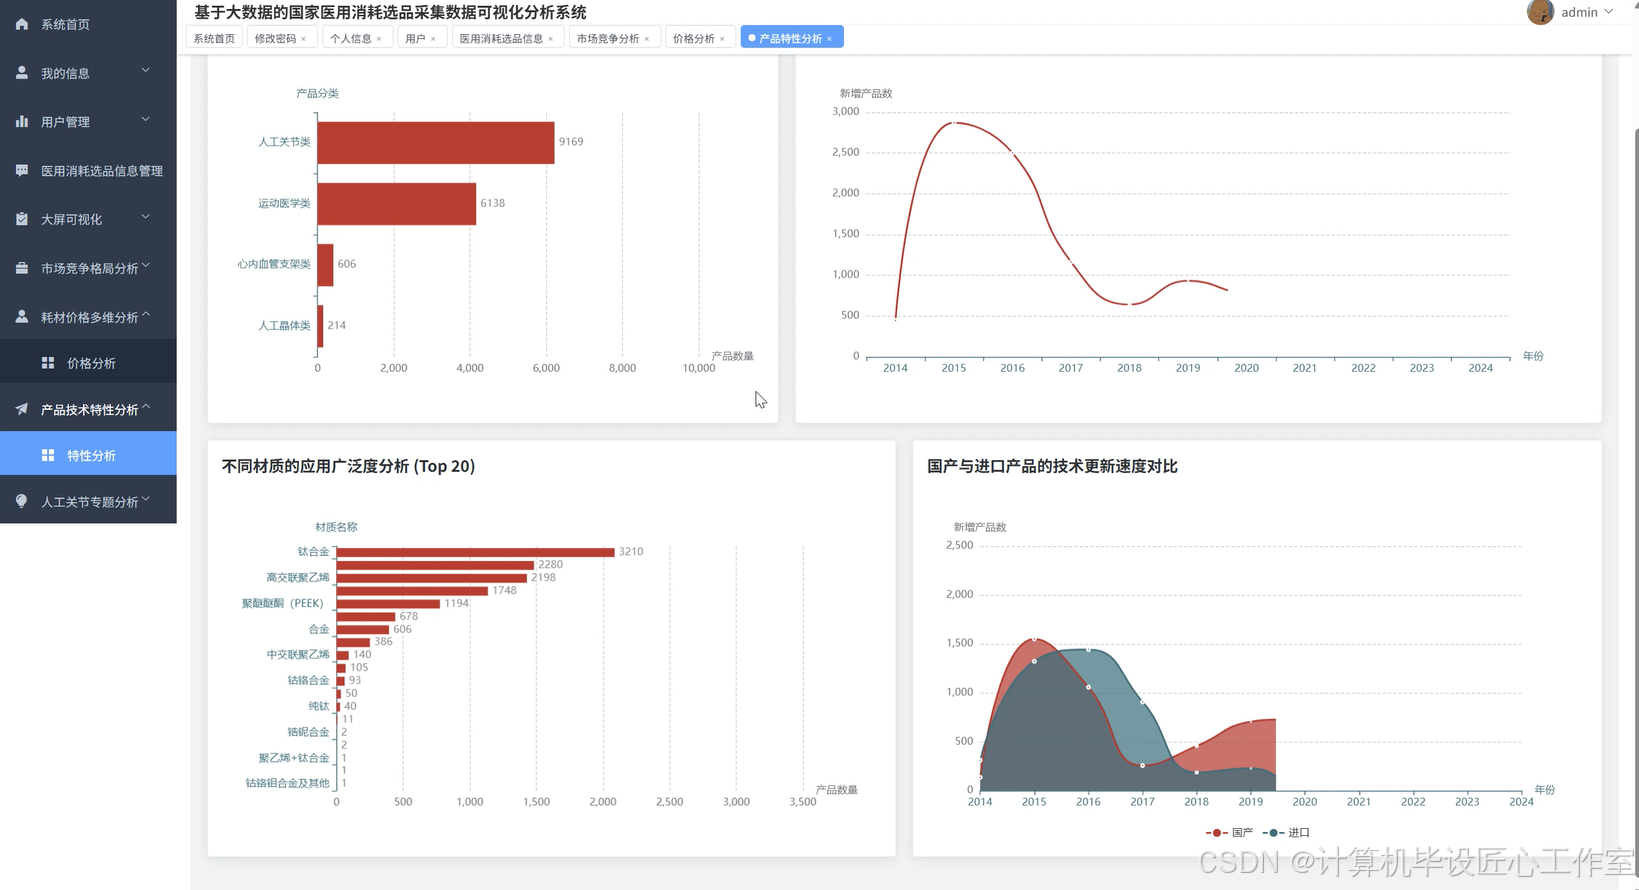
def product_trend_analysis(request):
df = spark.read.format("jdbc").option("url", "jdbc:mysql://localhost:3306/medical_db").option("dbtable", "medical_supplies").option("user", "root").option("password", "password").option("driver", "com.mysql.cj.jdbc.Driver").load()
df_valid = df.filter(col("product_category").isNotNull() & (col("product_category") != ""))
category_distribution = df_valid.groupBy("product_category").agg(count("*").alias("count")).orderBy(desc("count"))
total_products = df_valid.count()
category_data = []
for row in category_distribution.collect():
percentage = round((row["count"] / total_products) * 100, 2)
category_data.append({"category": row["product_category"], "count": row["count"], "percentage": percentage})
df_with_year = df_valid.withColumn("registration_year", regexp_extract(col("registration_number"), r"(\d{4})", 1).cast("int"))
df_year_valid = df_with_year.filter((col("registration_year") >= 2010) & (col("registration_year") <= 2024))
yearly_registration = df_year_valid.groupBy("registration_year").agg(count("*").alias("count")).orderBy("registration_year")
yearly_trend_data = [{"year": row["registration_year"], "count": row["count"]} for row in yearly_registration.collect()]
growth_rates = []
for i in range(1, len(yearly_trend_data)):
current_count = yearly_trend_data[i]["count"]
previous_count = yearly_trend_data[i-1]["count"]
growth_rate = round(((current_count - previous_count) / previous_count) * 100, 2) if previous_count > 0 else 0
yearly_trend_data[i]["growth_rate"] = growth_rate
df_material_valid = df_valid.filter(col("material_name").isNotNull() & (col("material_name") != ""))
material_distribution = df_material_valid.groupBy("material_name").agg(count("*").alias("count")).orderBy(desc("count"))
material_data = []
for row in material_distribution.limit(30).collect():
material_data.append({"material": row["material_name"], "count": row["count"]})
material_trend_weights = {}
for material in material_data:
material_name = material["material"]
material_yearly = df_year_valid.filter(col("material_name") == material_name).groupBy("registration_year").agg(count("*").alias("yearly_count")).orderBy("registration_year")
yearly_counts = [row["yearly_count"] for row in material_yearly.collect()]
if len(yearly_counts) >= 3:
recent_avg = sum(yearly_counts[-3:]) / 3
early_avg = sum(yearly_counts[:3]) / 3 if len(yearly_counts) >= 6 else sum(yearly_counts[:-3]) / len(yearly_counts[:-3]) if len(yearly_counts) > 3 else early_avg
trend_weight = recent_avg / early_avg if early_avg > 0 else 1
material_trend_weights[material_name] = round(trend_weight, 2)
material["trend_weight"] = material_trend_weights.get(material_name, 1.0)
domestic_import_df = df_year_valid.withColumn("product_source", when(col("registration_number").rlike("^国械"), "国产").otherwise("进口"))
innovation_comparison = domestic_import_df.groupBy("registration_year", "product_source").agg(count("*").alias("count")).orderBy("registration_year", "product_source")
innovation_data = {}
for row in innovation_comparison.collect():
year = row["registration_year"]
source = row["product_source"]
count = row["count"]
if year not in innovation_data:
innovation_data[year] = {"国产": 0, "进口": 0}
innovation_data[year][source] = count
innovation_trend_data = []
for year in sorted(innovation_data.keys()):
domestic_count = innovation_data[year].get("国产", 0)
import_count = innovation_data[year].get("进口", 0)
total_year_count = domestic_count + import_count
domestic_ratio = round((domestic_count / total_year_count) * 100, 2) if total_year_count > 0 else 0
import_ratio = round((import_count / total_year_count) * 100, 2) if total_year_count > 0 else 0
innovation_trend_data.append({"year": year, "domestic_count": domestic_count, "import_count": import_count, "domestic_ratio": domestic_ratio, "import_ratio": import_ratio})
result = {"category_composition": category_data, "yearly_registration_trend": yearly_trend_data, "material_popularity": material_data, "innovation_speed_comparison": innovation_trend_data}
return JsonResponse(result)
基于大数据的国家医用消耗选品采集数据可视化分析系统-结语
👇🏻 精彩专栏推荐订阅 👇🏻 不然下次找不到哟~
Java实战项目
Python实战项目
微信小程序|安卓实战项目
大数据实战项目
PHP|C#.NET|Golang实战项目
🍅 主页获取源码联系🍅

DAMO开发者矩阵,由阿里巴巴达摩院和中国互联网协会联合发起,致力于探讨最前沿的技术趋势与应用成果,搭建高质量的交流与分享平台,推动技术创新与产业应用链接,围绕“人工智能与新型计算”构建开放共享的开发者生态。
更多推荐
 12
12 0
0- 0


 已为社区贡献2条内容

所有评论(0)