Carla俯视地图二维坐标系——由三维世界坐标点转换为二维像素坐标点,计算变换矩阵
问题及需求
获取当前carla世界三维坐标的二维俯视坐标系表达,即将三维坐标投射到二维坐标系上。
可将carla世界的三维坐标转换为俯视地图上的二维坐标。
可以将汽车在carla世界的连续坐标,投射到俯视地图中,获得汽车轨迹的直观表述。
当前环境
-
Ubuntu 20.04.6 LTS
-
carla0.9.14
程序位置
实现效果
问题解决1-获取carla三维三维点坐标
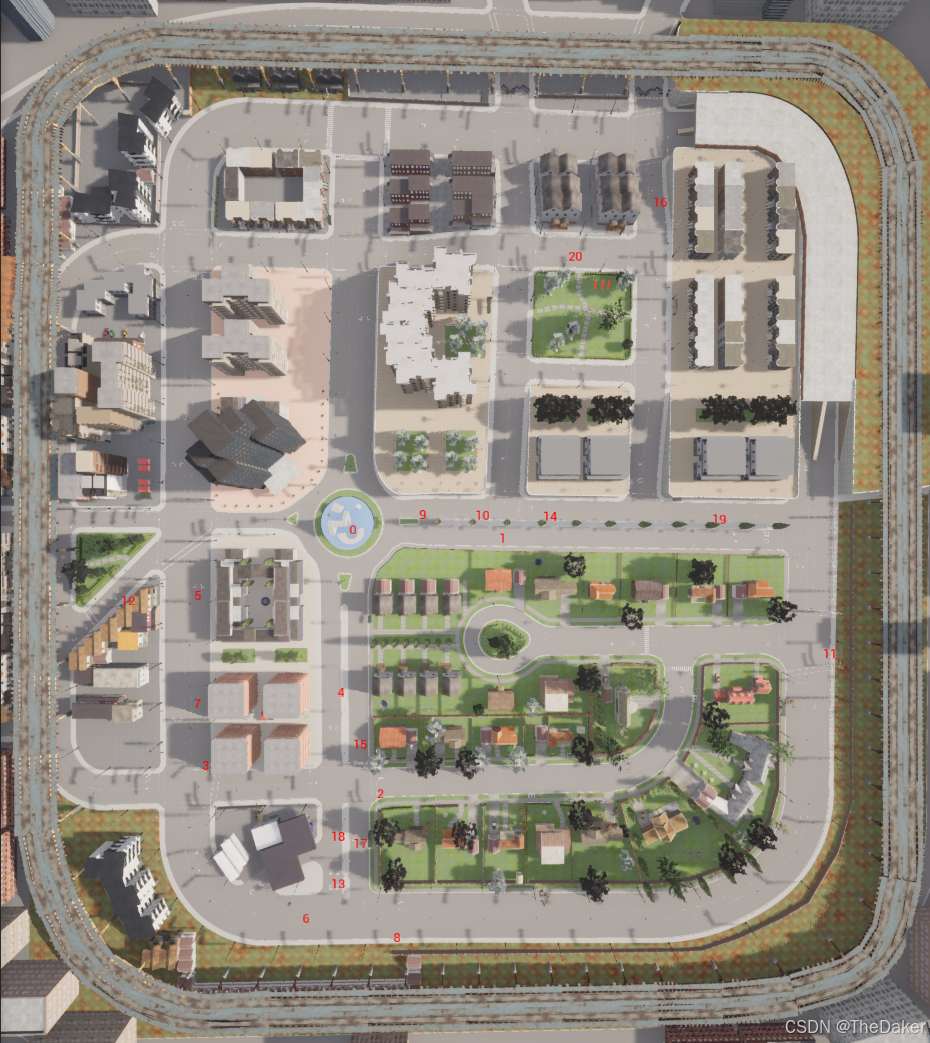
加载carla地图,设置俯视观察视角,可选是否卸载地图除路网外的其他元素,在carla世界中生成原点和随机点,在carla世界中将其绘制出来,并将carla世界三维点坐标保存到carla_points2.txt中
此时还需截图当前carla俯视图,应包含carla整个世界,其中一个包含绘制点,一个不包含,注意两个截图大小位置应完全相同,保存为carla_town03_allmap_points.png,carla_town03_allmap.png两个文件
关键程序1-设置俯视观察视角
def set_spectator_transform():
    # world = client.get_world()#获取世界
    spectator = world.get_spectator()
    spectator_transform = carla.Transform(
        carla.Location(x=0.0, y=0.0, z=200.0),
        carla.Rotation(pitch=-90,yaw=-90)  # 设置俯视角度
    )
    spectator.set_transform(spectator_transform)
关键程序2-生成并绘制世界原点和随机点
def get_spawn_points(num_points):
    map = world.get_map()
    # 获取所有可能的车辆生成点
    spawn_points = map.get_spawn_points()
    # 随机选择生成点
    random.shuffle(spawn_points)
    vehicle_spawn_points = spawn_points[:num_points]
    #将第一个点的location设置为0,0,0
    vehicle_spawn_points[0].location = carla.Location(0,0,0)
    # 在地图上标记这10个点,并显示编号
    for index, spawn_point in enumerate(vehicle_spawn_points):
        # 在地面上绘制一个3D文本显示数字
        text = str(index)
        world.debug.draw_string(spawn_point.location, text, draw_shadow=False,
                                color=carla.Color(r=255, g=0, b=0), life_time=600.0,
                                persistent_lines=True)
    return vehicle_spawn_points
问题解决2-获取图片二维像素点坐标
读取carla_town03_allmap_points.png文件,依照上面carla世界点的位置,左键标记所有绘制点,此时得到carla世界点坐标对应的像素坐标,保存到Img_lable2.txt中
关键程序-读取照片并可以标记储存像素点
import os
import cv2 as cv
import numpy as np

img_name = "Coordinate_system/carla_town03_allmap_points.png"
# name = "Town03.jpg"
file_name = 'Coordinate_system/img_label_2.txt'
data = []
def readImage(img_name):
    img1 = cv.imread(img_name)
    return img1
def draw_(event, x, y,flag, param):
    global  data, img1
    if event == cv.EVENT_LBUTTONDOWN:
        """左键单击打标签"""
        xy = "%d,%d" % (x, y)
        cv.circle(img1, (x, y),2, (255, 0, 0), thickness=-1)
        data.append([x,y])
def save_points(file_name):
    with open(file_name, 'w') as f:
        for i in range(len(data)):
            f.write(f"{data[i][0]}, {data[i][1]}\n")
        f.close()
    ab_filename = os.path.abspath(file_name)
    print(ab_filename)

try:
    cv.namedWindow('image',cv.WINDOW_NORMAL)
    cv.setMouseCallback('image', draw_)
    img1 = readImage(img_name)
    while 1:
        cv.imshow('image', img1)
        c = cv.waitKey(10) & 0xFF
        if c == ord('c'): #按c退出
            break
        f = cv.waitKey(10) & 0xFF    # 按f保存
        if f == ord('f'):
            save_points(file_name)
finally:
    cv.destroyAllWindows()
问题解决3-计算转换矩阵
读取carla_points2.txt和Img_lable2.txt,计算出carla世界点坐标和像素点坐标之间的转换矩阵
将旋转、缩放、平移矩阵和总的变换矩阵保存到translation_matrix.txt中
计算carla世界原点坐标对应像素原点坐标,并计算carla世界坐标点距离差和像素点坐标距离差的对应比例
关键程序1-计算转换矩阵
def compute_transform_parameters(points_a, points_b):
    """
    计算缩放因子、旋转角度和平移量。
    """
    # 目标函数,最小化残差
    def residuals(params, points_a, points_b):
        sx, sy, theta, tx, ty = params
        c, s = np.cos(theta), np.sin(theta)
        rotation_matrix = np.array([[c, -s], [s, c]])
        scale_matrix = np.array([[sx, 0], [0, sy]])
        transformation_matrix = rotation_matrix  @ scale_matrix
        transformed_points = np.dot(points_a, transformation_matrix.T) + [tx, ty]
        return (transformed_points - points_b).flatten()  # 展平为一维数组
    initial_guess = [1.0, 1.0, 0.0, 0.0, 0.0]  # 初始猜测值  缩放因子sx, sy,旋转角,平移x,平移y
    result = least_squares(residuals, initial_guess, args=(points_a, points_b))  #使用最小二乘法优化
    return result.x[0], result.x[1], result.x[2], result.x[3], result.x[4]
关键程序2- 构建变换矩阵
def build_transformation_matrix(sx, sy, angle, translation):
    """
    根据给定的参数构建变换矩阵。
    """
    c, s = np.cos(angle), np.sin(angle)
    rotation_matrix = np.array([[c, -s, 0], [s, c, 0], [0, 0, 1]])
    print("Rotation angle (radians):")
    print(rotation_matrix)

    scale_matrix = np.array([[sx, 0, 0], [0, sy, 0], [0, 0, 1]])
    print("Scale factor:")
    print( scale_matrix)

    translation_matrix = np.array([[1, 0, translation[0]], [0, 1, translation[1]], [0, 0, 1]])
    print("Translation vector:" )
    print(translation_matrix)

    # 计算最终的变换矩阵
    transform_matrix = translation_matrix @  scale_matrix @  rotation_matrix
    print("\nFinal Transformation Matrix:")
    print(transform_matrix)
    print("----------------------------------------")
    return rotation_matrix,scale_matrix,translation_matrix,transform_matrix
关键程序3-计算原点坐标和两个坐标系的比例转换
def test_carla2img(points,transform_matrix,width,height):
    all_carla2img_points = []
    for point in points:
        print(f"carla point : {point}")
        carla2img_point = np.dot(point, transform_matrix[:2, :2].T)
        carla2img_point += transform_matrix[:2, 2]
        carla2img_point[0] += width/2
        carla2img_point[1] += height/2
        # 将carla2img_point四舍五入为整数
        carla2img_point = np.round(carla2img_point)
        # 化为整数
        carla2img_point = carla2img_point.astype(int)
        print(f"test_carla2img point: {carla2img_point}")
        print("----------------------------------------")
        all_carla2img_points.append(carla2img_point)
    gloal_interval_x,gloal_interval_y = 0,0
    num_x,num_y = 0,0
    for i in range(len(all_carla2img_points)-1):
        if all_carla2img_points[i][0] != all_carla2img_points[i+1][0]:
            gloal_interval_x += abs(all_carla2img_points[i][0]-all_carla2img_points[i+1][0])
            num_x += 1
        if all_carla2img_points[i][1] !=  all_carla2img_points[i+1][1]:
            gloal_interval_y += abs(all_carla2img_points[i][1]-all_carla2img_points[i+1][1])
            num_y += 1
    grid_interval_x =gloal_interval_x/num_x
    grid_interval_y = gloal_interval_y/num_y
问题解决4-绘制carla世界俯视二维坐标系
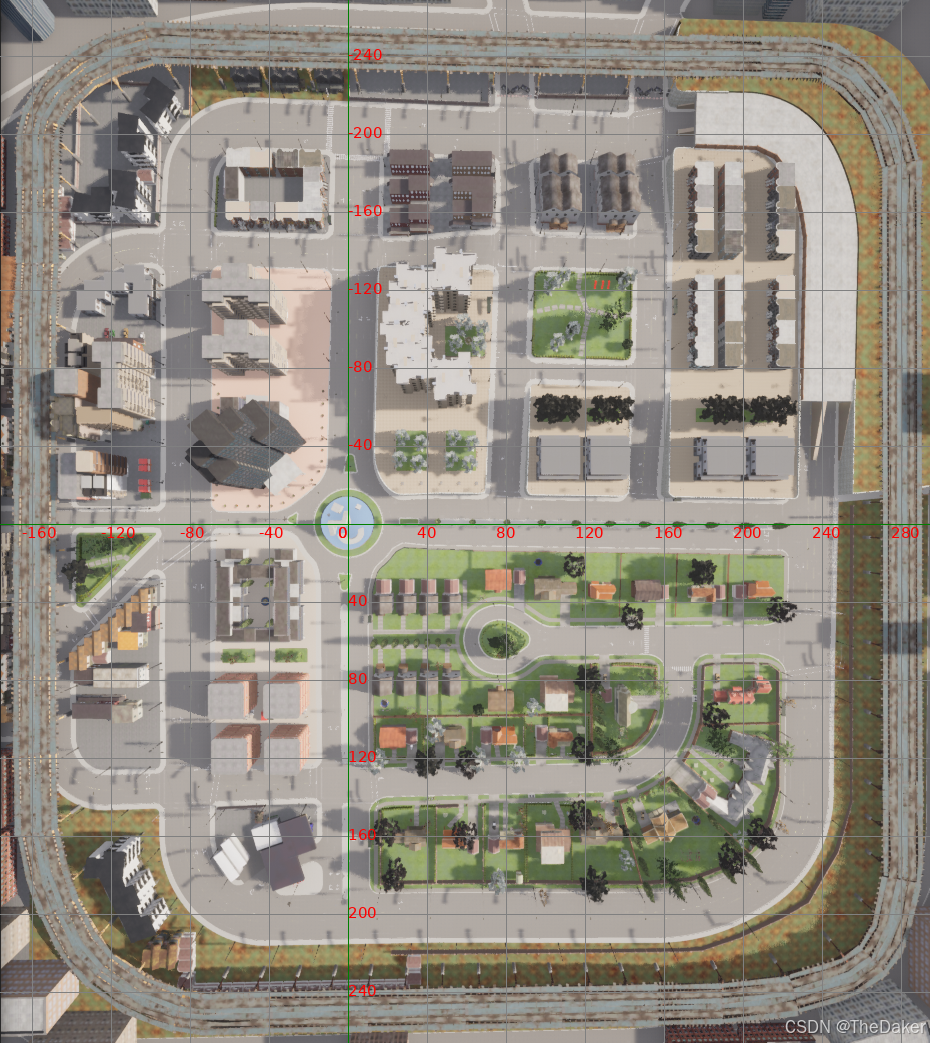
将第一步得到的carla_town03_allmap.png
第三步得到的像素原点坐标,carla世界坐标点距离差和像素点坐标距离差的对应比例
提供给create_grid_on_image绘制方法,并给定输出位置
绘制一张carla世界俯视二维坐标系
关键程序-绘制坐标系
def create_grid_on_image(image_path, origin,grid_interval_x,grid_interval_y,add_x,add_y, output_path):
    try:
        # 加载图像
        img = Image.open(image_path)
    except IOError as e:
        print(f"Error opening image file: {e}")
        return
    draw = ImageDraw.Draw(img)
    # 获取图像尺寸
    width, height = img.size
    # 设置坐标轴的颜色
    axis_color = 'green'
    grid_color = 'gray'
    label_color = 'red'
    # 尝试加载字体
    try:
        # font = ImageFont.truetype("STKaiti", 20)
        fontsize = 15
        font = ImageFont.truetype(fm.findfont(fm.FontProperties(family='DejaVu Sans')),fontsize)
    except IOError:
        # 如果找不到字体文件,则使用默认字体
        print("Error loading font. Using default font.")
        font = ImageFont.load_default()
    # 计算中心位置作为原点 (0,0)
    center_x = origin[0]
    center_y = origin[1]
    # 绘制网格线
    for x in range(center_x, width, grid_interval_x):
        draw.line([(x, 0), (x, height)], fill=grid_color)
    for x in range(center_x, 0, -grid_interval_x):
        draw.line([(x, 0), (x, height)], fill=grid_color)
    for y in range(center_y, height, grid_interval_y):
        draw.line([(0, y), (width, y)], fill=grid_color)
    for y in range(center_y, 0, -grid_interval_y):
        draw.line([(0, y), (width, y)], fill=grid_color)
    # 绘制坐标轴
    draw.line([(0, center_y), (width, center_y)], fill=axis_color)
    draw.line([(center_x, 0), (center_x, height)], fill=axis_color)
    # 在坐标轴上放置坐标值标签
    x_label_ps,x_label_ng = 0,0
    for x in range(center_x , width, grid_interval_x):
        draw.text((x-10, center_y ), str(x_label_ps), fill=label_color, font=font)
        x_label_ps += add_x
    for x in range(center_x , 0, -grid_interval_x):
        draw.text((x-10, center_y ), str(x_label_ng), fill=label_color, font=font)
        x_label_ng -= add_x
    y_label_ps,y_label_ng = 0,0
    for y in range(center_y+grid_interval_y, height, grid_interval_y):
        y_label_ps += add_y
        draw.text((center_x , y-10), str(y_label_ps), fill=label_color, font=font)
    for y in range(center_y-grid_interval_y, 0, -grid_interval_y):
        y_label_ng -= add_y
        draw.text((center_x , y-10), str(y_label_ng), fill=label_color, font=font)
    # 保存带有网格的图像
    img.save(output_path)
    img.show()

DAMO开发者矩阵,由阿里巴巴达摩院和中国互联网协会联合发起,致力于探讨最前沿的技术趋势与应用成果,搭建高质量的交流与分享平台,推动技术创新与产业应用链接,围绕“人工智能与新型计算”构建开放共享的开发者生态。
更多推荐
 21
21 0
0- 0


 已为社区贡献2条内容

所有评论(0)