echarts条形图 显示数据_Echarts条形图顶端设置显示数据【转】
代码series : [{name:‘金额‘,type:‘bar‘,barWidth: ‘60%‘,data:[10, 52, 200, 334, 390],barWidth : 30,itemStyle:{normal:{color:function(params) {// build a color map as your need.var colorList = [‘#C1232B‘,‘#B
代码
series : [
{
name:‘金额‘,
type:‘bar‘,
barWidth: ‘60%‘,
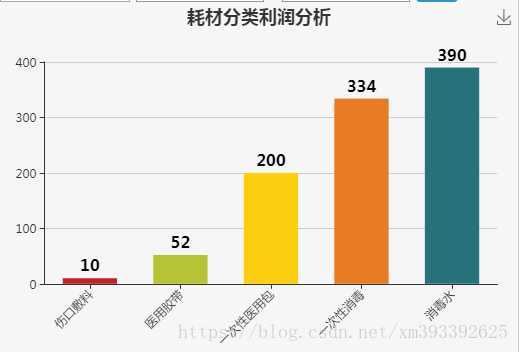
data:[10, 52, 200, 334, 390],
barWidth : 30,
itemStyle:{
normal:{
color:function(params) {
// build a color map as your need.
var colorList = [
‘#C1232B‘,‘#B5C334‘,‘#FCCE10‘,‘#E87C25‘,‘#27727B‘,
‘#FE8463‘,‘#9BCA63‘,‘#FAD860‘,‘#F3A43B‘,‘#60C0DD‘,
‘#D7504B‘,‘#C6E579‘,‘#F4E001‘,‘#F0805A‘,‘#26C0C0‘
];
return colorList[params.dataIndex]
},
label: {
show: true, //开启显示
position: ‘top‘, //在上方显示
textStyle: { //数值样式
color: ‘black‘,
fontSize: 16,
fontWeight: 600
}
}
}
}
}
]
效果图
原文:https://www.cnblogs.com/KillBugMe/p/13234205.html

DAMO开发者矩阵,由阿里巴巴达摩院和中国互联网协会联合发起,致力于探讨最前沿的技术趋势与应用成果,搭建高质量的交流与分享平台,推动技术创新与产业应用链接,围绕“人工智能与新型计算”构建开放共享的开发者生态。
更多推荐

 0
0 0
0- 0


 已为社区贡献2条内容

所有评论(0)