数据可视化之echart.js-vue实现3d 地理图绘制(飞线图,立柱图)
尝试echart能够实现的功能下载感兴趣的数据在页面中引用创建飞线创建立柱完整代码https://blog.csdn.net/hadry123/article/details/102456263 ↩︎
·
echart实现3D地理图的绘制
尝试echart能够实现的功能
绘制地图
- 下载地图geoJSON文件
- dataV-geoatlas
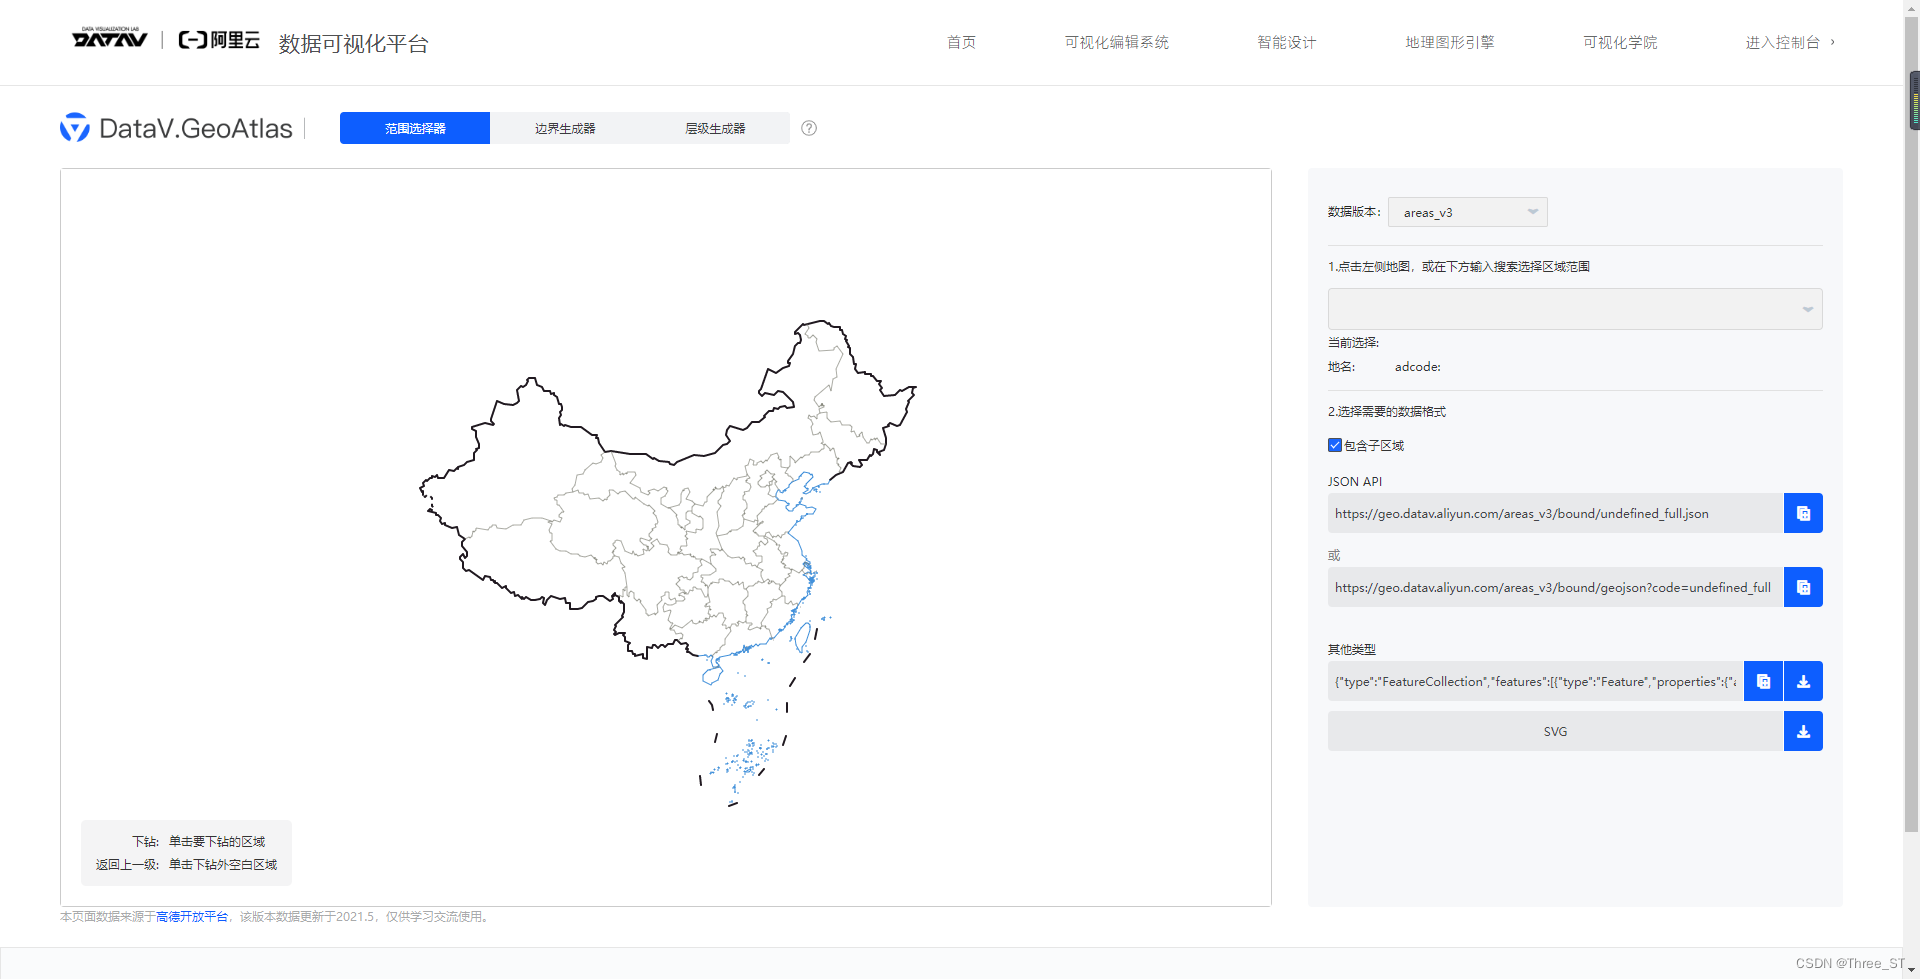
下载感兴趣的数据
- 引用echart,对于三维地图,需要引入echarts-gl这个组件1
npm install echarts
npm install echarts-gl
在页面中引用
<div id="echarts_map" ref="echarts_map"></div>
    this.myChart = this.$echarts.init(this.$refs.echarts_map);
      // 2. 注册可用的地图,只在 geo 组件或者map图表类型中使用
      this.$echarts.registerMap("wulingshan", mapjson); //用导入的json文件注册一个name:map 的地图组件
      // 3. 设置图表 option
      var option = {
        backgroundColor: "#000f1e",
        geo: {
          type: "map",
          map: "wulingshan",
          show: false,
        },
        geo3D: {
          map: "wulingshan",
          show: false,
          zlevel: -10,
          boxWidth: 200,
          boxHeight: 4, //4:没有bar. 30:有bar,bar最高度30,按比例分配高度
          regionHeight: 3,
          shading: "lambert",

          viewControl: {
            projection: "perspective",
            autoRotate: false,
            damping: 0,
            rotateSensitivity: 2, //旋转操作的灵敏度
            rotateMouseButton: "left", //旋转操作使用的鼠标按键
            zoomSensitivity: 2, //缩放操作的灵敏度
            panSensitivity: 2, //平移操作的灵敏度
            panMouseButton: "right", //平移操作使用的鼠标按键

            distance: 500, //默认视角距离主体的距离
            center: [0, 0, 0],

            animation: true,
            animationDurationUpdate: 1000,
            animationEasingUpdate: "cubicInOut",
          },
        },

        series: [
          {
            type: "map3D",
            map: "wulingshan",
            name: "wulingshan",
            selectedMode: "single", //地图高亮单选
            regionHeight: 5, //地图高度

            show: true,
            zlevel: 1,
            boxWidth: 200,
            //boxHeight: 4, //4:没有bar. 30:有bar,bar最高度30,按比例分配高度
            regionHeight: 3,
            shading: "lambert",
            label: {
              // 标签的相关设置
              show: false,
            },

            itemStyle: {
              color: "#2B5890",
              areaColor: "#025894",
              opacity: 0.8,
              borderWidth: 3,
              borderColor: "#5578A5",
            },
            emphasis: {
              label: {
                show: true,

                textStyle: {
                  color: "#fff",
                  fontSize: 14,
                  backgroundColor: "transparent", // 字体背景色
                },
              },
              shading: "lambert",

              borderColor: "#333",
              borderWidth: 5,
              itemStyle: {
                color: "#025894",
                areaColor: "#025894",
              },
            },
            light: {
              main: {
                shadow: true,
                shadowQuality: "ultra",
              },
            },

            viewControl: {
              projection: "perspective",
              autoRotate: false,
              damping: 0,
              rotateSensitivity: 2, //旋转操作的灵敏度
              rotateMouseButton: "left", //旋转操作使用的鼠标按键
              zoomSensitivity: 2, //缩放操作的灵敏度
              panSensitivity: 2, //平移操作的灵敏度
              panMouseButton: "right", //平移操作使用的鼠标按键

              distance: 500, //默认视角距离主体的距离
              center: [0, 0, 0],

              animation: true,
              animationDurationUpdate: 1000,
              animationEasingUpdate: "cubicInOut",
            },
          },
          {
            type: "scatter3D",
            coordinateSystem: "geo3D",
            zlevel: 3,
            // symbol:'path:// ',
            // symbol: 'path://m232.99844,160.209511l15.863519,0l0,-14.211071l16.27296,0l0,14.211071l15.863521,0l0,14.577861l-15.863521,0l0,14.211069l-16.27296,0l0,-14.211069l-15.863519,0l0,-14.577861z',
            symbol: "circle",
            symbolSize: 16,

            label: {
              normal: {
                show: true,
                position: "right",
                formatter: "{b}",

                textStyle: {
                  color: "#fff",
                  fontSize: 14,
                  backgroundColor: "transparent", // 字体背景色
                },
              },
            },

            data: [],
            itemStyle: {
              //坐标点颜色
              color: "#67AE94",
              shadowBlur: 20,
              shadowColor: "#fff",
            },
            emphasis: {
              itemStyle: {
                //坐标点颜色
                color: "#1ca1d2",
              },
            },
          },

        ],
      };

      // 4. myChart.setOption
      this.myChart.setOption(option);
创建飞线
// 线 和 点
          {
            type: "lines3D",
            coordinateSystem: "geo3D",
            zlevel: 1, //设置这个才会有轨迹线的小尾巴
            polyline: false,
            effect: {
              show: true,
              period: 10,
              trailLength: 0.1,
              trailColor: "#17eafe",
              color: "#fff", //流动点颜色
              symbol: "amarkLinesow",
              symbolSize: 6,
            },
            lineStyle: {
              normal: {
                color: "#fff", //线条颜色
                width: 1,
                curveness: 0.5,
                shadowColor: "#fff",
              },
            },
            blendMode: "lighter",
            data: [],
          },
创建立柱
          {
            type: "bar3D",
            name: "wulingshan",
            coordinateSystem: "geo3D",
            zlevel: 6,
            data: barPoints,
            label: {
              show: false,
              formatter: function (params) {
                return params.name + "\n" + params.value[0];
              },
            },
          },
完整代码
<template>
<div class="map">
<div id="echarts_map" ref="echarts_map"></div>
</div>
</template>
<script>
import { getCountyMapInfo, adcode2name } from "@/utils/map";
import mapjson from "../../../../public/map/500000_wulingshan.json";
export default {
components: {
},
data() {
return {
myChart: null,
type: "",
markPoint: [],
linesData: [],
mapData: {},
resources: {},
mapjson: null,
fontSize: 12,
activeIndex: "1",
showBack: false,
tooltipVisible: {
scene: false,
},
option: {},
};
},
mounted() {
console.log(this);
// 1. 创建一个 ECharts 实例,返回 echartsInstance,不能在单个容器上初始化多个 ECharts 实例
this.myChart = this.$echarts.init(this.$refs.echarts_map);
this.mapData = adcode2name;
this.initChart();
window.addEventListener("resize", this.onScreenResize);
this.onScreenResize();
setTimeout(() => {
this.initMapData();
}, 1000);
},
destroyed() {
window.addEventListener("resize", this.onScreenResize);
},
methods: {
initMapData() {
const mapUrl = "http://127.0.0.1:8000/api/map/files";
const mapListUrl = "http://127.0.0.1:8000/api/map/counties";
const resourceUrl = "http://127.0.0.1:8000/api/map/resources";
this.$.getJSON(mapUrl, (geoJson) => {
console.log(geoJson);
this.updateChart(geoJson);
});
this.$.getJSON(mapListUrl, (data) => {
console.log(typeof data, data instanceof Object);
this.mapData = data instanceof Object ? data : JSON.parse(data);
console.log(data, this.mapData);
});
this.$.getJSON(resourceUrl, (data) => {
console.log(typeof data, data instanceof Object);
this.resources = data instanceof Object ? data : JSON.parse(data);
console.log(data, this.resources);
});
},
updateChart(geoJson) {
this.mapjson = geoJson;
let points = geoJson.features.map((item) => {
let obj = {
name: item.properties.name,
value: [...item.properties.center, 1],
};
return obj;
});
let effectPoints = geoJson.features.map((item) => {
let obj = {
name: item.properties.name,
value: [...item.properties.center],
};
return obj;
});
this.markPoint = points;
let barPoints = geoJson.features.map((item) => {
let obj = {
name: item.properties.name,
value: [
item.properties.center[0] - 0.1,
item.properties.center[1] - 0.1,
Math.random()*10000,
],
};
return obj;
});
let markLines = [];
for (let i = 1; i < geoJson.features.length; i++) {
let prev = geoJson.features[i - 1];
let next = geoJson.features[i];
let obj = {
fromName: prev.properties?.name,
toName: "武陵山", //next.properties?.name,
coords: [
[107.593505859375, 29.538433074951173, 1],
[...prev.properties?.center, 1],
// [...next.properties?.center, 1],
],
};
markLines.push(obj);
}
this.linesData = markLines;
console.log(barPoints, points, effectPoints, markLines);
var option = {
backgroundColor: "#000f1e",
geo: {
type: "map",
map: "wulingshan",
show: false,
},
geo3D: {
map: "wulingshan",
show: false,
zlevel: -10,
boxWidth: 200,
boxHeight: 30, //4:没有bar. 30:有bar,bar最高度30,按比例分配高度
regionHeight: 10,
shading: "lambert",
viewControl: {
projection: "perspective",
autoRotate: false,
damping: 0,
rotateSensitivity: 2, //旋转操作的灵敏度
rotateMouseButton: "left", //旋转操作使用的鼠标按键
zoomSensitivity: 2, //缩放操作的灵敏度
panSensitivity: 2, //平移操作的灵敏度
panMouseButton: "right", //平移操作使用的鼠标按键
distance: 500, //默认视角距离主体的距离
center: [0, 0, 0],
animation: true,
animationDurationUpdate: 1000,
animationEasingUpdate: "cubicInOut",
},
},
series: [
{
type: "map3D",
map: "wulingshan",
name: "wulingshan",
selectedMode: "single", //地图高亮单选
regionHeight: 5, //地图高度
show: true,
zlevel: 1,
boxWidth: 200,
//boxHeight: 4, //4:没有bar. 30:有bar,bar最高度30,按比例分配高度
regionHeight: 3,
shading: "lambert",
label: {
// 标签的相关设置
show: false,
},
itemStyle: {
color: "#2B5890",
areaColor: "#025894",
opacity: 0.8,
borderWidth: 3,
borderColor: "#5578A5",
},
emphasis: {
label: {
show: true,
textStyle: {
color: "#fff",
fontSize: 14,
backgroundColor: "transparent", // 字体背景色
},
},
shading: "lambert",
borderColor: "#333",
borderWidth: 5,
itemStyle: {
color: "#025894",
areaColor: "#025894",
},
},
light: {
main: {
shadow: true,
shadowQuality: "ultra",
},
},
viewControl: {
projection: "perspective",
autoRotate: false,
damping: 0,
rotateSensitivity: 2, //旋转操作的灵敏度
rotateMouseButton: "left", //旋转操作使用的鼠标按键
zoomSensitivity: 2, //缩放操作的灵敏度
panSensitivity: 2, //平移操作的灵敏度
panMouseButton: "right", //平移操作使用的鼠标按键
distance: 500, //默认视角距离主体的距离
center: [0, 0, 0],
animation: true,
animationDurationUpdate: 1000,
animationEasingUpdate: "cubicInOut",
},
},
{
type: "scatter3D",
coordinateSystem: "geo3D",
zlevel: 3,
symbolSize: [16, 16],
data: [],
// itemStyle: {
// //坐标点颜色
// color: "#2681cf",
// shadowBlur: 20,
// shadowColor: "#fff",
// },
emphasis: {
// itemStyle: {
// //坐标点颜色
// color: "#1ca1d2",
// },
},
animation: true,
},
{
type: "scatter",
coordinateSystem: "geo3D",
zlevel: 5,
symbolSize: 16,
rippleEffect: {
scale: 5,
brushType: "stroke",
},
label: {
normal: {
show: true,
position: "right",
formatter: "{b}",
textStyle: {
color: "#fff",
fontSize: 14,
backgroundColor: "transparent", // 字体背景色
},
},
},
itemStyle: {
color: "#FFA500",
borderColor: "#FF8C00",
},
data: effectPoints,
},
// 线 和 点
{
type: "lines3D",
coordinateSystem: "geo3D",
zlevel: 1, //设置这个才会有轨迹线的小尾巴
polyline: false,
effect: {
show: true,
period: 10,
trailLength: 0.1,
trailColor: "#FFA500",
color: "#FFA500", //流动点颜色
symbol: "amarkLinesow",
symbolSize: 6,
},
lineStyle: {
normal: {
color: "#FFA500", //线条颜色
width: 1,
curveness: 0.5,
shadowColor: "#FF8C00",
},
},
blendMode: "lighter",
data: markLines,
},
{
type: "bar3D",
name: "wulingshan",
coordinateSystem: "geo3D",
zlevel: 6,
data: barPoints,
label: {
show: false,
formatter: function (params) {
return params.name + "\n" + params.value[0];
},
},
},
],
};
option.series[1].data = points;
option.series[2].data = effectPoints;
option.series[3].data = markLines;
this.myChart.setOption(option);
console.log(this.linesData, this.markPoint, option);
},
/*
geo:地理坐标系组件( https://echarts.apache.org/zh/option.html#geo)
地理坐标系组件用于地图的绘制,支持在地理坐标系上绘制散点图
*/
initChart() {
// 2. 注册可用的地图,只在 geo 组件或者map图表类型中使用
this.$echarts.registerMap("wulingshan", mapjson); //用导入的json文件注册一个name:map 的地图组件
// 3. 设置图表 option
var option = {
backgroundColor: "#000f1e",
geo: {
type: "map",
map: "wulingshan",
show: false,
},
geo3D: {
map: "wulingshan",
show: false,
zlevel: -10,
boxWidth: 200,
boxHeight: 4, //4:没有bar. 30:有bar,bar最高度30,按比例分配高度
regionHeight: 3,
shading: "lambert",
viewControl: {
projection: "perspective",
autoRotate: false,
damping: 0,
rotateSensitivity: 2, //旋转操作的灵敏度
rotateMouseButton: "left", //旋转操作使用的鼠标按键
zoomSensitivity: 2, //缩放操作的灵敏度
panSensitivity: 2, //平移操作的灵敏度
panMouseButton: "right", //平移操作使用的鼠标按键
distance: 500, //默认视角距离主体的距离
center: [0, 0, 0],
animation: true,
animationDurationUpdate: 1000,
animationEasingUpdate: "cubicInOut",
},
},
series: [
{
type: "map3D",
map: "wulingshan",
name: "wulingshan",
selectedMode: "single", //地图高亮单选
regionHeight: 5, //地图高度
show: true,
zlevel: 1,
boxWidth: 200,
//boxHeight: 4, //4:没有bar. 30:有bar,bar最高度30,按比例分配高度
regionHeight: 3,
shading: "lambert",
label: {
// 标签的相关设置
show: false,
},
itemStyle: {
color: "#2B5890",
areaColor: "#025894",
opacity: 0.8,
borderWidth: 3,
borderColor: "#5578A5",
},
emphasis: {
label: {
show: true,
textStyle: {
color: "#fff",
fontSize: 14,
backgroundColor: "transparent", // 字体背景色
},
},
shading: "lambert",
borderColor: "#333",
borderWidth: 5,
itemStyle: {
color: "#025894",
areaColor: "#025894",
},
},
light: {
main: {
shadow: true,
shadowQuality: "ultra",
},
},
viewControl: {
projection: "perspective",
autoRotate: false,
damping: 0,
rotateSensitivity: 2, //旋转操作的灵敏度
rotateMouseButton: "left", //旋转操作使用的鼠标按键
zoomSensitivity: 2, //缩放操作的灵敏度
panSensitivity: 2, //平移操作的灵敏度
panMouseButton: "right", //平移操作使用的鼠标按键
distance: 500, //默认视角距离主体的距离
center: [0, 0, 0],
animation: true,
animationDurationUpdate: 1000,
animationEasingUpdate: "cubicInOut",
},
},
{
type: "scatter3D",
coordinateSystem: "geo3D",
zlevel: 3,
// symbol:'path:// ',
// symbol: 'path://m232.99844,160.209511l15.863519,0l0,-14.211071l16.27296,0l0,14.211071l15.863521,0l0,14.577861l-15.863521,0l0,14.211069l-16.27296,0l0,-14.211069l-15.863519,0l0,-14.577861z',
// symbol: "circle",
symbolSize: 16,
label: {
normal: {
show: true,
position: "right",
formatter: "{b}",
textStyle: {
color: "#fff",
fontSize: 14,
backgroundColor: "transparent", // 字体背景色
},
},
},
data: [],
itemStyle: {
//坐标点颜色
color: "#67AE94",
shadowBlur: 20,
shadowColor: "#fff",
},
emphasis: {
itemStyle: {
//坐标点颜色
color: "#1ca1d2",
},
},
},
// {
// type: "scatter",
// coordinateSystem: "geo3d",
// zlevel: 5,
// // symbol:'path:// ',
// // symbol: 'path://m232.99844,160.209511l15.863519,0l0,-14.211071l16.27296,0l0,14.211071l15.863521,0l0,14.577861l-15.863521,0l0,14.211069l-16.27296,0l0,-14.211069l-15.863519,0l0,-14.577861z',
// // symbol: "circle",
// symbolSize: 16,
// rippleEffect: {
// scale: 5,
// brushType: "stroke",
// },
// label: {
// normal: {
// show: true,
// position: "right",
// formatter: "{b}",
// textStyle: {
// color: "#fff",
// fontSize: 14,
// backgroundColor: "transparent", // 字体背景色
// },
// },
// },
// data: [],
// },
// 线 和 点
{
type: "lines3D",
coordinateSystem: "geo3D",
zlevel: 1, //设置这个才会有轨迹线的小尾巴
polyline: false,
effect: {
show: true,
period: 10,
trailLength: 0.1,
trailColor: "#17eafe",
color: "#fff", //流动点颜色
symbol: "amarkLinesow",
symbolSize: 6,
},
lineStyle: {
normal: {
color: "#fff", //线条颜色
width: 1,
curveness: 0.5,
shadowColor: "#fff",
},
},
blendMode: "lighter",
data: [],
},
],
};
// 4. myChart.setOption
this.myChart.setOption(option);
// listen on click or hover event
this.myChart.on("click", async (arg) => {
console.log(arg);
const countyInfo = getCountyMapInfo(arg.name);
console.log(countyInfo);
if (countyInfo.key) {
if (!this.mapData[countyInfo.key]) {
const { data: ret } = await axios.get(
`//${location.host}${countyInfo.path}`
);
this.mapData[countyInfo.key] = ret;
this.$echarts.registerMap(countyInfo.key, ret);
}
this.$.getJSON("http://127.0.0.1:8000/api/map/county", (data) => {
console.log(typeof data, data instanceof Object);
this.mapData[countyInfo.key] = data;
this.$echarts.registerMap(countyInfo.key, data);
});
this.showBack = true;
const changeOption = {
geo: {
map: countyInfo.key,
},
};
this.myChart.setOption(changeOption);
}
});
this.myChart.on("mouseover", async (data) => {
console.log(data);
});
},
onScreenResize() {
this.fontSize = (this.$refs.echarts_map.offsetWidth / 100) * 3.6;
const adapterOption = {
title: {
textStyle: {
fontSize: this.fontSize,
},
},
// legend: {
// itemWidth: this.fontSize / 2,
// itemHeight: this.fontSize / 2,
// textStyle: {
// fontSize: this.fontSize / 2,
// },
// },
};
this.myChart.setOption(adapterOption);
this.myChart.resize();
},
handleSelect(key, keyPath) {
console.log(key, keyPath);
this.showScene();
},
showScene() {
console.log(this.tooltipVisible.scene);
this.tooltipVisible.scene = !this.tooltipVisible.scene;
},
showTourist() {},
revertMap() {
this.showBack = false;
const revertOption = {
geo: {
map: "wulingshan",
},
};
this.myChart.setOption(revertOption);
// this.updateChart();
},
},
};
</script>
<style scoped lang="scss">
@import "./index.scss";
</style>
-
https://blog.csdn.net/hadry123/article/details/102456263 ↩︎

DAMO开发者矩阵,由阿里巴巴达摩院和中国互联网协会联合发起,致力于探讨最前沿的技术趋势与应用成果,搭建高质量的交流与分享平台,推动技术创新与产业应用链接,围绕“人工智能与新型计算”构建开放共享的开发者生态。
更多推荐
 0
0 0
0- 0


 已为社区贡献1条内容

所有评论(0)