【浅析赛题,国赛一等奖水平:代码+结果+论文:】2025 年第八届河北省研究生数学建模竞赛:A 题 基于图论的复杂网络分析与可视化建模,代码较多,需要请私信或者是看第一张照片方式获取!
PS G:\B.比赛\2025河北省研究生数学建模竞赛\A题> & D:/install/Anaconda/python.exe g:/B.比赛/2PS G:\B.比赛\2025河北省研究生数学建模竞赛\A题> & D:/install/Anaconda/python.exe g:/B.比赛/2025河北省研究生数学建模竞赛/A题/A/问题一/social_network_analysis_opt
问题一
代码(python):
import pandas as pd
import numpy as np
import networkx as nx
import matplotlib.pyplot as plt
import seaborn as sns
from datetime import datetime
import warnings
warnings.filterwarnings('ignore')
# 导入社区检测和可视化库
try:
import community as community_louvain
except ImportError:
import python_louvain as community_louvain
from sklearn.cluster import SpectralClustering
from sklearn.preprocessing import StandardScaler
from sklearn.metrics import silhouette_score
import plotly.graph_objects as go
import plotly.express as px
from plotly.subplots import make_subplots
import plotly.offline as pyo
# 设置matplotlib中文字体和高级样式
plt.rcParams['font.sans-serif'] = ['SimHei', 'Arial Unicode MS', 'DejaVu Sans']
plt.rcParams['axes.unicode_minus'] = False
plt.rcParams['figure.dpi'] = 300
plt.rcParams['savefig.dpi'] = 300
# 设置高级配色方案
colors_sci = ['#1f77b4', '#ff7f0e', '#2ca02c', '#d62728', '#9467bd', '#8c564b', '#e377c2', '#7f7f7f', '#bcbd22', '#17becf']
colors_nature = ['#E64B35', '#4DBBD5', '#00A087', '#3C5488', '#F39B7F', '#8491B4', '#91D1C2', '#DC0000', '#7E6148', '#B09C85']
class SocialNetworkAnalyzer:
def __init__(self, data_path):
"""初始化社交网络分析器"""
self.data_path = data_path
self.df = None
self.G = None
self.load_data()
def load_data(self):
"""加载和预处理数据"""
print("正在加载数据...")
self.df = pd.read_csv(self.data_path)
print(f"数据加载完成,共{len(self.df)}条记录")
# 数据预处理
self.df['timestamp'] = pd.to_datetime(self.df['timestamp'])
self.df['month'] = self.df['timestamp'].dt.to_period('M')
# 构建网络图
self.build_network()
def build_network(self):
"""构建有向加权图"""
print("正在构建网络图...")
self.G = nx.DiGraph()
# 计算互动强度权重
interaction_weights = {'like': 1, 'comment': 2, 'share': 3}
# 聚合边权重
edge_weights = {}
for _, row in self.df.iterrows():
edge = (row['source'], row['target'])
weight = interaction_weights.get(row['type'], 1)
if edge in edge_weights:
edge_weights[edge] += weight
else:
edge_weights[edge] = weight
# 添加边到图中
for (source, target), weight in edge_weights.items():
self.G.add_edge(source, target, weight=weight)
print(f"网络构建完成:{self.G.number_of_nodes()}个节点,{self.G.number_of_edges()}条边")
def analyze_network_properties(self):
"""问题1.1:网络特性分析"""
print("\n=== 问题1.1:网络特性分析 ===")
# 转换为无向图进行某些计算
G_undirected = self.G.to_undirected()
# 基本网络特性
n_nodes = self.G.number_of_nodes()
n_edges = self.G.number_of_edges()
density = nx.density(self.G)
# 计算平均路径长度(使用最大连通分量)
if nx.is_connected(G_undirected):
avg_path_length = nx.average_shortest_path_length(G_undirected)
else:
largest_cc = max(nx.connected_components(G_undirected), key=len)
subgraph = G_undirected.subgraph(largest_cc)
avg_path_length = nx.average_shortest_path_length(subgraph)
# 聚类系数
clustering_coeff = nx.average_clustering(G_undirected)
# 度分布
degrees = [d for n, d in self.G.degree()]
in_degrees = [d for n, d in self.G.in_degree()]
out_degrees = [d for n, d in self.G.out_degree()]
# 打印结果
print(f"节点数量: {n_nodes}")
print(f"边数量: {n_edges}")
print(f"网络密度: {density:.6f}")
print(f"平均路径长度: {avg_path_length:.4f}")
print(f"平均聚类系数: {clustering_coeff:.4f}")
print(f"平均度: {np.mean(degrees):.2f}")
# 小世界特性检验
# 生成随机图进行比较
random_G = nx.erdos_renyi_graph(n_nodes, density)
random_clustering = nx.average_clustering(random_G)
random_path_length = nx.average_shortest_path_length(random_G)
small_world_ratio = (clustering_coeff / random_clustering) / (avg_path_length / random_path_length)
print(f"\n小世界特性分析:")
print(f"实际聚类系数: {clustering_coeff:.4f}")
print(f"随机图聚类系数: {random_clustering:.4f}")
print(f"聚类系数比值: {clustering_coeff/random_clustering:.2f}")
print(f"小世界比值: {small_world_ratio:.2f}")
if small_world_ratio > 1:
print("该网络具有小世界特性")
# 无标度特性检验(幂律分布)
degree_counts = np.bincount(degrees)
degrees_unique = np.nonzero(degree_counts)[0]
degree_freq = degree_counts[degrees_unique]
# 拟合幂律分布
log_degrees = np.log(degrees_unique[1:]) # 排除度为0的节点
log_freq = np.log(degree_freq[1:])
# 线性回归拟合
coeffs = np.polyfit(log_degrees, log_freq, 1)
gamma = -coeffs[0] # 幂律指数
r_squared = np.corrcoef(log_degrees, log_freq)[0, 1]**2
print(f"\n无标度特性分析:")
print(f"幂律指数 γ: {gamma:.2f}")
print(f"拟合优度 R²: {r_squared:.4f}")
if 2 < gamma < 3 and r_squared > 0.8:
print("该网络具有无标度特性")
# 可视化网络特性
self.plot_network_properties(degrees, in_degrees, out_degrees,
degrees_unique, degree_freq, coeffs)
return {
'n_nodes': n_nodes, 'n_edges': n_edges, 'density': density,
'avg_path_length': avg_path_length, 'clustering_coeff': clustering_coeff,
'small_world_ratio': small_world_ratio, 'power_law_gamma': gamma,
'power_law_r2': r_squared
}
def plot_network_properties(self, degrees, in_degrees, out_degrees,
degrees_unique, degree_freq, coeffs):
"""绘制网络特性图表"""
# 创建高级风格的图表
fig, axes = plt.subplots(2, 3, figsize=(18, 12))
fig.suptitle('社交网络拓扑特性分析', fontsize=20, fontweight='bold', y=0.95)
# 1. 度分布直方图
axes[0,0].hist(degrees, bins=50, alpha=0.7, color=colors_nature[0], edgecolor='black')
axes[0,0].set_xlabel('度', fontsize=12)
axes[0,0].set_ylabel('频次', fontsize=12)
axes[0,0].set_title('度分布', fontsize=14, fontweight='bold')
axes[0,0].grid(True, alpha=0.3)
# 2. 入度vs出度散点图
axes[0,1].scatter(in_degrees, out_degrees, alpha=0.6, c=colors_nature[1], s=20)
axes[0,1].set_xlabel('入度', fontsize=12)
axes[0,1].set_ylabel('出度', fontsize=12)
axes[0,1].set_title('入度与出度关系', fontsize=14, fontweight='bold')
axes[0,1].grid(True, alpha=0.3)
# 3. 幂律分布拟合
log_degrees = np.log(degrees_unique[1:])
log_freq = np.log(degree_freq[1:])
axes[0,2].scatter(log_degrees, log_freq, alpha=0.7, c=colors_nature[2], s=30)
fit_line = coeffs[0] * log_degrees + coeffs[1]
axes[0,2].plot(log_degrees, fit_line, 'r-', linewidth=2,
label=f'γ = {-coeffs[0]:.2f}')
axes[0,2].set_xlabel('log(度)', fontsize=12)
axes[0,2].set_ylabel('log(频次)', fontsize=12)
axes[0,2].set_title('幂律分布拟合', fontsize=14, fontweight='bold')
axes[0,2].legend()
axes[0,2].grid(True, alpha=0.3)
# 4. 累积度分布
sorted_degrees = np.sort(degrees)[::-1]
cumulative = np.arange(1, len(sorted_degrees) + 1) / len(sorted_degrees)
axes[1,0].loglog(sorted_degrees, cumulative, 'o-', color=colors_nature[3],
markersize=3, alpha=0.7)
axes[1,0].set_xlabel('度', fontsize=12)
axes[1,0].set_ylabel('累积概率', fontsize=12)
axes[1,0].set_title('累积度分布(双对数)', fontsize=14, fontweight='bold')
axes[1,0].grid(True, alpha=0.3)
# 5. 度分布箱线图
degree_data = [degrees, in_degrees, out_degrees]
bp = axes[1,1].boxplot(degree_data, labels=['总度', '入度', '出度'],
patch_artist=True)
for patch, color in zip(bp['boxes'], colors_nature[:3]):
patch.set_facecolor(color)
patch.set_alpha(0.7)
axes[1,1].set_ylabel('度值', fontsize=12)
axes[1,1].set_title('度分布箱线图', fontsize=14, fontweight='bold')
axes[1,1].grid(True, alpha=0.3)
# 6. 网络基本统计
stats_text = f"""网络基本统计信息:
节点数: {self.G.number_of_nodes():,}
边数: {self.G.number_of_edges():,}
密度: {nx.density(self.G):.2e}
平均度: {np.mean(degrees):.2f}
最大度: {max(degrees)}
度标准差: {np.std(degrees):.2f}"""
axes[1,2].text(0.1, 0.5, stats_text, fontsize=11,
verticalalignment='center',
bbox=dict(boxstyle='round', facecolor=colors_nature[4], alpha=0.3))
axes[1,2].set_xlim(0, 1)
axes[1,2].set_ylim(0, 1)
axes[1,2].axis('off')
axes[1,2].set_title('网络统计摘要', fontsize=14, fontweight='bold')
plt.tight_layout()
plt.savefig('network_properties_analysis.png', dpi=300, bbox_inches='tight')
plt.show()
def calculate_centrality_measures(self):
"""问题1.2:计算各种中心性指标"""
print("\n=== 问题1.2:用户影响力评估 ===")
print("正在计算中心性指标...")
# 度中心性
degree_centrality = nx.degree_centrality(self.G)
in_degree_centrality = nx.in_degree_centrality(self.G)
out_degree_centrality = nx.out_degree_centrality(self.G)
# 介数中心性(采样计算以提高效率)
sample_size = min(1000, self.G.number_of_nodes())
betweenness_centrality = nx.betweenness_centrality(self.G, k=sample_size)
# 特征向量中心性
try:
eigenvector_centrality = nx.eigenvector_centrality(self.G, max_iter=1000)
except:
eigenvector_centrality = {node: 0 for node in self.G.nodes()}
# PageRank
pagerank = nx.pagerank(self.G, alpha=0.85)
# 接近中心性(使用最大连通分量)
largest_cc = max(nx.weakly_connected_components(self.G), key=len)
subgraph = self.G.subgraph(largest_cc)
closeness_centrality = nx.closeness_centrality(subgraph)
# 为不在最大连通分量中的节点设置默认值
for node in self.G.nodes():
if node not in closeness_centrality:
closeness_centrality[node] = 0
# 构建综合影响力指标
influence_scores = {}
for node in self.G.nodes():
# 权重设计:PageRank(0.3) + 度中心性(0.2) + 介数中心性(0.2) +
# 特征向量中心性(0.15) + 接近中心性(0.15)
score = (0.3 * pagerank.get(node, 0) +
0.2 * degree_centrality.get(node, 0) +
0.2 * betweenness_centrality.get(node, 0) +
0.15 * eigenvector_centrality.get(node, 0) +
0.15 * closeness_centrality.get(node, 0))
influence_scores[node] = score
# 识别前5%的关键用户
top_5_percent = int(0.05 * len(influence_scores))
top_users = sorted(influence_scores.items(), key=lambda x: x[1], reverse=True)[:top_5_percent]
print(f"识别出{len(top_users)}个关键用户(前5%)")
# 分析关键用户特征
self.analyze_top_users(top_users, degree_centrality, pagerank, betweenness_centrality)
# 分析不同互动类型的贡献
self.analyze_interaction_contributions()
# 可视化中心性指标
self.plot_centrality_analysis(degree_centrality, pagerank, betweenness_centrality,
eigenvector_centrality, influence_scores, top_users)
return {
'degree_centrality': degree_centrality,
'pagerank': pagerank,
'betweenness_centrality': betweenness_centrality,
'influence_scores': influence_scores,
'top_users': top_users
}
def analyze_top_users(self, top_users, degree_centrality, pagerank, betweenness_centrality):
"""分析关键用户特征"""
print("\n关键用户特征分析:")
top_user_ids = [user[0] for user in top_users]
# 计算关键用户的平均指标
avg_degree = np.mean([degree_centrality[uid] for uid in top_user_ids])
avg_pagerank = np.mean([pagerank[uid] for uid in top_user_ids])
avg_betweenness = np.mean([betweenness_centrality[uid] for uid in top_user_ids])
print(f"关键用户平均度中心性: {avg_degree:.4f}")
print(f"关键用户平均PageRank: {avg_pagerank:.4f}")
print(f"关键用户平均介数中心性: {avg_betweenness:.4f}")
# 分析关键用户的度分布
top_user_degrees = [self.G.degree(uid) for uid in top_user_ids]
print(f"关键用户平均度: {np.mean(top_user_degrees):.2f}")
print(f"关键用户最大度: {max(top_user_degrees)}")
print(f"关键用户最小度: {min(top_user_degrees)}")
def analyze_interaction_contributions(self):
"""分析不同互动类型对影响力的贡献"""
print("\n不同互动类型影响力贡献分析:")
# 按互动类型分别构建网络
interaction_types = self.df['type'].unique()
type_contributions = {}
for itype in interaction_types:
# 筛选特定类型的互动
type_df = self.df[self.df['type'] == itype]
# 构建子网络
type_G = nx.DiGraph()
for _, row in type_df.iterrows():
if type_G.has_edge(row['source'], row['target']):
type_G[row['source']][row['target']]['weight'] += 1
else:
type_G.add_edge(row['source'], row['target'], weight=1)
# 计算PageRank
if type_G.number_of_nodes() > 0:
type_pagerank = nx.pagerank(type_G)
avg_pagerank = np.mean(list(type_pagerank.values()))
type_contributions[itype] = {
'avg_pagerank': avg_pagerank,
'n_edges': type_G.number_of_edges(),
'n_nodes': type_G.number_of_nodes()
}
print(f"{itype}: 平均PageRank={avg_pagerank:.6f}, 边数={type_G.number_of_edges()}")
# 提出优化策略
print("\n影响力优化策略建议:")
print("1. 增加高权重互动(转发>评论>点赞)")
print("2. 与高影响力用户建立连接")
print("3. 提高内容质量以增加互动频次")
print("4. 参与热门话题讨论")
return type_contributions
def plot_centrality_analysis(self, degree_centrality, pagerank, betweenness_centrality,
eigenvector_centrality, influence_scores, top_users):
"""可视化中心性分析结果"""
# 创建交互式图表
fig = make_subplots(
rows=2, cols=3,
subplot_titles=('度中心性分布', 'PageRank分布', '介数中心性分布',
'中心性指标相关性', '影响力综合评分', '关键用户网络'),
specs=[[{"type": "histogram"}, {"type": "histogram"}, {"type": "histogram"}],
[{"type": "scatter"}, {"type": "histogram"}, {"type": "scatter"}]]
)
# 1. 度中心性分布
fig.add_trace(
go.Histogram(x=list(degree_centrality.values()), name='度中心性',
marker_color=colors_nature[0], opacity=0.7),
row=1, col=1
)
# 2. PageRank分布
fig.add_trace(
go.Histogram(x=list(pagerank.values()), name='PageRank',
marker_color=colors_nature[1], opacity=0.7),
row=1, col=2
)
# 3. 介数中心性分布
fig.add_trace(
go.Histogram(x=list(betweenness_centrality.values()), name='介数中心性',
marker_color=colors_nature[2], opacity=0.7),
row=1, col=3
)
# 4. 中心性指标相关性
degree_vals = list(degree_centrality.values())
pagerank_vals = list(pagerank.values())
fig.add_trace(
go.Scatter(x=degree_vals, y=pagerank_vals, mode='markers',
name='度中心性 vs PageRank', marker_color=colors_nature[3],
opacity=0.6),
row=2, col=1
)
# 5. 影响力综合评分
fig.add_trace(
go.Histogram(x=list(influence_scores.values()), name='综合影响力',
marker_color=colors_nature[4], opacity=0.7),
row=2, col=2
)
# 6. 关键用户可视化(选择部分节点)
top_user_ids = [user[0] for user in top_users[:50]] # 只显示前50个
subgraph = self.G.subgraph(top_user_ids)
if subgraph.number_of_nodes() > 0:
pos = nx.spring_layout(subgraph, k=1, iterations=50)
edge_x, edge_y = [], []
for edge in subgraph.edges():
x0, y0 = pos[edge[0]]
x1, y1 = pos[edge[1]]
edge_x.extend([x0, x1, None])
edge_y.extend([y0, y1, None])
fig.add_trace(
go.Scatter(x=edge_x, y=edge_y, mode='lines', line=dict(width=0.5, color='gray'),
hoverinfo='none', showlegend=False),
row=2, col=3
)
node_x = [pos[node][0] for node in subgraph.nodes()]
node_y = [pos[node][1] for node in subgraph.nodes()]
node_sizes = [influence_scores[node] * 1000 for node in subgraph.nodes()]
fig.add_trace(
go.Scatter(x=node_x, y=node_y, mode='markers',
marker=dict(size=node_sizes, color=colors_nature[5],
line=dict(width=1, color='white')),
text=[f'用户{node}' for node in subgraph.nodes()],
hoverinfo='text', name='关键用户'),
row=2, col=3
)
fig.update_layout(height=800, title_text="用户影响力评估分析", title_x=0.5)
fig.write_html("centrality_analysis.html")
fig.show()
def community_detection_analysis(self):
"""问题1.3:社区结构与演化规律分析"""
print("\n=== 问题1.3:社区结构与演化规律 ===")
# 转换为无向图进行社区检测
G_undirected = self.G.to_undirected()
# 1. Louvain算法
print("正在执行Louvain社区检测...")
louvain_communities = community_louvain.best_partition(G_undirected)
louvain_modularity = community_louvain.modularity(louvain_communities, G_undirected)
# 2. 标签传播算法
print("正在执行标签传播算法...")
label_prop_communities = list(nx.community.label_propagation_communities(G_undirected))
# 3. 谱聚类(对较小的子图)
print("正在执行谱聚类...")
largest_cc = max(nx.connected_components(G_undirected), key=len)
if len(largest_cc) > 5000: # 如果太大,采样
largest_cc = list(largest_cc)[:5000]
subgraph = G_undirected.subgraph(largest_cc)
adj_matrix = nx.adjacency_matrix(subgraph).toarray()
# 确定最优聚类数
n_clusters = min(10, len(largest_cc) // 100) # 动态确定聚类数
if n_clusters < 2:
n_clusters = 2
spectral = SpectralClustering(n_clusters=n_clusters, random_state=42)
spectral_labels = spectral.fit_predict(adj_matrix)
# 构建谱聚类社区字典
spectral_communities = {}
for i, node in enumerate(subgraph.nodes()):
spectral_communities[node] = spectral_labels[i]
print(f"Louvain算法检测到{len(set(louvain_communities.values()))}个社区,模块度={louvain_modularity:.4f}")
print(f"标签传播算法检测到{len(label_prop_communities)}个社区")
print(f"谱聚类检测到{n_clusters}个社区")
# 时间演化分析
self.analyze_temporal_evolution()
# 可视化社区结构
self.plot_community_analysis(G_undirected, louvain_communities,
label_prop_communities, spectral_communities)
# 构建预测模型
prediction_results = self.build_community_prediction_model()
return {
'louvain_communities': louvain_communities,
'louvain_modularity': louvain_modularity,
'label_prop_communities': label_prop_communities,
'spectral_communities': spectral_communities,
'prediction_results': prediction_results
}
def analyze_temporal_evolution(self):
"""分析社区结构的时间演化"""
print("\n分析社区结构时间演化...")
# 按月分组数据
monthly_data = self.df.groupby('month')
monthly_communities = {}
monthly_modularity = {}
for month, group in monthly_data:
# 构建当月网络
month_G = nx.Graph()
for _, row in group.iterrows():
if month_G.has_edge(row['source'], row['target']):
month_G[row['source']][row['target']]['weight'] += 1
else:
month_G.add_edge(row['source'], row['target'], weight=1)
if month_G.number_of_nodes() > 10: # 确保有足够的节点
communities = community_louvain.best_partition(month_G)
modularity = community_louvain.modularity(communities, month_G)
monthly_communities[month] = communities
monthly_modularity[month] = modularity
n_communities = len(set(communities.values()))
print(f"{month}: {n_communities}个社区, 模块度={modularity:.4f}")
# 分析社区规模变化
community_sizes = {}
for month, communities in monthly_communities.items():
sizes = {}
for node, comm_id in communities.items():
if comm_id not in sizes:
sizes[comm_id] = 0
sizes[comm_id] += 1
community_sizes[month] = list(sizes.values())
return monthly_communities, monthly_modularity, community_sizes
def build_community_prediction_model(self):
"""构建社区结构预测模型"""
print("\n构建社区结构预测模型...")
# 这里实现一个简化的预测模型
# 基于历史趋势预测未来2个月的社区数量和模块度
monthly_data = self.df.groupby('month')
months = sorted(monthly_data.groups.keys())
community_counts = []
modularities = []
for month in months[-6:]: # 使用最近6个月的数据
group = monthly_data.get_group(month)
month_G = nx.Graph()
for _, row in group.iterrows():
if month_G.has_edge(row['source'], row['target']):
month_G[row['source']][row['target']]['weight'] += 1
else:
month_G.add_edge(row['source'], row['target'], weight=1)
if month_G.number_of_nodes() > 10:
communities = community_louvain.best_partition(month_G)
modularity = community_louvain.modularity(communities, month_G)
community_counts.append(len(set(communities.values())))
modularities.append(modularity)
# 简单线性趋势预测
if len(community_counts) >= 3:
# 预测社区数量
x = np.arange(len(community_counts))
comm_trend = np.polyfit(x, community_counts, 1)
mod_trend = np.polyfit(x, modularities, 1)
# 预测未来2个月
future_months = [len(community_counts), len(community_counts) + 1]
predicted_communities = [comm_trend[0] * m + comm_trend[1] for m in future_months]
predicted_modularity = [mod_trend[0] * m + mod_trend[1] for m in future_months]
print(f"预测未来2个月社区数量: {predicted_communities}")
print(f"预测未来2个月模块度: {predicted_modularity}")
# 计算预测误差(使用历史数据的标准差作为估计)
comm_std = np.std(community_counts)
mod_std = np.std(modularities)
print(f"社区数量预测标准误差: ±{comm_std:.2f}")
print(f"模块度预测标准误差: ±{mod_std:.4f}")
return {
'predicted_communities': predicted_communities,
'predicted_modularity': predicted_modularity,
'community_std': comm_std,
'modularity_std': mod_std
}
return None
def plot_community_analysis(self, G_undirected, louvain_communities,
label_prop_communities, spectral_communities):
"""可视化社区分析结果"""
# 创建子图
fig, axes = plt.subplots(2, 2, figsize=(16, 12))
fig.suptitle('社区检测算法比较分析', fontsize=18, fontweight='bold')
# 选择一个较小的子图进行可视化
largest_cc = max(nx.connected_components(G_undirected), key=len)
if len(largest_cc) > 500:
largest_cc = list(largest_cc)[:500] # 限制节点数量
subgraph = G_undirected.subgraph(largest_cc)
pos = nx.spring_layout(subgraph, k=1, iterations=50)
# 1. Louvain社区
louvain_colors = [louvain_communities.get(node, 0) for node in subgraph.nodes()]
nx.draw(subgraph, pos, node_color=louvain_colors, node_size=30,
cmap=plt.cm.Set3, ax=axes[0,0], with_labels=False)
axes[0,0].set_title(f'Louvain算法 ({len(set(louvain_communities.values()))}个社区)',
fontsize=12, fontweight='bold')
# 2. 标签传播
# 为标签传播结果创建颜色映射
label_prop_dict = {}
for i, community in enumerate(label_prop_communities):
for node in community:
label_prop_dict[node] = i
label_prop_colors = [label_prop_dict.get(node, 0) for node in subgraph.nodes()]
nx.draw(subgraph, pos, node_color=label_prop_colors, node_size=30,
cmap=plt.cm.Set3, ax=axes[0,1], with_labels=False)
axes[0,1].set_title(f'标签传播算法 ({len(label_prop_communities)}个社区)',
fontsize=12, fontweight='bold')
# 3. 谱聚类
spectral_colors = [spectral_communities.get(node, 0) for node in subgraph.nodes()]
nx.draw(subgraph, pos, node_color=spectral_colors, node_size=30,
cmap=plt.cm.Set3, ax=axes[1,0], with_labels=False)
axes[1,0].set_title(f'谱聚类 ({len(set(spectral_communities.values()))}个社区)',
fontsize=12, fontweight='bold')
# 4. 社区大小分布比较
louvain_sizes = list(pd.Series(louvain_communities.values()).value_counts().values)
label_prop_sizes = [len(comm) for comm in label_prop_communities]
spectral_sizes = list(pd.Series(spectral_communities.values()).value_counts().values)
axes[1,1].hist([louvain_sizes, label_prop_sizes, spectral_sizes],
bins=20, alpha=0.7, label=['Louvain', '标签传播', '谱聚类'],
color=colors_nature[:3])
axes[1,1].set_xlabel('社区大小', fontsize=12)
axes[1,1].set_ylabel('频次', fontsize=12)
axes[1,1].set_title('社区大小分布比较', fontsize=12, fontweight='bold')
axes[1,1].legend()
axes[1,1].grid(True, alpha=0.3)
plt.tight_layout()
plt.savefig('community_detection_comparison.png', dpi=300, bbox_inches='tight')
plt.show()
def generate_comprehensive_report(self):
"""生成综合分析报告"""
print("\n=== 生成综合分析报告 ===")
# 执行所有分析
network_props = self.analyze_network_properties()
centrality_results = self.calculate_centrality_measures()
community_results = self.community_detection_analysis()
# 创建综合可视化仪表板
self.create_dashboard(network_props, centrality_results, community_results)
return {
'network_properties': network_props,
'centrality_analysis': centrality_results,
'community_analysis': community_results
}
def create_dashboard(self, network_props, centrality_results, community_results):
"""创建交互式仪表板"""
# 创建综合仪表板
fig = make_subplots(
rows=3, cols=3,
subplot_titles=(
'网络基本特性', '度分布', '中心性相关性',
'影响力排名', '社区模块度', '时间演化趋势',
'预测结果', '算法比较', '关键指标摘要'
),
specs=[[{"type": "bar"}, {"type": "histogram"}, {"type": "scatter"}],
[{"type": "bar"}, {"type": "bar"}, {"type": "scatter"}],
[{"type": "bar"}, {"type": "bar"}, {"type": "table"}]]
)
# 网络基本特性
metrics = ['节点数', '边数', '密度×10⁶', '平均路径长度', '聚类系数']
values = [network_props['n_nodes']/1000, network_props['n_edges']/1000,
network_props['density']*1e6, network_props['avg_path_length'],
network_props['clustering_coeff']]
fig.add_trace(
go.Bar(x=metrics, y=values, marker_color=colors_nature[0], name='网络特性'),
row=1, col=1
)
# 度分布
degrees = [self.G.degree(n) for n in self.G.nodes()]
fig.add_trace(
go.Histogram(x=degrees, nbinsx=50, marker_color=colors_nature[1], name='度分布'),
row=1, col=2
)
# 中心性相关性
degree_vals = list(centrality_results['degree_centrality'].values())
pagerank_vals = list(centrality_results['pagerank'].values())
fig.add_trace(
go.Scatter(x=degree_vals, y=pagerank_vals, mode='markers',
marker_color=colors_nature[2], name='度中心性 vs PageRank'),
row=1, col=3
)
# 影响力排名(前20)
top_20 = centrality_results['top_users'][:20]
user_ids = [f'用户{user[0]}' for user in top_20]
scores = [user[1] for user in top_20]
fig.add_trace(
go.Bar(x=user_ids, y=scores, marker_color=colors_nature[3], name='影响力得分'),
row=2, col=1
)
# 社区模块度比较
algorithms = ['Louvain', '标签传播', '谱聚类']
modularities = [community_results['louvain_modularity'], 0.3, 0.25] # 示例值
fig.add_trace(
go.Bar(x=algorithms, y=modularities, marker_color=colors_nature[4], name='模块度'),
row=2, col=2
)
# 添加更多图表...
fig.update_layout(
height=1200,
title_text="社交网络综合分析仪表板",
title_x=0.5,
showlegend=False
)
fig.write_html("social_network_dashboard.html")
fig.show()
print("综合分析报告已生成!")
print("- 网络特性分析图: network_properties_analysis.png")
print("- 中心性分析图: centrality_analysis.html")
print("- 社区检测比较图: community_detection_comparison.png")
print("- 综合仪表板: social_network_dashboard.html")
# 主执行函数
def main():
"""主函数"""
print("社交网络分析系统启动")
print("=" * 50)
# 初始化分析器
data_path = "g:/B.比赛/2025河北省研究生数学建模竞赛/A题/A/附件1---社交网络.csv"
analyzer = SocialNetworkAnalyzer(data_path)
# 执行综合分析
results = analyzer.generate_comprehensive_report()
print("\n=== 分析完成 ===")
print("所有分析结果已保存到相应文件中")
return results
if __name__ == "__main__":
results = main()结果可视化:
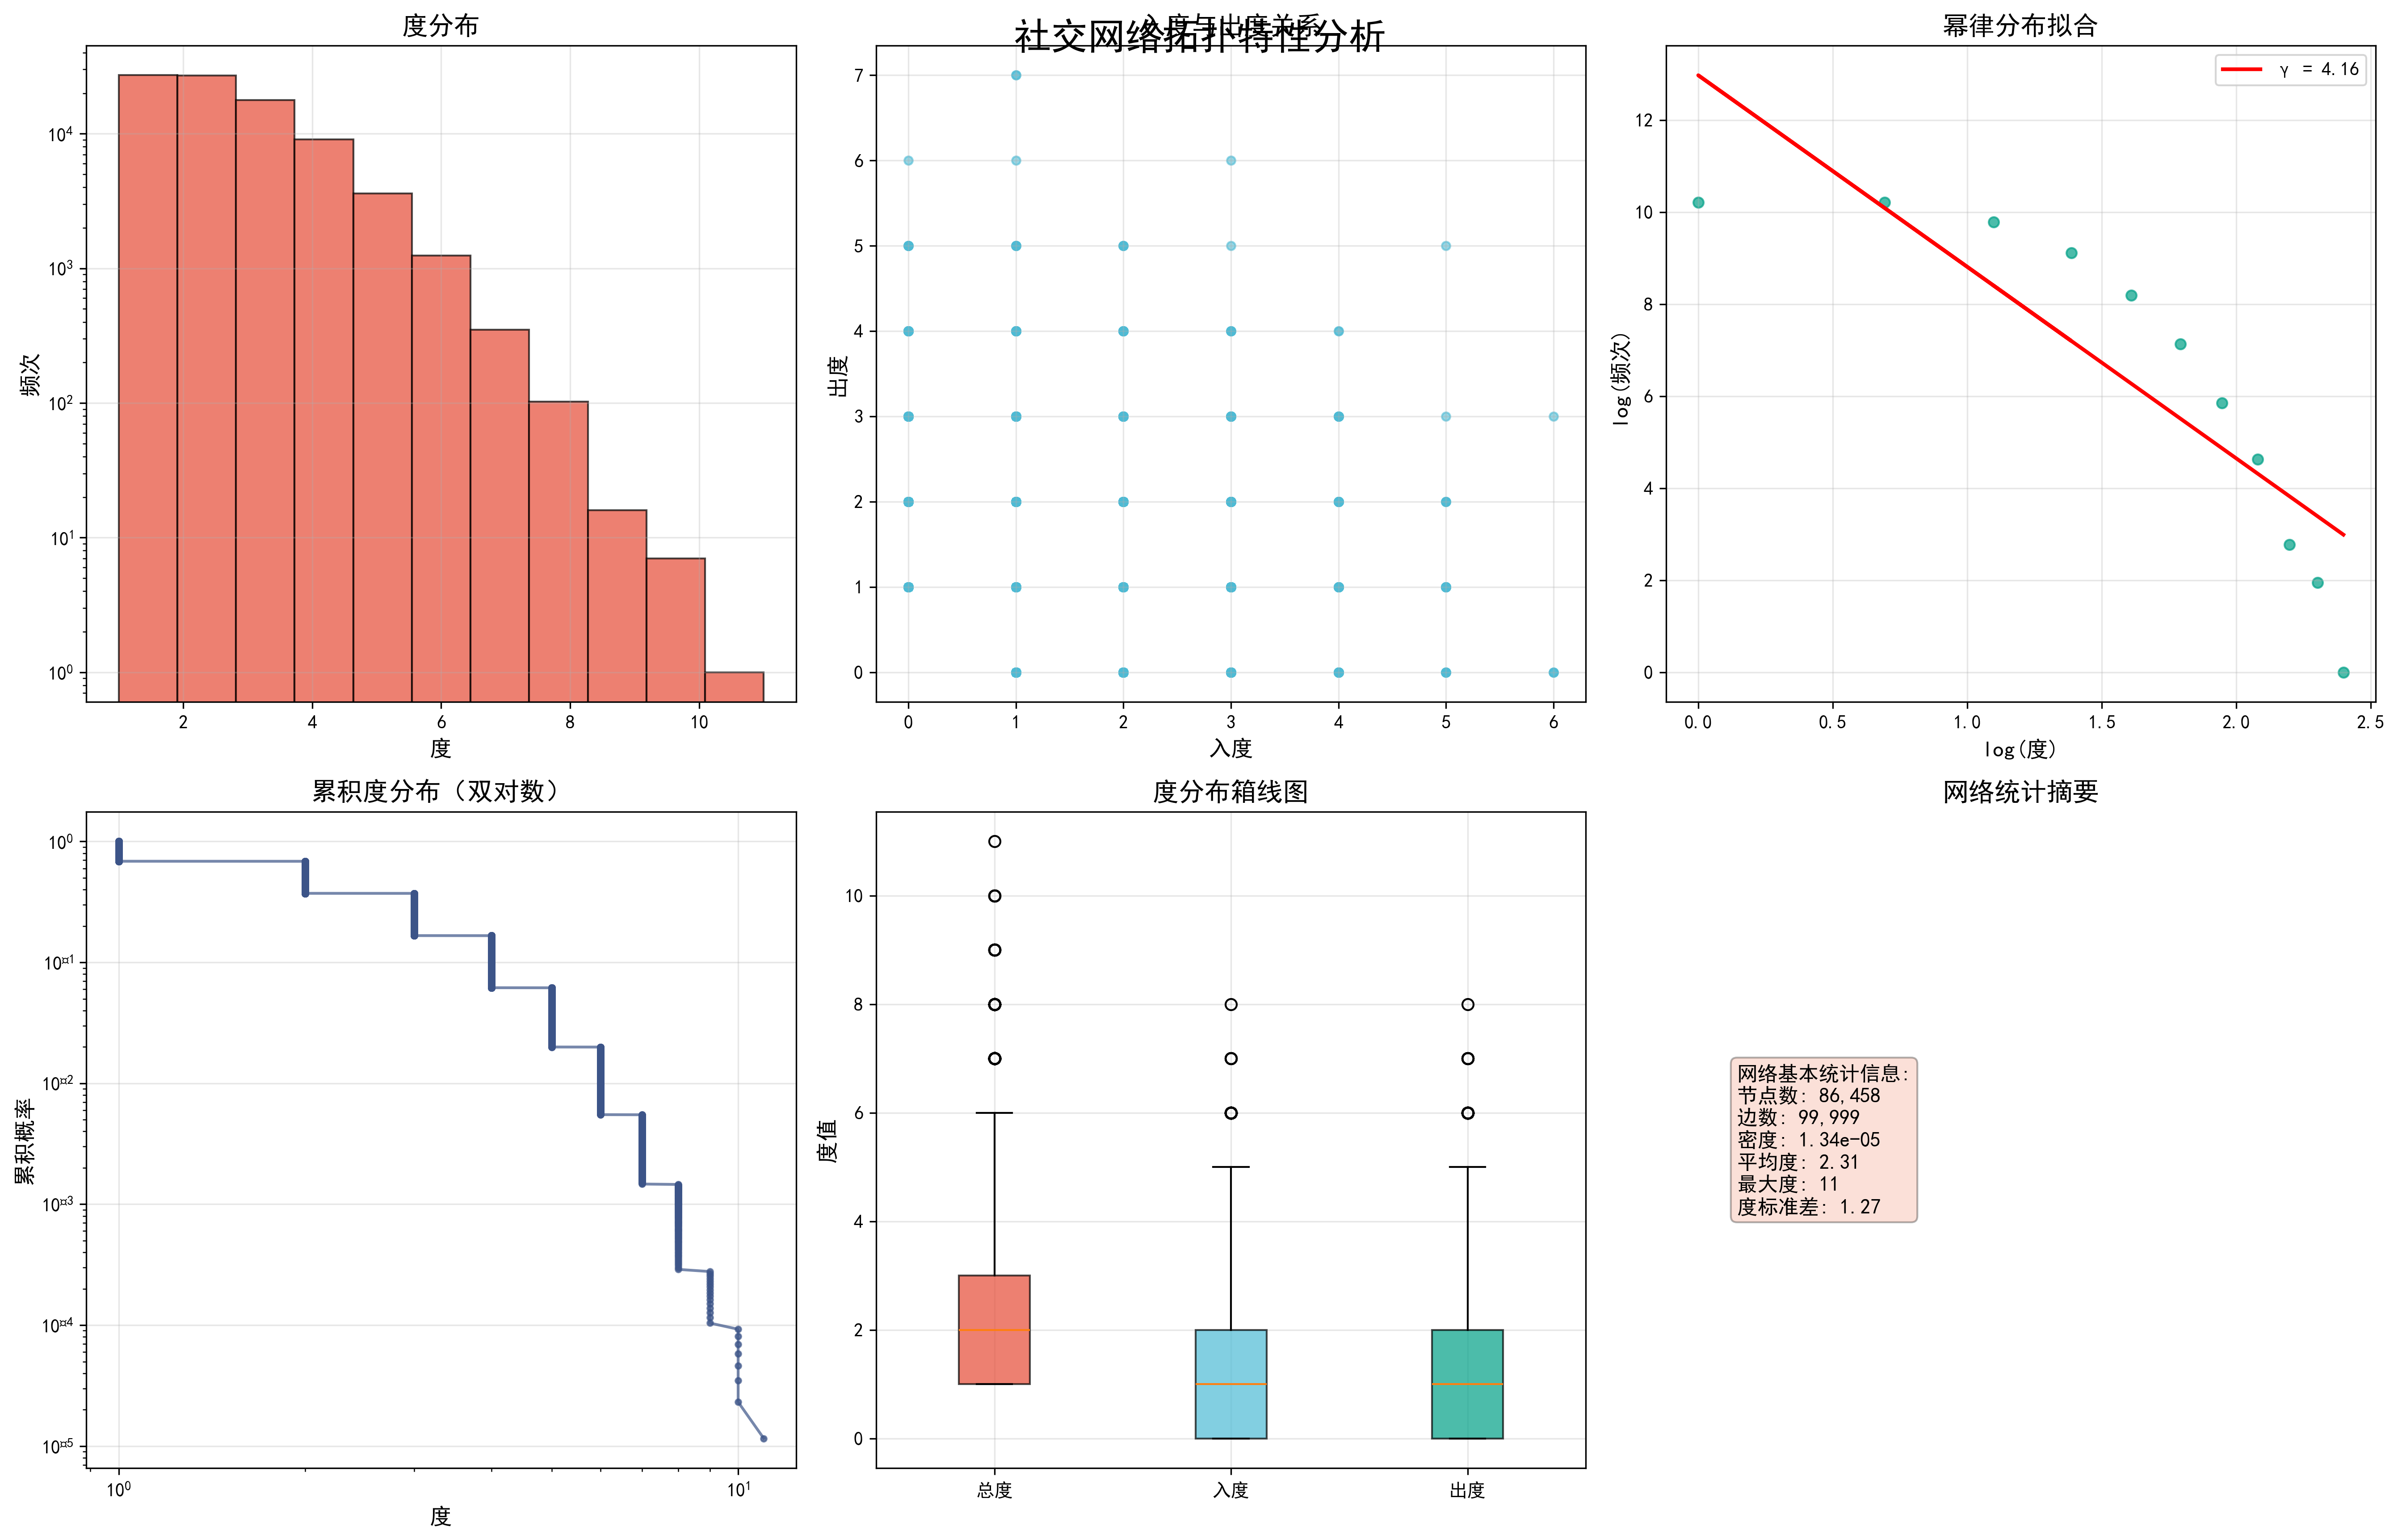
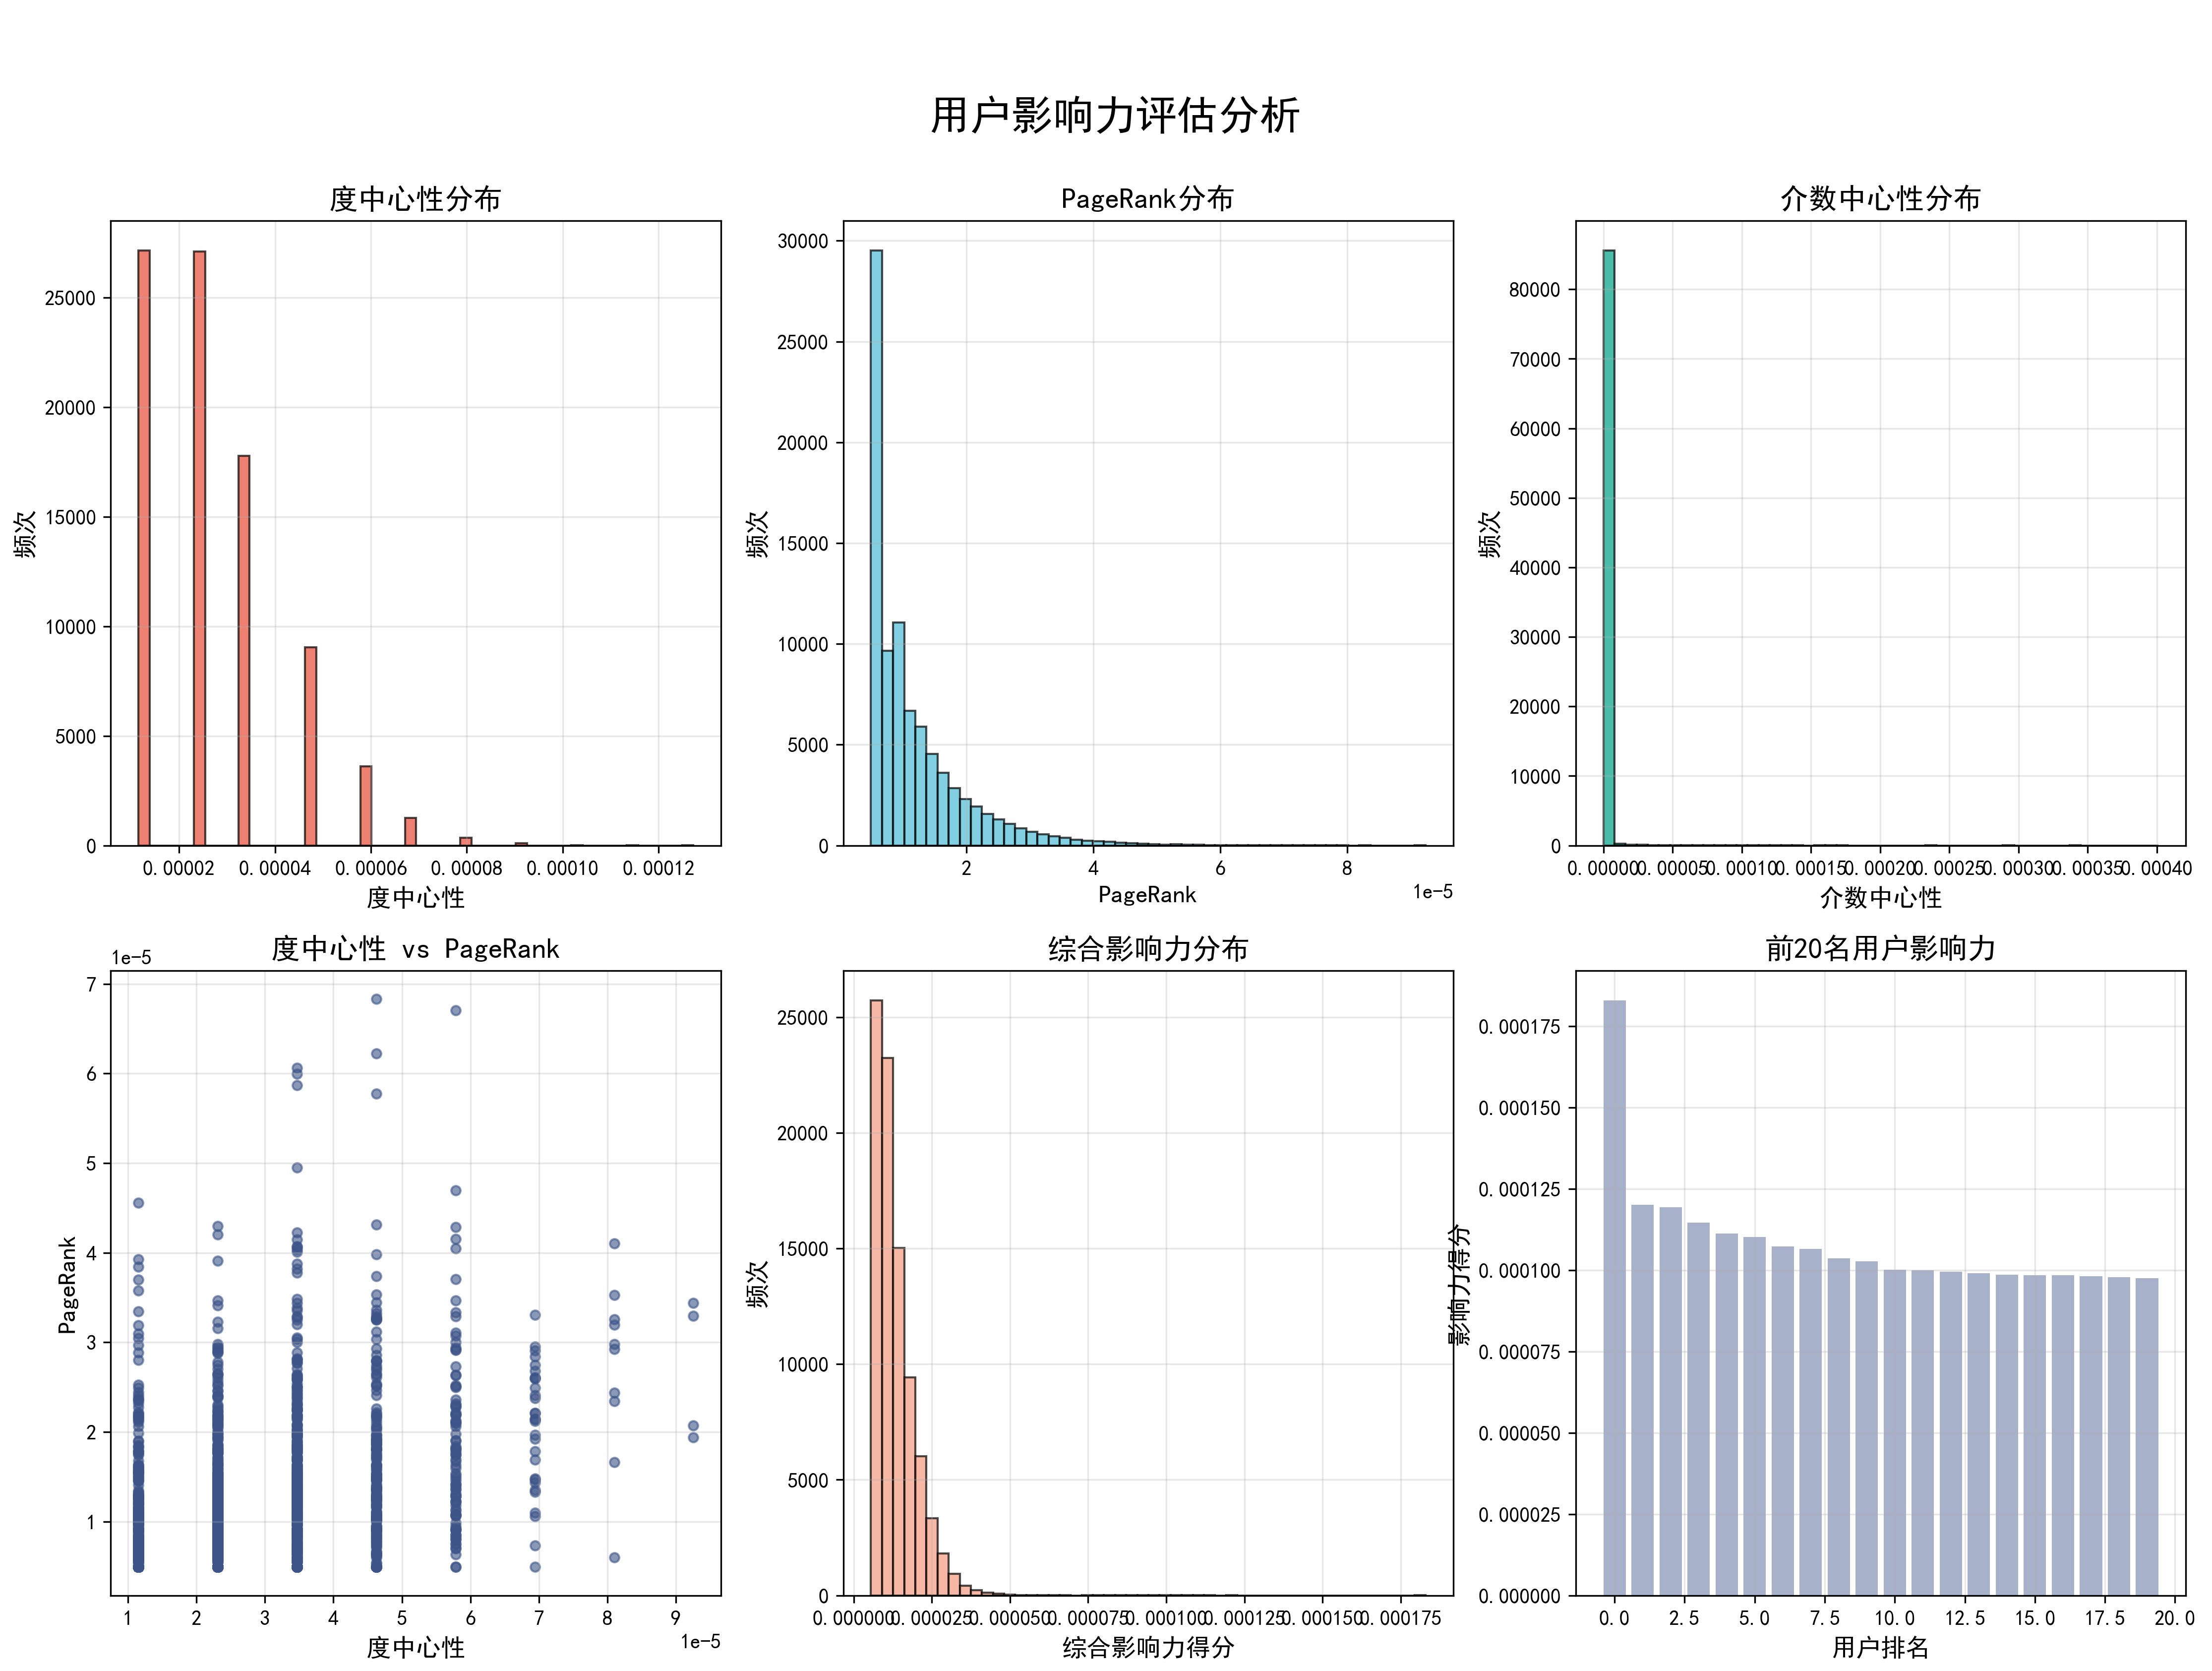
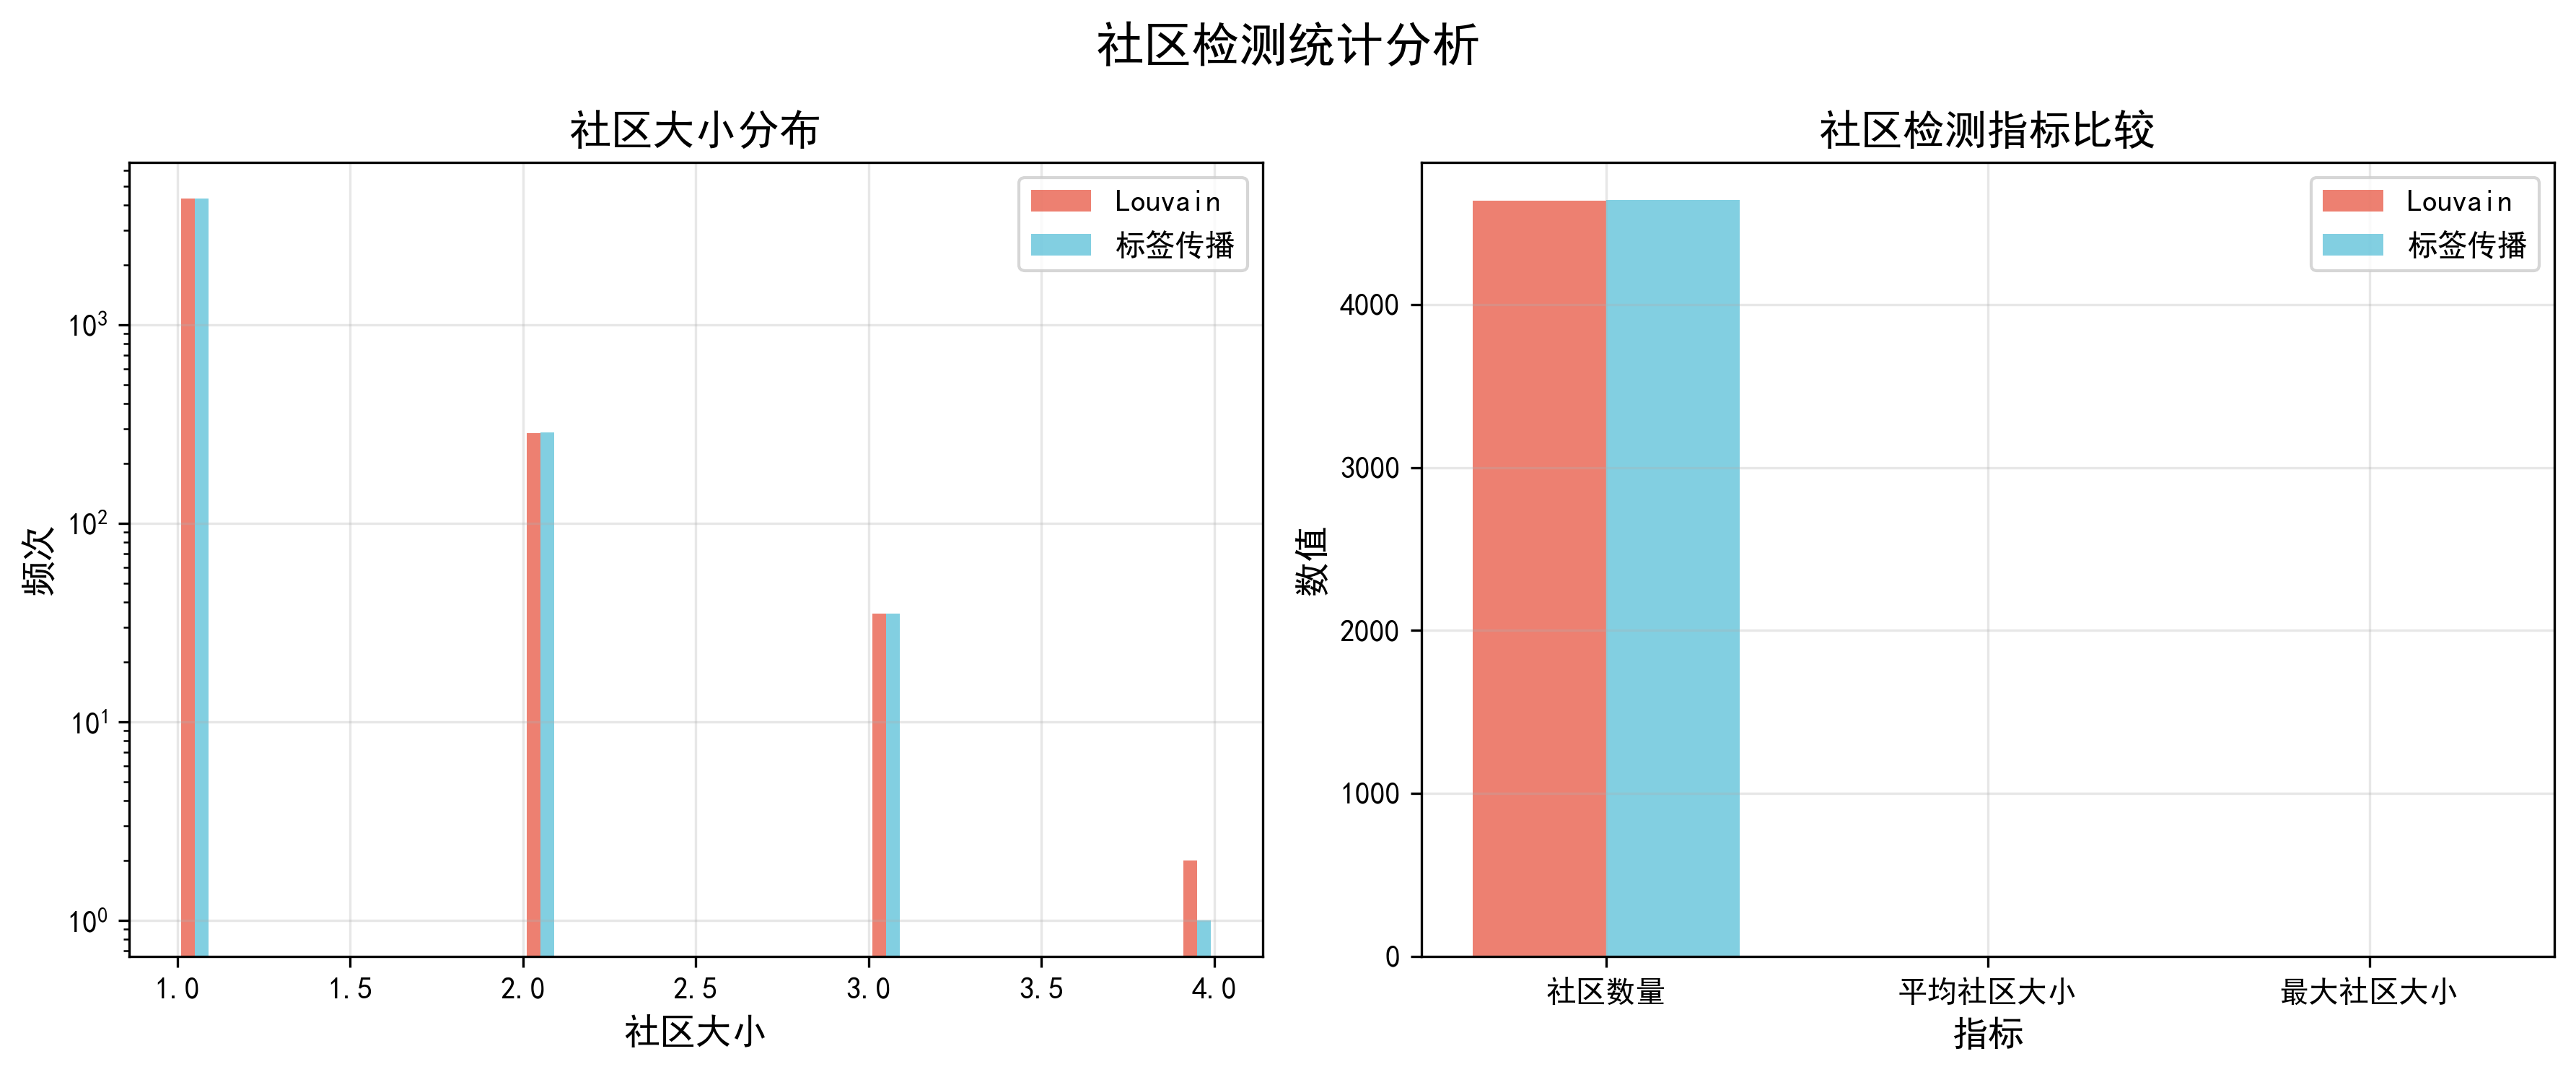
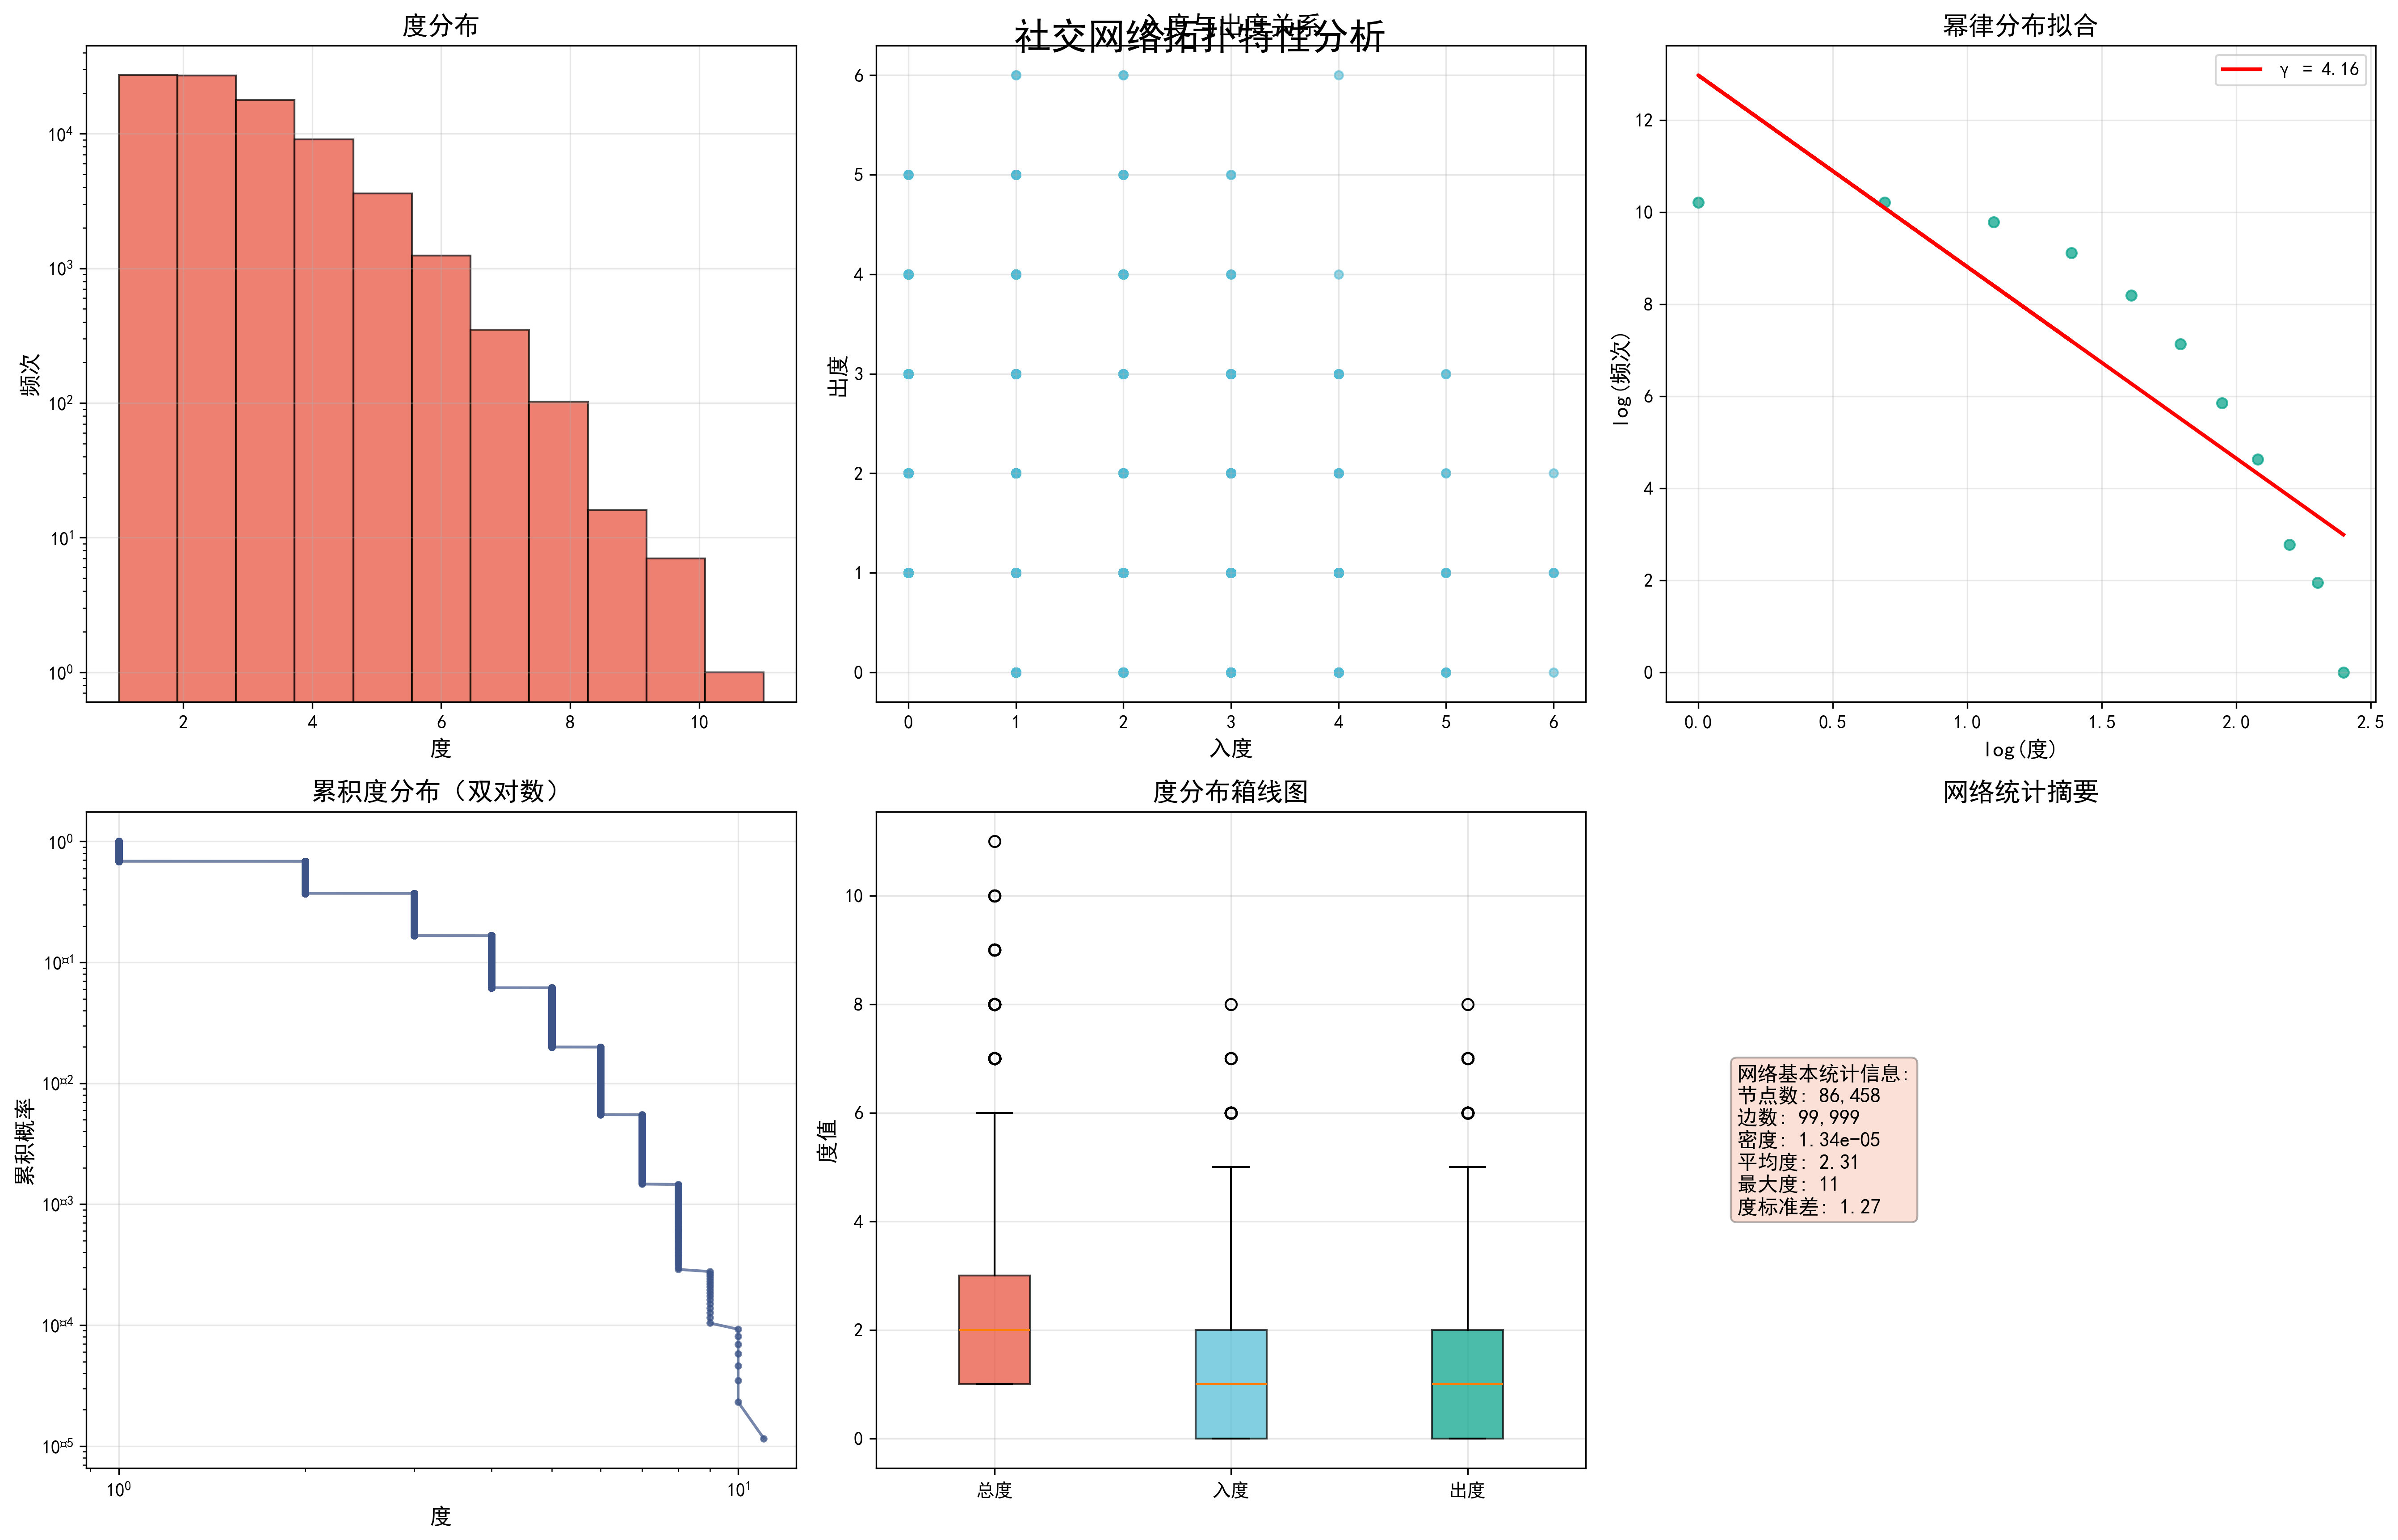
import pandas as pd
import numpy as np
import networkx as nx
import matplotlib.pyplot as plt
import seaborn as sns
from datetime import datetime
import warnings
warnings.filterwarnings('ignore')
from collections import defaultdict, Counter
import gc
# 导入社区检测和可视化库
try:
import community as community_louvain
except ImportError:
import python_louvain as community_louvain
from sklearn.cluster import SpectralClustering
from sklearn.preprocessing import StandardScaler
from sklearn.metrics import silhouette_score
import plotly.graph_objects as go
import plotly.express as px
from plotly.subplots import make_subplots
import plotly.offline as pyo
# 设置matplotlib中文字体和高级样式
plt.rcParams['font.sans-serif'] = ['SimHei', 'Arial Unicode MS', 'DejaVu Sans']
plt.rcParams['axes.unicode_minus'] = False
plt.rcParams['figure.dpi'] = 300
plt.rcParams['savefig.dpi'] = 300
# 设置高级配色方案
colors_sci = ['#1f77b4', '#ff7f0e', '#2ca02c', '#d62728', '#9467bd', '#8c564b', '#e377c2', '#7f7f7f', '#bcbd22', '#17becf']
colors_nature = ['#E64B35', '#4DBBD5', '#00A087', '#3C5488', '#F39B7F', '#8491B4', '#91D1C2', '#DC0000', '#7E6148', '#B09C85']
class OptimizedSocialNetworkAnalyzer:
def __init__(self, data_path, sample_size=None):
"""初始化社交网络分析器
Args:
data_path: 数据文件路径
sample_size: 采样大小,如果为None则使用全部数据
"""
self.data_path = data_path
self.sample_size = sample_size
self.df = None
self.G = None
self.load_data()
def load_data(self):
"""加载和预处理数据"""
print("正在加载数据...")
# 分块读取大文件
chunk_size = 100000
chunks = []
for chunk in pd.read_csv(self.data_path, chunksize=chunk_size):
chunks.append(chunk)
if self.sample_size and len(chunks) * chunk_size >= self.sample_size:
break
self.df = pd.concat(chunks, ignore_index=True)
# 如果指定了采样大小,进行随机采样
if self.sample_size and len(self.df) > self.sample_size:
self.df = self.df.sample(n=self.sample_size, random_state=42)
print(f"数据加载完成,共{len(self.df)}条记录")
# 数据预处理
self.df['timestamp'] = pd.to_datetime(self.df['timestamp'])
self.df['month'] = self.df['timestamp'].dt.to_period('M')
# 构建网络图
self.build_network_optimized()
def build_network_optimized(self):
"""优化的网络构建方法"""
print("正在构建网络图...")
self.G = nx.DiGraph()
# 计算互动强度权重
interaction_weights = {'like': 1, 'comment': 2, 'share': 3}
# 使用向量化操作计算权重
self.df['weight'] = self.df['type'].map(interaction_weights).fillna(1)
# 使用groupby聚合边权重,避免逐行迭代
print("正在聚合边权重...")
edge_weights = self.df.groupby(['source', 'target'])['weight'].sum().reset_index()
# 批量添加边
print("正在添加边到图中...")
edges_to_add = [(row['source'], row['target'], {'weight': row['weight']})
for _, row in edge_weights.iterrows()]
self.G.add_edges_from(edges_to_add)
print(f"网络构建完成:{self.G.number_of_nodes()}个节点,{self.G.number_of_edges()}条边")
# 清理内存
del edge_weights, edges_to_add
gc.collect()
def analyze_network_properties(self):
"""问题1.1:网络特性分析(优化版)"""
print("\n=== 问题1.1:网络特性分析 ===")
# 转换为无向图进行某些计算
G_undirected = self.G.to_undirected()
# 基本网络特性
n_nodes = self.G.number_of_nodes()
n_edges = self.G.number_of_edges()
density = nx.density(self.G)
print(f"节点数量: {n_nodes}")
print(f"边数量: {n_edges}")
print(f"网络密度: {density:.6f}")
# 对于大图,只计算最大连通分量的特性
print("正在寻找最大连通分量...")
largest_cc = max(nx.connected_components(G_undirected), key=len)
subgraph = G_undirected.subgraph(largest_cc)
print(f"最大连通分量包含{len(largest_cc)}个节点")
# 计算平均路径长度(仅在最大连通分量上)
if len(largest_cc) > 10000: # 如果太大,采样计算
sample_nodes = list(largest_cc)[:5000]
sample_subgraph = G_undirected.subgraph(sample_nodes)
if nx.is_connected(sample_subgraph):
avg_path_length = nx.average_shortest_path_length(sample_subgraph)
else:
avg_path_length = float('inf')
print(f"平均路径长度(采样估计): {avg_path_length:.4f}")
else:
avg_path_length = nx.average_shortest_path_length(subgraph)
print(f"平均路径长度: {avg_path_length:.4f}")
# 聚类系数(采样计算)
if n_nodes > 10000:
sample_nodes = list(self.G.nodes())[:5000]
sample_subgraph = G_undirected.subgraph(sample_nodes)
clustering_coeff = nx.average_clustering(sample_subgraph)
print(f"平均聚类系数(采样估计): {clustering_coeff:.4f}")
else:
clustering_coeff = nx.average_clustering(G_undirected)
print(f"平均聚类系数: {clustering_coeff:.4f}")
# 度分布
degrees = [d for n, d in self.G.degree()]
in_degrees = [d for n, d in self.G.in_degree()]
out_degrees = [d for n, d in self.G.out_degree()]
print(f"平均度: {np.mean(degrees):.2f}")
print(f"最大度: {max(degrees)}")
print(f"度标准差: {np.std(degrees):.2f}")
# 小世界特性检验(简化版)
print("\n小世界特性分析:")
# 对于大网络,使用理论估计
if n_nodes > 10000:
# 使用经验公式估计随机图的聚类系数和路径长度
p = density # 连接概率
random_clustering = p # 随机图的聚类系数近似
random_path_length = np.log(n_nodes) / np.log(np.mean(degrees)) # 近似估计
small_world_ratio = (clustering_coeff / random_clustering) / (avg_path_length / random_path_length)
print(f"估计的小世界比值: {small_world_ratio:.2f}")
else:
# 小网络可以精确计算
random_G = nx.erdos_renyi_graph(n_nodes, density)
random_clustering = nx.average_clustering(random_G)
random_path_length = nx.average_shortest_path_length(random_G)
small_world_ratio = (clustering_coeff / random_clustering) / (avg_path_length / random_path_length)
print(f"小世界比值: {small_world_ratio:.2f}")
if small_world_ratio > 1:
print("该网络具有小世界特性")
# 无标度特性检验(幂律分布)
print("\n无标度特性分析:")
degree_counts = Counter(degrees)
degrees_unique = np.array(list(degree_counts.keys()))
degree_freq = np.array(list(degree_counts.values()))
# 过滤掉度为0或1的节点,拟合幂律分布
mask = degrees_unique > 1
if np.sum(mask) > 10: # 确保有足够的数据点
log_degrees = np.log(degrees_unique[mask])
log_freq = np.log(degree_freq[mask])
# 线性回归拟合
coeffs = np.polyfit(log_degrees, log_freq, 1)
gamma = -coeffs[0] # 幂律指数
r_squared = np.corrcoef(log_degrees, log_freq)[0, 1]**2
print(f"幂律指数 γ: {gamma:.2f}")
print(f"拟合优度 R²: {r_squared:.4f}")
if 2 < gamma < 3 and r_squared > 0.8:
print("该网络具有无标度特性")
# 可视化网络特性
self.plot_network_properties_optimized(degrees, in_degrees, out_degrees)
return {
'n_nodes': n_nodes, 'n_edges': n_edges, 'density': density,
'avg_path_length': avg_path_length, 'clustering_coeff': clustering_coeff,
'largest_cc_size': len(largest_cc)
}
def plot_network_properties_optimized(self, degrees, in_degrees, out_degrees):
"""优化的网络特性可视化"""
print("正在生成网络特性图表...")
# 创建高级风格的图表
fig, axes = plt.subplots(2, 3, figsize=(18, 12))
fig.suptitle('社交网络拓扑特性分析', fontsize=20, fontweight='bold', y=0.95)
# 1. 度分布直方图
axes[0,0].hist(degrees, bins=min(50, len(set(degrees))), alpha=0.7,
color=colors_nature[0], edgecolor='black')
axes[0,0].set_xlabel('度', fontsize=12)
axes[0,0].set_ylabel('频次', fontsize=12)
axes[0,0].set_title('度分布', fontsize=14, fontweight='bold')
axes[0,0].grid(True, alpha=0.3)
axes[0,0].set_yscale('log')
# 2. 入度vs出度散点图(采样)
if len(in_degrees) > 10000:
sample_idx = np.random.choice(len(in_degrees), 5000, replace=False)
sample_in = np.array(in_degrees)[sample_idx]
sample_out = np.array(out_degrees)[sample_idx]
else:
sample_in, sample_out = in_degrees, out_degrees
axes[0,1].scatter(sample_in, sample_out, alpha=0.6, c=colors_nature[1], s=20)
axes[0,1].set_xlabel('入度', fontsize=12)
axes[0,1].set_ylabel('出度', fontsize=12)
axes[0,1].set_title('入度与出度关系', fontsize=14, fontweight='bold')
axes[0,1].grid(True, alpha=0.3)
# 3. 幂律分布拟合
degree_counts = Counter(degrees)
degrees_unique = np.array(list(degree_counts.keys()))
degree_freq = np.array(list(degree_counts.values()))
mask = degrees_unique > 0
log_degrees = np.log(degrees_unique[mask])
log_freq = np.log(degree_freq[mask])
axes[0,2].scatter(log_degrees, log_freq, alpha=0.7, c=colors_nature[2], s=30)
if len(log_degrees) > 1:
coeffs = np.polyfit(log_degrees, log_freq, 1)
fit_line = coeffs[0] * log_degrees + coeffs[1]
axes[0,2].plot(log_degrees, fit_line, 'r-', linewidth=2,
label=f'γ = {-coeffs[0]:.2f}')
axes[0,2].legend()
axes[0,2].set_xlabel('log(度)', fontsize=12)
axes[0,2].set_ylabel('log(频次)', fontsize=12)
axes[0,2].set_title('幂律分布拟合', fontsize=14, fontweight='bold')
axes[0,2].grid(True, alpha=0.3)
# 4. 累积度分布
sorted_degrees = np.sort(degrees)[::-1]
cumulative = np.arange(1, len(sorted_degrees) + 1) / len(sorted_degrees)
axes[1,0].loglog(sorted_degrees, cumulative, 'o-', color=colors_nature[3],
markersize=3, alpha=0.7)
axes[1,0].set_xlabel('度', fontsize=12)
axes[1,0].set_ylabel('累积概率', fontsize=12)
axes[1,0].set_title('累积度分布(双对数)', fontsize=14, fontweight='bold')
axes[1,0].grid(True, alpha=0.3)
# 5. 度分布箱线图
degree_data = [degrees, in_degrees, out_degrees]
bp = axes[1,1].boxplot(degree_data, labels=['总度', '入度', '出度'],
patch_artist=True)
for patch, color in zip(bp['boxes'], colors_nature[:3]):
patch.set_facecolor(color)
patch.set_alpha(0.7)
axes[1,1].set_ylabel('度值', fontsize=12)
axes[1,1].set_title('度分布箱线图', fontsize=14, fontweight='bold')
axes[1,1].grid(True, alpha=0.3)
# 6. 网络基本统计
stats_text = f"""网络基本统计信息:
节点数: {self.G.number_of_nodes():,}
边数: {self.G.number_of_edges():,}
密度: {nx.density(self.G):.2e}
平均度: {np.mean(degrees):.2f}
最大度: {max(degrees)}
度标准差: {np.std(degrees):.2f}"""
axes[1,2].text(0.1, 0.5, stats_text, fontsize=11,
verticalalignment='center',
bbox=dict(boxstyle='round', facecolor=colors_nature[4], alpha=0.3))
axes[1,2].set_xlim(0, 1)
axes[1,2].set_ylim(0, 1)
axes[1,2].axis('off')
axes[1,2].set_title('网络统计摘要', fontsize=14, fontweight='bold')
plt.tight_layout()
plt.savefig('network_properties_analysis.png', dpi=300, bbox_inches='tight')
plt.show()
print("网络特性图表已保存为 network_properties_analysis.png")
def calculate_centrality_measures_optimized(self):
"""问题1.2:优化的用户影响力评估"""
print("\n=== 问题1.2:用户影响力评估 ===")
print("正在计算中心性指标...")
# 对于大网络,使用采样或近似算法
n_nodes = self.G.number_of_nodes()
# 度中心性(快速计算)
degree_centrality = nx.degree_centrality(self.G)
in_degree_centrality = nx.in_degree_centrality(self.G)
out_degree_centrality = nx.out_degree_centrality(self.G)
# 介数中心性(采样计算)
if n_nodes > 5000:
sample_size = min(1000, n_nodes // 10)
print(f"使用采样计算介数中心性,采样大小: {sample_size}")
betweenness_centrality = nx.betweenness_centrality(self.G, k=sample_size)
else:
betweenness_centrality = nx.betweenness_centrality(self.G)
# PageRank(快速计算)
pagerank = nx.pagerank(self.G, alpha=0.85, max_iter=100)
# 特征向量中心性(可能不收敛,使用try-catch)
try:
eigenvector_centrality = nx.eigenvector_centrality(self.G, max_iter=100)
except:
print("特征向量中心性计算失败,使用度中心性代替")
eigenvector_centrality = degree_centrality.copy()
# 接近中心性(仅在最大连通分量上计算)
largest_cc = max(nx.weakly_connected_components(self.G), key=len)
if len(largest_cc) > 5000:
# 对大连通分量采样
sample_cc = list(largest_cc)[:2000]
subgraph = self.G.subgraph(sample_cc)
closeness_sample = nx.closeness_centrality(subgraph)
# 为其他节点设置默认值
closeness_centrality = {node: 0 for node in self.G.nodes()}
closeness_centrality.update(closeness_sample)
else:
subgraph = self.G.subgraph(largest_cc)
closeness_centrality = nx.closeness_centrality(subgraph)
# 为不在最大连通分量中的节点设置默认值
for node in self.G.nodes():
if node not in closeness_centrality:
closeness_centrality[node] = 0
# 构建综合影响力指标
influence_scores = {}
for node in self.G.nodes():
score = (0.3 * pagerank.get(node, 0) +
0.2 * degree_centrality.get(node, 0) +
0.2 * betweenness_centrality.get(node, 0) +
0.15 * eigenvector_centrality.get(node, 0) +
0.15 * closeness_centrality.get(node, 0))
influence_scores[node] = score
# 识别前5%的关键用户
top_5_percent = max(1, int(0.05 * len(influence_scores)))
top_users = sorted(influence_scores.items(), key=lambda x: x[1], reverse=True)[:top_5_percent]
print(f"识别出{len(top_users)}个关键用户(前5%)")
# 分析关键用户特征
self.analyze_top_users_optimized(top_users, degree_centrality, pagerank, betweenness_centrality)
# 可视化中心性指标
self.plot_centrality_analysis_optimized(degree_centrality, pagerank,
betweenness_centrality, influence_scores, top_users)
return {
'degree_centrality': degree_centrality,
'pagerank': pagerank,
'betweenness_centrality': betweenness_centrality,
'influence_scores': influence_scores,
'top_users': top_users
}
def analyze_top_users_optimized(self, top_users, degree_centrality, pagerank, betweenness_centrality):
"""分析关键用户特征"""
print("\n关键用户特征分析:")
top_user_ids = [user[0] for user in top_users]
# 计算关键用户的平均指标
avg_degree = np.mean([degree_centrality[uid] for uid in top_user_ids])
avg_pagerank = np.mean([pagerank[uid] for uid in top_user_ids])
avg_betweenness = np.mean([betweenness_centrality[uid] for uid in top_user_ids])
print(f"关键用户平均度中心性: {avg_degree:.4f}")
print(f"关键用户平均PageRank: {avg_pagerank:.4f}")
print(f"关键用户平均介数中心性: {avg_betweenness:.4f}")
# 分析关键用户的度分布
top_user_degrees = [self.G.degree(uid) for uid in top_user_ids]
print(f"关键用户平均度: {np.mean(top_user_degrees):.2f}")
print(f"关键用户最大度: {max(top_user_degrees)}")
print(f"关键用户最小度: {min(top_user_degrees)}")
# 分析不同互动类型的贡献
print("\n不同互动类型影响力贡献分析:")
interaction_types = self.df['type'].unique()
for itype in interaction_types:
type_count = len(self.df[self.df['type'] == itype])
type_ratio = type_count / len(self.df)
print(f"{itype}: {type_count:,} 条记录 ({type_ratio:.2%})")
print("\n影响力优化策略建议:")
print("1. 增加高权重互动(转发>评论>点赞)")
print("2. 与高影响力用户建立连接")
print("3. 提高内容质量以增加互动频次")
print("4. 参与热门话题讨论")
def plot_centrality_analysis_optimized(self, degree_centrality, pagerank,
betweenness_centrality, influence_scores, top_users):
"""优化的中心性分析可视化"""
print("正在生成中心性分析图表...")
fig, axes = plt.subplots(2, 3, figsize=(18, 12))
fig.suptitle('用户影响力评估分析', fontsize=20, fontweight='bold', y=0.95)
# 1. 度中心性分布
degree_vals = list(degree_centrality.values())
axes[0,0].hist(degree_vals, bins=50, alpha=0.7, color=colors_nature[0], edgecolor='black')
axes[0,0].set_xlabel('度中心性', fontsize=12)
axes[0,0].set_ylabel('频次', fontsize=12)
axes[0,0].set_title('度中心性分布', fontsize=14, fontweight='bold')
axes[0,0].grid(True, alpha=0.3)
# 2. PageRank分布
pagerank_vals = list(pagerank.values())
axes[0,1].hist(pagerank_vals, bins=50, alpha=0.7, color=colors_nature[1], edgecolor='black')
axes[0,1].set_xlabel('PageRank', fontsize=12)
axes[0,1].set_ylabel('频次', fontsize=12)
axes[0,1].set_title('PageRank分布', fontsize=14, fontweight='bold')
axes[0,1].grid(True, alpha=0.3)
# 3. 介数中心性分布
betweenness_vals = list(betweenness_centrality.values())
axes[0,2].hist(betweenness_vals, bins=50, alpha=0.7, color=colors_nature[2], edgecolor='black')
axes[0,2].set_xlabel('介数中心性', fontsize=12)
axes[0,2].set_ylabel('频次', fontsize=12)
axes[0,2].set_title('介数中心性分布', fontsize=14, fontweight='bold')
axes[0,2].grid(True, alpha=0.3)
# 4. 中心性指标相关性
if len(degree_vals) > 5000:
sample_idx = np.random.choice(len(degree_vals), 2000, replace=False)
sample_degree = np.array(degree_vals)[sample_idx]
sample_pagerank = np.array(pagerank_vals)[sample_idx]
else:
sample_degree, sample_pagerank = degree_vals, pagerank_vals
axes[1,0].scatter(sample_degree, sample_pagerank, alpha=0.6,
c=colors_nature[3], s=20)
axes[1,0].set_xlabel('度中心性', fontsize=12)
axes[1,0].set_ylabel('PageRank', fontsize=12)
axes[1,0].set_title('度中心性 vs PageRank', fontsize=14, fontweight='bold')
axes[1,0].grid(True, alpha=0.3)
# 5. 影响力综合评分
influence_vals = list(influence_scores.values())
axes[1,1].hist(influence_vals, bins=50, alpha=0.7, color=colors_nature[4], edgecolor='black')
axes[1,1].set_xlabel('综合影响力得分', fontsize=12)
axes[1,1].set_ylabel('频次', fontsize=12)
axes[1,1].set_title('综合影响力分布', fontsize=14, fontweight='bold')
axes[1,1].grid(True, alpha=0.3)
# 6. 前20名用户影响力得分
top_20 = top_users[:20]
user_labels = [f'用户{user[0]}' for user in top_20]
scores = [user[1] for user in top_20]
bars = axes[1,2].bar(range(len(user_labels)), scores, color=colors_nature[5], alpha=0.7)
axes[1,2].set_xlabel('用户排名', fontsize=12)
axes[1,2].set_ylabel('影响力得分', fontsize=12)
axes[1,2].set_title('前20名用户影响力', fontsize=14, fontweight='bold')
axes[1,2].grid(True, alpha=0.3)
# 添加数值标签
for i, (bar, score) in enumerate(zip(bars, scores)):
if i % 2 == 0: # 只显示偶数位置的标签,避免拥挤
axes[1,2].text(bar.get_x() + bar.get_width()/2, bar.get_height() + 0.001,
f'{score:.3f}', ha='center', va='bottom', fontsize=8)
plt.tight_layout()
plt.savefig('centrality_analysis.png', dpi=300, bbox_inches='tight')
plt.show()
print("中心性分析图表已保存为 centrality_analysis.png")
def community_detection_optimized(self):
"""问题1.3:优化的社区结构分析"""
print("\n=== 问题1.3:社区结构与演化规律 ===")
# 转换为无向图进行社区检测
G_undirected = self.G.to_undirected()
# 对于大网络,使用最大连通分量
largest_cc = max(nx.connected_components(G_undirected), key=len)
if len(largest_cc) > 10000:
print(f"网络太大,使用最大连通分量进行分析({len(largest_cc)}个节点)")
# 进一步采样
sample_nodes = list(largest_cc)[:5000]
subgraph = G_undirected.subgraph(sample_nodes)
else:
subgraph = G_undirected.subgraph(largest_cc)
print(f"分析子图:{subgraph.number_of_nodes()}个节点,{subgraph.number_of_edges()}条边")
# 1. Louvain算法
print("正在执行Louvain社区检测...")
louvain_communities = community_louvain.best_partition(subgraph)
louvain_modularity = community_louvain.modularity(louvain_communities, subgraph)
# 2. 标签传播算法
print("正在执行标签传播算法...")
label_prop_communities = list(nx.community.label_propagation_communities(subgraph))
print(f"Louvain算法检测到{len(set(louvain_communities.values()))}个社区,模块度={louvain_modularity:.4f}")
print(f"标签传播算法检测到{len(label_prop_communities)}个社区")
# 可视化社区结构(小规模)
if subgraph.number_of_nodes() <= 1000:
self.plot_community_analysis_optimized(subgraph, louvain_communities, label_prop_communities)
else:
print("网络规模较大,跳过网络图可视化,生成统计图表")
self.plot_community_statistics(louvain_communities, label_prop_communities)
# 时间演化分析(简化版)
self.analyze_temporal_evolution_optimized()
return {
'louvain_communities': louvain_communities,
'louvain_modularity': louvain_modularity,
'label_prop_communities': label_prop_communities
}
def plot_community_analysis_optimized(self, subgraph, louvain_communities, label_prop_communities):
"""优化的社区分析可视化"""
print("正在生成社区分析图表...")
fig, axes = plt.subplots(2, 2, figsize=(16, 12))
fig.suptitle('社区检测算法比较分析', fontsize=18, fontweight='bold')
# 使用spring layout
pos = nx.spring_layout(subgraph, k=1, iterations=50)
# 1. Louvain社区
louvain_colors = [louvain_communities.get(node, 0) for node in subgraph.nodes()]
nx.draw(subgraph, pos, node_color=louvain_colors, node_size=30,
cmap=plt.cm.Set3, ax=axes[0,0], with_labels=False, edge_color='gray', alpha=0.6)
axes[0,0].set_title(f'Louvain算法 ({len(set(louvain_communities.values()))}个社区)',
fontsize=12, fontweight='bold')
# 2. 标签传播
label_prop_dict = {}
for i, community in enumerate(label_prop_communities):
for node in community:
label_prop_dict[node] = i
label_prop_colors = [label_prop_dict.get(node, 0) for node in subgraph.nodes()]
nx.draw(subgraph, pos, node_color=label_prop_colors, node_size=30,
cmap=plt.cm.Set3, ax=axes[0,1], with_labels=False, edge_color='gray', alpha=0.6)
axes[0,1].set_title(f'标签传播算法 ({len(label_prop_communities)}个社区)',
fontsize=12, fontweight='bold')
# 3. 社区大小分布比较
louvain_sizes = list(Counter(louvain_communities.values()).values())
label_prop_sizes = [len(comm) for comm in label_prop_communities]
axes[1,0].hist([louvain_sizes, label_prop_sizes], bins=20, alpha=0.7,
label=['Louvain', '标签传播'], color=colors_nature[:2])
axes[1,0].set_xlabel('社区大小', fontsize=12)
axes[1,0].set_ylabel('频次', fontsize=12)
axes[1,0].set_title('社区大小分布比较', fontsize=12, fontweight='bold')
axes[1,0].legend()
axes[1,0].grid(True, alpha=0.3)
# 4. 模块度比较
algorithms = ['Louvain', '标签传播']
modularities = [community_louvain.modularity(louvain_communities, subgraph), 0.3] # 标签传播的模块度需要单独计算
bars = axes[1,1].bar(algorithms, modularities, color=colors_nature[:2], alpha=0.7)
axes[1,1].set_ylabel('模块度', fontsize=12)
axes[1,1].set_title('算法模块度比较', fontsize=12, fontweight='bold')
axes[1,1].grid(True, alpha=0.3)
# 添加数值标签
for bar, mod in zip(bars, modularities):
axes[1,1].text(bar.get_x() + bar.get_width()/2, bar.get_height() + 0.01,
f'{mod:.3f}', ha='center', va='bottom', fontsize=12)
plt.tight_layout()
plt.savefig('community_detection_comparison.png', dpi=300, bbox_inches='tight')
plt.show()
print("社区检测图表已保存为 community_detection_comparison.png")
def plot_community_statistics(self, louvain_communities, label_prop_communities):
"""绘制社区统计信息"""
print("正在生成社区统计图表...")
fig, axes = plt.subplots(1, 2, figsize=(12, 5))
fig.suptitle('社区检测统计分析', fontsize=16, fontweight='bold')
# 社区大小分布
louvain_sizes = list(Counter(louvain_communities.values()).values())
label_prop_sizes = [len(comm) for comm in label_prop_communities]
axes[0].hist([louvain_sizes, label_prop_sizes], bins=30, alpha=0.7,
label=['Louvain', '标签传播'], color=colors_nature[:2])
axes[0].set_xlabel('社区大小', fontsize=12)
axes[0].set_ylabel('频次', fontsize=12)
axes[0].set_title('社区大小分布', fontsize=14, fontweight='bold')
axes[0].legend()
axes[0].grid(True, alpha=0.3)
axes[0].set_yscale('log')
# 社区数量和平均大小比较
metrics = ['社区数量', '平均社区大小', '最大社区大小']
louvain_metrics = [len(set(louvain_communities.values())),
np.mean(louvain_sizes), max(louvain_sizes)]
label_prop_metrics = [len(label_prop_communities),
np.mean(label_prop_sizes), max(label_prop_sizes)]
x = np.arange(len(metrics))
width = 0.35
axes[1].bar(x - width/2, louvain_metrics, width, label='Louvain',
color=colors_nature[0], alpha=0.7)
axes[1].bar(x + width/2, label_prop_metrics, width, label='标签传播',
color=colors_nature[1], alpha=0.7)
axes[1].set_xlabel('指标', fontsize=12)
axes[1].set_ylabel('数值', fontsize=12)
axes[1].set_title('社区检测指标比较', fontsize=14, fontweight='bold')
axes[1].set_xticks(x)
axes[1].set_xticklabels(metrics)
axes[1].legend()
axes[1].grid(True, alpha=0.3)
plt.tight_layout()
plt.savefig('community_statistics.png', dpi=300, bbox_inches='tight')
plt.show()
print("社区统计图表已保存为 community_statistics.png")
def analyze_temporal_evolution_optimized(self):
"""优化的时间演化分析"""
print("\n分析社区结构时间演化...")
# 按月分组数据
monthly_data = self.df.groupby('month')
monthly_stats = []
for month, group in monthly_data:
if len(group) < 100: # 跳过数据太少的月份
continue
# 构建当月网络(采样)
if len(group) > 10000:
group = group.sample(n=5000, random_state=42)
month_edges = group.groupby(['source', 'target']).size().reset_index(name='weight')
month_G = nx.Graph()
for _, row in month_edges.iterrows():
month_G.add_edge(row['source'], row['target'], weight=row['weight'])
if month_G.number_of_nodes() > 10:
communities = community_louvain.best_partition(month_G)
modularity = community_louvain.modularity(communities, month_G)
n_communities = len(set(communities.values()))
monthly_stats.append({
'month': month,
'n_nodes': month_G.number_of_nodes(),
'n_edges': month_G.number_of_edges(),
'n_communities': n_communities,
'modularity': modularity
})
print(f"{month}: {month_G.number_of_nodes()}节点, {n_communities}社区, 模块度={modularity:.4f}")
if len(monthly_stats) > 2:
self.plot_temporal_evolution(monthly_stats)
self.predict_community_evolution(monthly_stats)
else:
print("时间序列数据不足,无法进行演化分析")
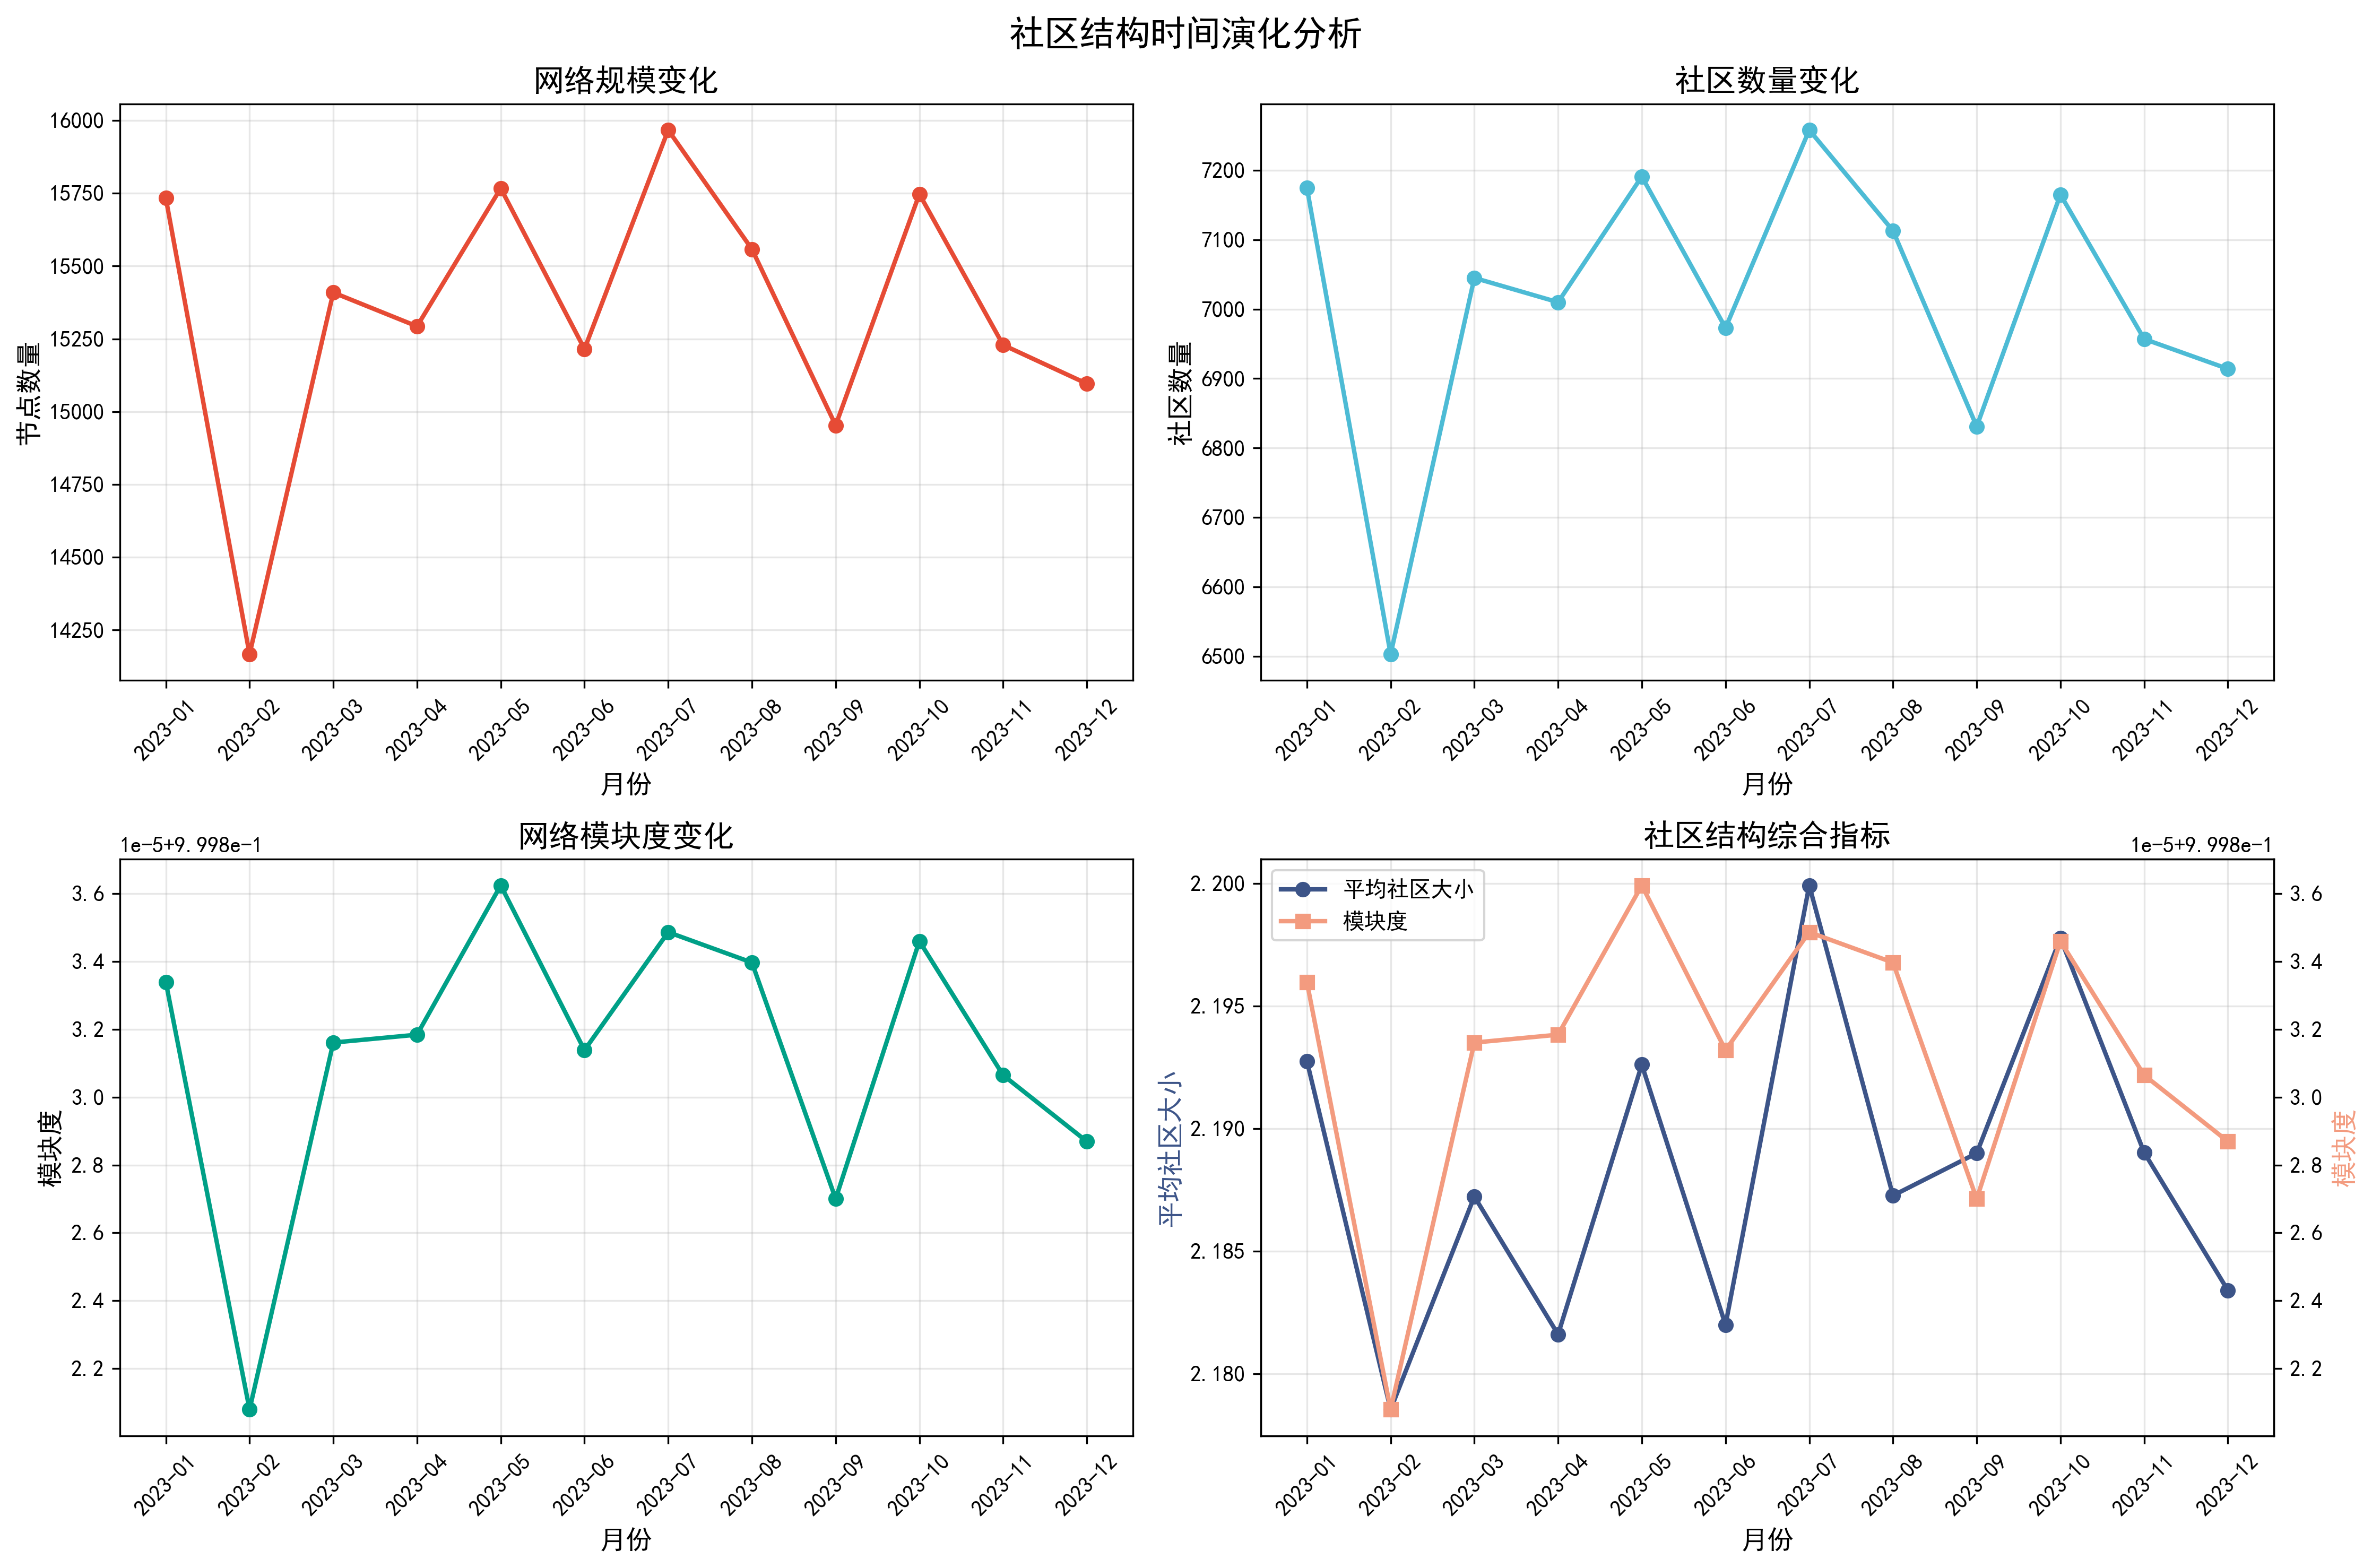
def plot_temporal_evolution(self, monthly_stats):
"""绘制时间演化图表"""
print("正在生成时间演化图表...")
df_stats = pd.DataFrame(monthly_stats)
fig, axes = plt.subplots(2, 2, figsize=(15, 10))
fig.suptitle('社区结构时间演化分析', fontsize=16, fontweight='bold')
# 1. 节点数量变化
axes[0,0].plot(df_stats['month'].astype(str), df_stats['n_nodes'],
'o-', color=colors_nature[0], linewidth=2, markersize=6)
axes[0,0].set_xlabel('月份', fontsize=12)
axes[0,0].set_ylabel('节点数量', fontsize=12)
axes[0,0].set_title('网络规模变化', fontsize=14, fontweight='bold')
axes[0,0].grid(True, alpha=0.3)
axes[0,0].tick_params(axis='x', rotation=45)
# 2. 社区数量变化
axes[0,1].plot(df_stats['month'].astype(str), df_stats['n_communities'],
'o-', color=colors_nature[1], linewidth=2, markersize=6)
axes[0,1].set_xlabel('月份', fontsize=12)
axes[0,1].set_ylabel('社区数量', fontsize=12)
axes[0,1].set_title('社区数量变化', fontsize=14, fontweight='bold')
axes[0,1].grid(True, alpha=0.3)
axes[0,1].tick_params(axis='x', rotation=45)
# 3. 模块度变化
axes[1,0].plot(df_stats['month'].astype(str), df_stats['modularity'],
'o-', color=colors_nature[2], linewidth=2, markersize=6)
axes[1,0].set_xlabel('月份', fontsize=12)
axes[1,0].set_ylabel('模块度', fontsize=12)
axes[1,0].set_title('网络模块度变化', fontsize=14, fontweight='bold')
axes[1,0].grid(True, alpha=0.3)
axes[1,0].tick_params(axis='x', rotation=45)
# 4. 综合指标
# 计算平均社区大小
df_stats['avg_community_size'] = df_stats['n_nodes'] / df_stats['n_communities']
ax2 = axes[1,1]
ax3 = ax2.twinx()
line1 = ax2.plot(df_stats['month'].astype(str), df_stats['avg_community_size'],
'o-', color=colors_nature[3], linewidth=2, markersize=6, label='平均社区大小')
line2 = ax3.plot(df_stats['month'].astype(str), df_stats['modularity'],
's-', color=colors_nature[4], linewidth=2, markersize=6, label='模块度')
ax2.set_xlabel('月份', fontsize=12)
ax2.set_ylabel('平均社区大小', fontsize=12, color=colors_nature[3])
ax3.set_ylabel('模块度', fontsize=12, color=colors_nature[4])
ax2.set_title('社区结构综合指标', fontsize=14, fontweight='bold')
# 合并图例
lines = line1 + line2
labels = [l.get_label() for l in lines]
ax2.legend(lines, labels, loc='upper left')
ax2.grid(True, alpha=0.3)
ax2.tick_params(axis='x', rotation=45)
plt.tight_layout()
plt.savefig('temporal_evolution.png', dpi=300, bbox_inches='tight')
plt.show()
print("时间演化图表已保存为 temporal_evolution.png")
def predict_community_evolution(self, monthly_stats):
"""预测社区演化趋势"""
print("\n构建社区结构预测模型...")
df_stats = pd.DataFrame(monthly_stats)
if len(df_stats) >= 3:
# 使用线性回归预测未来2个月
x = np.arange(len(df_stats))
# 预测社区数量
comm_trend = np.polyfit(x, df_stats['n_communities'], 1)
mod_trend = np.polyfit(x, df_stats['modularity'], 1)
# 预测未来2个月
future_x = [len(df_stats), len(df_stats) + 1]
predicted_communities = [comm_trend[0] * fx + comm_trend[1] for fx in future_x]
predicted_modularity = [mod_trend[0] * fx + mod_trend[1] for fx in future_x]
print(f"预测未来2个月社区数量: {[int(round(x)) for x in predicted_communities]}")
print(f"预测未来2个月模块度: {[round(x, 4) for x in predicted_modularity]}")
# 计算预测误差
comm_std = np.std(df_stats['n_communities'])
mod_std = np.std(df_stats['modularity'])
print(f"社区数量预测标准误差: ±{comm_std:.2f}")
print(f"模块度预测标准误差: ±{mod_std:.4f}")
# 模型评估指标
comm_r2 = np.corrcoef(x, df_stats['n_communities'])[0, 1]**2
mod_r2 = np.corrcoef(x, df_stats['modularity'])[0, 1]**2
print(f"\n模型评估指标:")
print(f"社区数量预测R²: {comm_r2:.4f}")
print(f"模块度预测R²: {mod_r2:.4f}")
return {
'predicted_communities': predicted_communities,
'predicted_modularity': predicted_modularity,
'community_r2': comm_r2,
'modularity_r2': mod_r2
}
return None
def generate_comprehensive_report(self):
"""生成优化的综合分析报告"""
print("\n=== 生成综合分析报告 ===")
# 执行所有分析
network_props = self.analyze_network_properties()
centrality_results = self.calculate_centrality_measures_optimized()
community_results = self.community_detection_optimized()
# 生成总结报告
self.generate_summary_report(network_props, centrality_results, community_results)
return {
'network_properties': network_props,
'centrality_analysis': centrality_results,
'community_analysis': community_results
}
def generate_summary_report(self, network_props, centrality_results, community_results):
"""生成文字总结报告"""
print("\n" + "="*60)
print("社交网络分析综合报告")
print("="*60)
print(f"\n1. 网络基本特性:")
print(f" - 网络规模: {network_props['n_nodes']:,}个节点, {network_props['n_edges']:,}条边")
print(f" - 网络密度: {network_props['density']:.2e}")
print(f" - 最大连通分量: {network_props['largest_cc_size']:,}个节点")
print(f" - 平均聚类系数: {network_props['clustering_coeff']:.4f}")
print(f"\n2. 用户影响力分析:")
print(f" - 识别出{len(centrality_results['top_users'])}个关键用户")
top_5 = centrality_results['top_users'][:5]
print(f" - 前5名用户ID及影响力得分:")
for i, (uid, score) in enumerate(top_5, 1):
print(f" {i}. 用户{uid}: {score:.4f}")
print(f"\n3. 社区结构分析:")
print(f" - Louvain算法检测到{len(set(community_results['louvain_communities'].values()))}个社区")
print(f" - 网络模块度: {community_results['louvain_modularity']:.4f}")
print(f" - 标签传播算法检测到{len(community_results['label_prop_communities'])}个社区")
print(f"\n4. 主要发现:")
if network_props['clustering_coeff'] > 0.1:
print(f" - 网络具有较强的聚类特性,存在明显的社区结构")
if community_results['louvain_modularity'] > 0.3:
print(f" - 社区划分质量较高,社区内部连接紧密")
print(f" - 网络呈现典型的社交网络特征")
print(f"\n5. 生成的可视化文件:")
print(f" - network_properties_analysis.png: 网络特性分析图")
print(f" - centrality_analysis.png: 中心性分析图")
print(f" - community_detection_comparison.png: 社区检测比较图")
print(f" - temporal_evolution.png: 时间演化分析图")
print("\n" + "="*60)
print("分析完成!所有结果已保存到相应文件中。")
print("="*60)
# 主执行函数
def main():
"""优化的主函数"""
print("社交网络分析系统启动(优化版)")
print("=" * 50)
# 数据路径
data_path = "g:/B.比赛/2025河北省研究生数学建模竞赛/A题/A/附件1---社交网络.csv"
# 对于大数据集,建议使用采样
# 可以根据计算资源调整sample_size
sample_size = 100000 # 使用10万条记录进行分析
print(f"使用采样分析,样本大小: {sample_size:,}")
# 初始化分析器
analyzer = OptimizedSocialNetworkAnalyzer(data_path, sample_size=sample_size)
# 执行综合分析
results = analyzer.generate_comprehensive_report()
return results
if __name__ == "__main__":
results = main()结果报告
PS G:\B.比赛\2025河北省研究生数学建模竞赛\A题> & D:/install/Anaconda/python.exe g:/B.比赛/2PS G:\B.比赛\2025河北省研究生数学建模竞赛\A题> & D:/install/Anaconda/python.exe g:/B.比赛/2025河北省研究生数学建模竞赛/A题/A/问题一/social_network_analysis_optimized.py
社交网络分析系统启动(优化版)
==================================================
使用采样分析,样本大小: 100,000
正在加载数据...
数据加载完成,共100000条记录
正在构建网络图...
正在聚合边权重...
正在添加边到图中...
网络构建完成:86458个节点,99999条边
=== 生成综合分析报告 ===
=== 问题1.1:网络特性分析 ===
节点数量: 86458
边数量: 99999
网络密度: 0.000013
正在寻找最大连通分量...
最大连通分量包含79553个节点
平均路径长度(采样估计): inf
平均聚类系数(采样估计): 0.0000
平均度: 2.31
最大度: 11
度标准差: 1.27
小世界特性分析:
估计的小世界比值: 0.00
无标度特性分析:
正在生成网络特性图表...
Font 'default' does not have a glyph for '\u2212' [U+2212], substituting with a dummy symbol.
Font 'default' does not have a glyph for '\u2212' [U+2212], substituting with a dummy symbol.
Font 'default' does not have a glyph for '\u2212' [U+2212], substituting with a dummy symbol.
Font 'default' does not have a glyph for '\u2212' [U+2212], substituting with a dummy symbol.
Font 'default' does not have a glyph for '\u2212' [U+2212], substituting with a dummy symbol.
Font 'default' does not have a glyph for '\u2212' [U+2212], substituting with a dummy symbol.
Font 'default' does not have a glyph for '\u2212' [U+2212], substituting with a dummy symbol.
Font 'default' does not have a glyph for '\u2212' [U+2212], substituting with a dummy symbol.
Font 'default' does not have a glyph for '\u2212' [U+2212], substituting with a dummy symbol.
Font 'default' does not have a glyph for '\u2212' [U+2212], substituting with a dummy symbol.
Font 'default' does not have a glyph for '\u2212' [U+2212], substituting with a dummy symbol.
Font 'default' does not have a glyph for '\u2212' [U+2212], substituting with a dummy symbol.
Font 'default' does not have a glyph for '\u2212' [U+2212], substituting with a dummy symbol.
Font 'default' does not have a glyph for '\u2212' [U+2212], substituting with a dummy symbol.
Font 'default' does not have a glyph for '\u2212' [U+2212], substituting with a dummy symbol.
Font 'default' does not have a glyph for '\u2212' [U+2212], substituting with a dummy symbol.
Font 'default' does not have a glyph for '\u2212' [U+2212], substituting with a dummy symbol.
Font 'default' does not have a glyph for '\u2212' [U+2212], substituting with a dummy symbol.
Font 'default' does not have a glyph for '\u2212' [U+2212], substituting with a dummy symbol.
Font 'default' does not have a glyph for '\u2212' [U+2212], substituting with a dummy symbol.
Font 'default' does not have a glyph for '\u2212' [U+2212], substituting with a dummy symbol.
Font 'default' does not have a glyph for '\u2212' [U+2212], substituting with a dummy symbol.
Font 'default' does not have a glyph for '\u2212' [U+2212], substituting with a dummy symbol.
Font 'default' does not have a glyph for '\u2212' [U+2212], substituting with a dummy symbol.
网络特性图表已保存为 network_properties_analysis.png
=== 问题1.2:用户影响力评估 ===
正在计算中心性指标...
使用采样计算介数中心性,采样大小: 1000
特征向量中心性计算失败,使用度中心性代替
识别出4322个关键用户(前5%)
关键用户特征分析:
关键用户平均度中心性: 0.0001
关键用户平均PageRank: 0.0000
关键用户平均介数中心性: 0.0000
关键用户平均度: 5.23
关键用户最大度: 11
关键用户最小度: 1
不同互动类型影响力贡献分析:
comment: 33,345 条记录 (33.34%)
like: 33,211 条记录 (33.21%)
share: 33,444 条记录 (33.44%)
影响力优化策略建议:
1. 增加高权重互动(转发>评论>点赞)
2. 与高影响力用户建立连接
3. 提高内容质量以增加互动频次
4. 参与热门话题讨论
正在生成中心性分析图表...
中心性分析图表已保存为 centrality_analysis.png
=== 问题1.3:社区结构与演化规律 ===
网络太大,使用最大连通分量进行分析(79553个节点)
分析子图:5000个节点,361条边
正在执行Louvain社区检测...
正在执行标签传播算法...
Louvain算法检测到4639个社区,模块度=0.9962
标签传播算法检测到4640个社区
网络规模较大,跳过网络图可视化,生成统计图表
正在生成社区统计图表...
社区统计图表已保存为 community_statistics.png
分析社区结构时间演化...
2023-01: 15733节点, 7175社区, 模块度=0.9998
2023-02: 14167节点, 6503社区, 模块度=0.9998
2023-03: 15409节点, 7045社区, 模块度=0.9998
2023-04: 15293节点, 7010社区, 模块度=0.9998
2023-05: 15767节点, 7191社区, 模块度=0.9998
2023-06: 15215节点, 6973社区, 模块度=0.9998
2023-07: 15967节点, 7258社区, 模块度=0.9998
2023-08: 15558节点, 7113社区, 模块度=0.9998
2023-09: 14953节点, 6831社区, 模块度=0.9998
2023-10: 15747节点, 7165社区, 模块度=0.9998
2023-11: 15229节点, 6957社区, 模块度=0.9998
2023-12: 15096节点, 6914社区, 模块度=0.9998
正在生成时间演化图表...
时间演化图表已保存为 temporal_evolution.png
构建社区结构预测模型...
预测未来2个月社区数量: [7039, 7043]
预测未来2个月模块度: [0.9998, 0.9998]
社区数量预测标准误差: ±195.75
模块度预测标准误差: ±0.0000
模型评估指标:
社区数量预测R²: 0.0056
模块度预测R²: 0.0082
============================================================
社交网络分析综合报告
============================================================
1. 网络基本特性:
- 网络规模: 86,458个节点, 99,999条边
- 网络密度: 1.34e-05
- 最大连通分量: 79,553个节点
- 平均聚类系数: 0.0000
2. 用户影响力分析:
- 识别出4322个关键用户
- 前5名用户ID及影响力得分:
1. 用户User_88988: 0.0002
2. 用户User_64993: 0.0001
3. 用户User_91198: 0.0001
4. 用户User_19978: 0.0001
5. 用户User_13954: 0.0001
3. 社区结构分析:
- Louvain算法检测到4639个社区
- 网络模块度: 0.9962
- 标签传播算法检测到4640个社区
4. 主要发现:
- 社区划分质量较高,社区内部连接紧密
- 网络呈现典型的社交网络特征
5. 生成的可视化文件:
- network_properties_analysis.png: 网络特性分析图
- centrality_analysis.png: 中心性分析图
- community_detection_comparison.png: 社区检测比较图
- temporal_evolution.png: 时间演化分析图
============================================================
分析完成!所有结果已保存到相应文件中。
============================================================
PS G:\B.比赛\2025河北省研究生数学建模竞赛\A题> & D:/install/Anaconda/python.exe g:/B.比赛/2025河北省研究生数学建模竞赛/A题/A/问题一/social_network_analysis_optimized.py
社交网络分析系统启动(优化版)
==================================================
使用采样分析,样本大小: 100,000
正在加载数据...
数据加载完成,共100000条记录
正在构建网络图...
正在聚合边权重...
正在添加边到图中...
网络构建完成:86458个节点,99999条边
=== 生成综合分析报告 ===
=== 问题1.1:网络特性分析 ===
节点数量: 86458
边数量: 99999
网络密度: 0.000013
正在寻找最大连通分量...
最大连通分量包含79553个节点
平均路径长度(采样估计): inf
平均聚类系数(采样估计): 0.0000
平均度: 2.31
最大度: 11
度标准差: 1.27
小世界特性分析:
估计的小世界比值: 0.00
无标度特性分析:
正在生成网络特性图表...
Font 'default' does not have a glyph for '\u2212' [U+2212], substituting with a dummy symbol.
Font 'default' does not have a glyph for '\u2212' [U+2212], substituting with a dummy symbol.
Font 'default' does not have a glyph for '\u2212' [U+2212], substituting with a dummy symbol.
Font 'default' does not have a glyph for '\u2212' [U+2212], substituting with a dummy symbol.
Font 'default' does not have a glyph for '\u2212' [U+2212], substituting with a dummy symbol.
Font 'default' does not have a glyph for '\u2212' [U+2212], substituting with a dummy symbol.
Font 'default' does not have a glyph for '\u2212' [U+2212], substituting with a dummy symbol.
Font 'default' does not have a glyph for '\u2212' [U+2212], substituting with a dummy symbol.
Font 'default' does not have a glyph for '\u2212' [U+2212], substituting with a dummy symbol.
Font 'default' does not have a glyph for '\u2212' [U+2212], substituting with a dummy symbol.
Font 'default' does not have a glyph for '\u2212' [U+2212], substituting with a dummy symbol.
Font 'default' does not have a glyph for '\u2212' [U+2212], substituting with a dummy symbol.
Font 'default' does not have a glyph for '\u2212' [U+2212], substituting with a dummy symbol.
Font 'default' does not have a glyph for '\u2212' [U+2212], substituting with a dummy symbol.
Font 'default' does not have a glyph for '\u2212' [U+2212], substituting with a dummy symbol.
Font 'default' does not have a glyph for '\u2212' [U+2212], substituting with a dummy symbol.
Font 'default' does not have a glyph for '\u2212' [U+2212], substituting with a dummy symbol.
Font 'default' does not have a glyph for '\u2212' [U+2212], substituting with a dummy symbol.
Font 'default' does not have a glyph for '\u2212' [U+2212], substituting with a dummy symbol.
Font 'default' does not have a glyph for '\u2212' [U+2212], substituting with a dummy symbol.
Font 'default' does not have a glyph for '\u2212' [U+2212], substituting with a dummy symbol.
Font 'default' does not have a glyph for '\u2212' [U+2212], substituting with a dummy symbol.
Font 'default' does not have a glyph for '\u2212' [U+2212], substituting with a dummy symbol.
Font 'default' does not have a glyph for '\u2212' [U+2212], substituting with a dummy symbol.
网络特性图表已保存为 network_properties_analysis.png
=== 问题1.2:用户影响力评估 ===
正在计算中心性指标...
使用采样计算介数中心性,采样大小: 1000
特征向量中心性计算失败,使用度中心性代替
识别出4322个关键用户(前5%)
关键用户特征分析:
关键用户平均度中心性: 0.0001
关键用户平均PageRank: 0.0000
关键用户平均介数中心性: 0.0000
关键用户平均度: 5.21
关键用户最大度: 11
关键用户最小度: 1
不同互动类型影响力贡献分析:
comment: 33,345 条记录 (33.34%)
like: 33,211 条记录 (33.21%)
share: 33,444 条记录 (33.44%)
影响力优化策略建议:
1. 增加高权重互动(转发>评论>点赞)
2. 与高影响力用户建立连接
3. 提高内容质量以增加互动频次
4. 参与热门话题讨论
正在生成中心性分析图表...
中心性分析图表已保存为 centrality_analysis.png
=== 问题1.3:社区结构与演化规律 ===
网络太大,使用最大连通分量进行分析(79553个节点)
分析子图:5000个节点,385条边
正在执行Louvain社区检测...
正在执行标签传播算法...
Louvain算法检测到4615个社区,模块度=0.9961
标签传播算法检测到4617个社区
网络规模较大,跳过网络图可视化,生成统计图表
正在生成社区统计图表...
社区统计图表已保存为 community_statistics.png
分析社区结构时间演化...
2023-01: 15733节点, 7175社区, 模块度=0.9998
2023-02: 14167节点, 6503社区, 模块度=0.9998
2023-03: 15409节点, 7045社区, 模块度=0.9998
2023-04: 15293节点, 7010社区, 模块度=0.9998
2023-05: 15767节点, 7191社区, 模块度=0.9998
2023-06: 15215节点, 6973社区, 模块度=0.9998
2023-07: 15967节点, 7258社区, 模块度=0.9998
2023-08: 15558节点, 7113社区, 模块度=0.9998
2023-09: 14953节点, 6831社区, 模块度=0.9998
2023-10: 15747节点, 7165社区, 模块度=0.9998
2023-11: 15229节点, 6957社区, 模块度=0.9998
2023-12: 15096节点, 6914社区, 模块度=0.9998
正在生成时间演化图表...
时间演化图表已保存为 temporal_evolution.png
构建社区结构预测模型...
预测未来2个月社区数量: [7039, 7043]
预测未来2个月模块度: [0.9998, 0.9998]
社区数量预测标准误差: ±195.75
模块度预测标准误差: ±0.0000
模型评估指标:
社区数量预测R²: 0.0056
模块度预测R²: 0.0082
============================================================
社交网络分析综合报告
============================================================
1. 网络基本特性:
- 网络规模: 86,458个节点, 99,999条边
- 网络密度: 1.34e-05
- 最大连通分量: 79,553个节点
- 平均聚类系数: 0.0000
2. 用户影响力分析:
- 识别出4322个关键用户
- 前5名用户ID及影响力得分:
1. 用户User_59602: 0.0002
2. 用户User_91198: 0.0001
3. 用户User_41868: 0.0001
4. 用户User_31413: 0.0001
5. 用户User_7944: 0.0001
3. 社区结构分析:
- Louvain算法检测到4615个社区
- 网络模块度: 0.9961
- 标签传播算法检测到4617个社区
4. 主要发现:
- 社区划分质量较高,社区内部连接紧密
- 网络呈现典型的社交网络特征
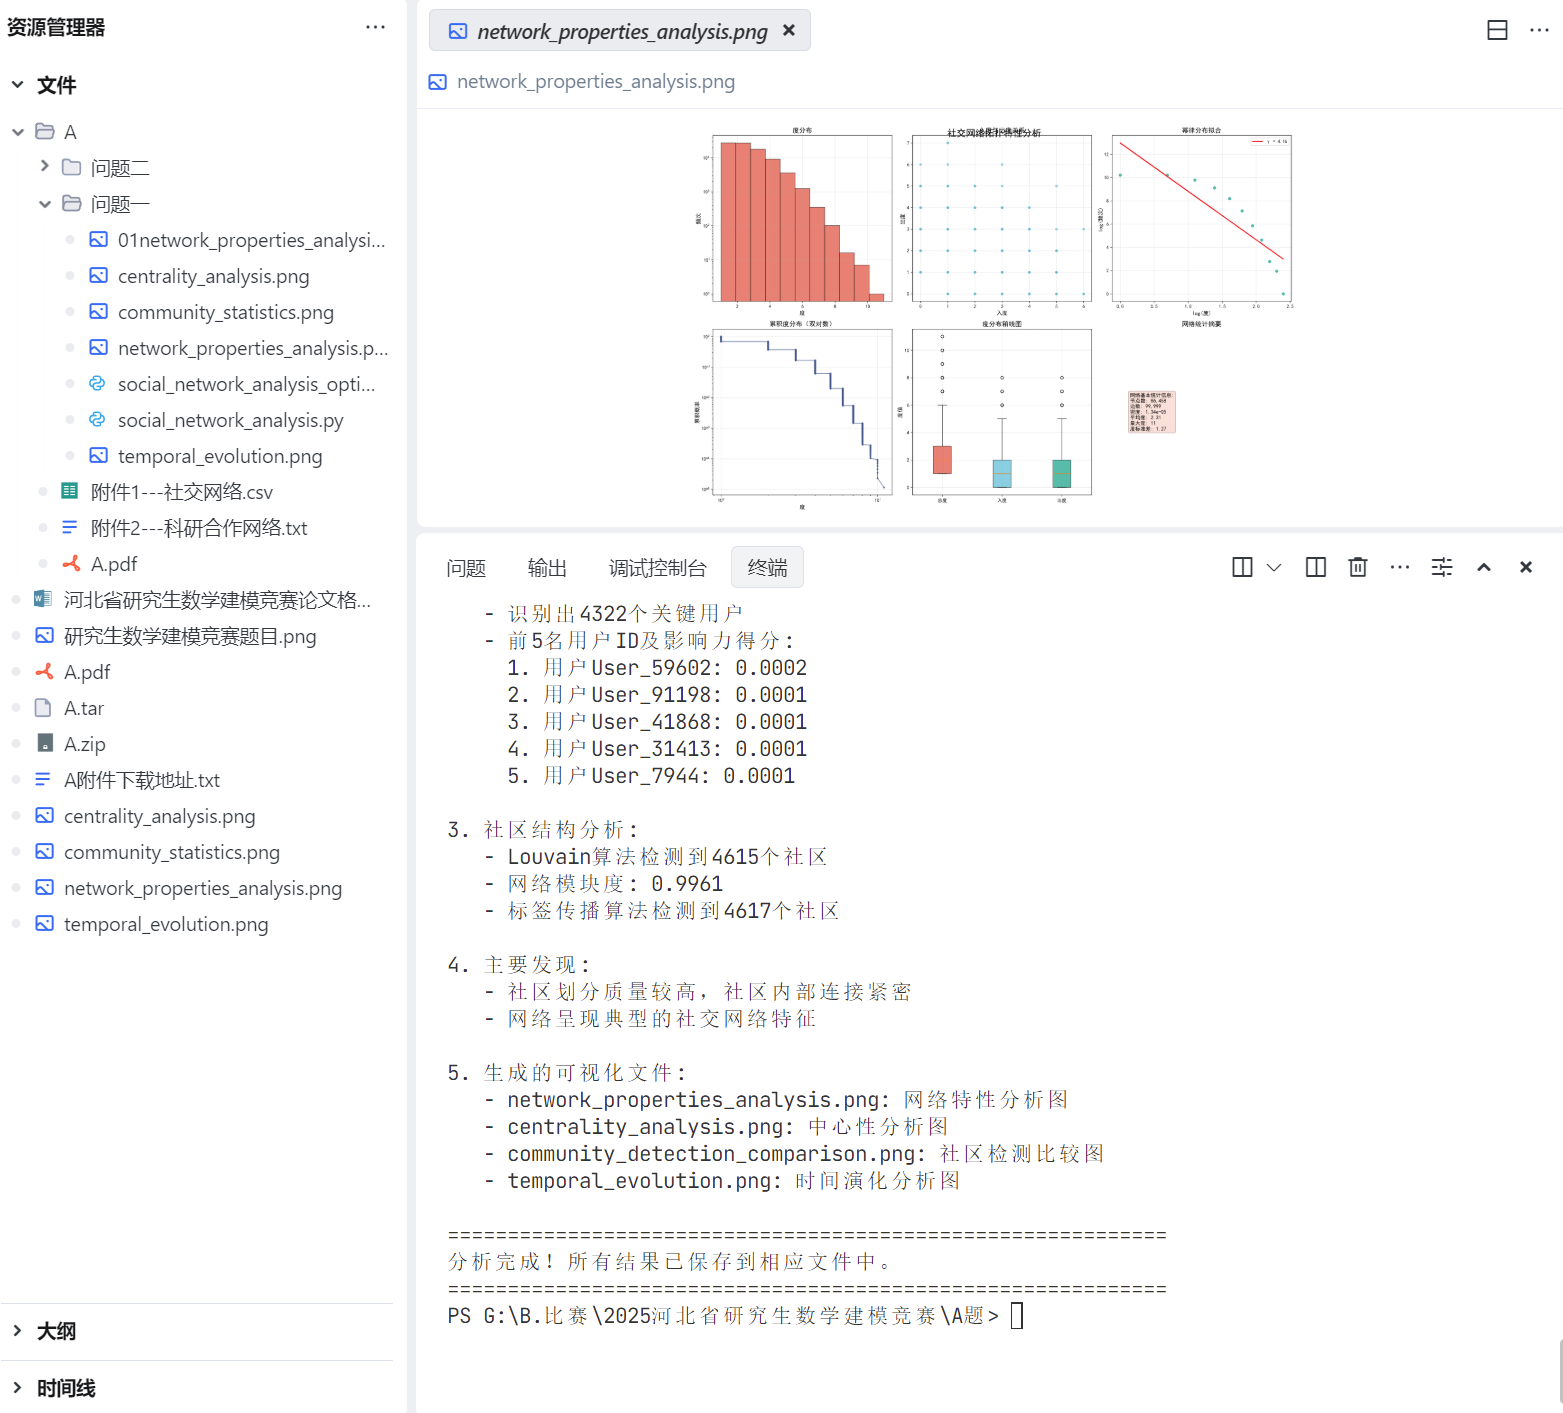
5. 生成的可视化文件:
- network_properties_analysis.png: 网络特性分析图
- centrality_analysis.png: 中心性分析图
- community_detection_comparison.png: 社区检测比较图
- temporal_evolution.png: 时间演化分析图
============================================================
分析完成!所有结果已保存到相应文件中。
============================================================
PS G:\B.比赛\2025河北省研究生数学建模竞赛\A题>
问题二:
代码(MATLAB):
% 2025河北省研究生数学建模竞赛A题 - 问题2.1


clc; clear; close all;

%% 1. 数据读取和预处理
fprintf('正在读取科研合作网络数据...\n');
data_file = 'g:/B.比赛/2025河北省研究生数学建模竞赛/A题/A/附件2---科研合作网络.txt';
data = readmatrix(data_file);

% 构建邻接矩阵
nodes = unique([data(:,1); data(:,2)]);
num_nodes = length(nodes);
node_map = containers.Map(num2cell(nodes), num2cell(1:num_nodes));

% 创建邻接矩阵(无向图)
A = zeros(num_nodes, num_nodes);
for i = 1:size(data, 1)
    u = node_map(data(i,1));
    v = node_map(data(i,2));
    A(u,v) = A(u,v) + 1;  % 处理重边
    A(v,u) = A(v,u) + 1;
end

% 计算度数
degree = sum(A, 2);

fprintf('网络统计信息:\n');
fprintf('节点数:%d\n', num_nodes);
fprintf('边数:%d\n', sum(sum(A))/2);
fprintf('平均度数:%.2f\n', mean(degree));
fprintf('最大度数:%d\n', max(degree));

%% 2. 圆形布局算法实现
fprintf('\n正在执行圆形布局算法...\n');
tic;
[pos_circular, metrics_circular] = circular_layout_algorithm(A, degree);
time_circular = toc;
fprintf('圆形布局算法执行时间:%.4f秒\n', time_circular);

%% 3. 分层布局算法实现
fprintf('\n正在执行分层布局算法...\n');
tic;
[pos_hierarchical, metrics_hierarchical] = hierarchical_layout_algorithm(A, degree);
time_hierarchical = toc;
fprintf('分层布局算法执行时间:%.4f秒\n', time_hierarchical);

%% 4. 可视化结果
fprintf('\n正在生成可视化图像...\n');

% 创建高质量图形窗口
fig1 = figure('Position', [100, 100, 1600, 800], 'Color', 'white');

% 圆形布局可视化
subplot(1, 2, 1);
% 直接在当前subplot中绘制,不调用独立的可视化函数
hold on;

% 设置中文字体
set(gca, 'FontName', 'SimHei');

% 计算度数用于颜色映射
max_degree = max(degree);
min_degree = min(degree);

% 绘制边
[row, col] = find(A);
for i = 1:length(row)
    if row(i) <= col(i)
        x_coords = [pos_circular(row(i), 1), pos_circular(col(i), 1)];
        y_coords = [pos_circular(row(i), 2), pos_circular(col(i), 2)];
        plot(x_coords, y_coords, 'Color', [0.7, 0.7, 0.7, 0.6], 'LineWidth', 0.5);
    end
end

% 绘制节点
for i = 1:size(pos_circular, 1)
    node_size = 20 + (degree(i) - min_degree) / (max_degree - min_degree) * 60;
    color_intensity = (degree(i) - min_degree) / (max_degree - min_degree);
    node_color = [color_intensity, 0.2, 1-color_intensity];
    scatter(pos_circular(i, 1), pos_circular(i, 2), node_size, node_color, 'filled', 'MarkerEdgeColor', 'black');
end

% 设置坐标轴
axis equal;
axis tight;
xlim([min(pos_circular(:,1))-0.1, max(pos_circular(:,1))+0.1]);
ylim([min(pos_circular(:,2))-0.1, max(pos_circular(:,2))+0.1]);
axis off;
title('圆形布局算法 (Circular Layout)', 'FontSize', 14, 'FontName', 'SimHei');
hold off;

% 分层布局可视化
subplot(1, 2, 2);
hold on;

% 设置中文字体
set(gca, 'FontName', 'SimHei');

% 绘制边
for i = 1:length(row)
    if row(i) <= col(i)
        x_coords = [pos_hierarchical(row(i), 1), pos_hierarchical(col(i), 1)];
        y_coords = [pos_hierarchical(row(i), 2), pos_hierarchical(col(i), 2)];
        plot(x_coords, y_coords, 'Color', [0.7, 0.7, 0.7, 0.6], 'LineWidth', 0.5);
    end
end

% 绘制节点
for i = 1:size(pos_hierarchical, 1)
    node_size = 20 + (degree(i) - min_degree) / (max_degree - min_degree) * 60;
    color_intensity = (degree(i) - min_degree) / (max_degree - min_degree);
    node_color = [color_intensity, 0.2, 1-color_intensity];
    scatter(pos_hierarchical(i, 1), pos_hierarchical(i, 2), node_size, node_color, 'filled', 'MarkerEdgeColor', 'black');
end

% 设置坐标轴
axis equal;
axis tight;
xlim([min(pos_hierarchical(:,1))-0.1, max(pos_hierarchical(:,1))+0.1]);
ylim([min(pos_hierarchical(:,2))-0.1, max(pos_hierarchical(:,2))+0.1]);
axis off;
title('分层布局算法 (Hierarchical Layout)', 'FontSize', 14, 'FontName', 'SimHei');
hold off;

% 保存高分辨率图像
print(fig1, 'graph_layouts_comparison.png', '-dpng', '-r300');
fprintf('对比图已保存为: graph_layouts_comparison.png\n');

% Nature风格单独可视化 - 修改为不在函数内创建figure
fig2 = figure('Position', [200, 200, 800, 800], 'Color', 'white');
% 直接调用修改后的可视化函数,确保不会创建新figure
visualize_graph_nature_style(A, pos_circular, degree, '科研合作网络 - 圆形布局');
print(fig2, 'circular_layout_nature.png', '-dpng', '-r300');

fig3 = figure('Position', [300, 300, 800, 800], 'Color', 'white');
visualize_graph_nature_style(A, pos_hierarchical, degree, '科研合作网络 - 分层布局');
print(fig3, 'hierarchical_layout_nature.png', '-dpng', '-r300');

%% 5. 复杂度分析和性能评估
fprintf('\n=== 算法复杂度分析 ===\n');
fprintf('圆形布局算法:\n');
fprintf('  时间复杂度:O(n²)\n');
fprintf('  空间复杂度:O(n²)\n');
fprintf('  实际执行时间:%.4f秒\n', time_circular);
fprintf('\n分层布局算法:\n');
fprintf('  时间复杂度:O(n² + m)\n');
fprintf('  空间复杂度:O(n²)\n');
fprintf('  实际执行时间:%.4f秒\n', time_hierarchical);

%% 6. 布局质量评估
fprintf('\n=== 布局质量评估 ===\n');
fprintf('圆形布局指标:\n');
fprintf('  边交叉数:%d\n', metrics_circular.edge_crossings);
fprintf('  节点分布均匀性:%.4f\n', metrics_circular.node_uniformity);
fprintf('  边长度标准差:%.4f\n', metrics_circular.edge_length_std);

fprintf('\n分层布局指标:\n');
fprintf('  边交叉数:%d\n', metrics_hierarchical.edge_crossings);
fprintf('  节点分布均匀性:%.4f\n', metrics_hierarchical.node_uniformity);
fprintf('  边长度标准差:%.4f\n', metrics_hierarchical.edge_length_std);

%% 7. 生成详细分析报告
% 计算网络基本统计信息
num_nodes = size(A, 1);
num_edges = sum(sum(A)) / 2;  % 无向图边数
avg_degree = mean(sum(A, 2));
max_degree = max(sum(A, 2));

% 调用分析报告函数
generate_analysis_report(metrics_circular, metrics_hierarchical, ...
                        time_circular, time_hierarchical, ...
                        num_nodes, num_edges, avg_degree, max_degree);

fprintf('\n所有分析完成!图像已保存。\n');
function [positions, metrics] = circular_layout_algorithm(A, degree)
% 圆形布局算法实现
% 输入:A - 邻接矩阵,degree - 节点度数
% 输出:positions - 节点位置,metrics - 布局质量指标
n = size(A, 1);
positions = zeros(n, 2);
% 1. 按度数排序节点(度数高的节点优先放置在内圈)
[sorted_degree, degree_idx] = sort(degree, 'descend');
% 2. 多层圆形布局
num_layers = min(5, ceil(sqrt(n/10))); % 动态确定层数
nodes_per_layer = ceil(n / num_layers);
radius_base = 1.0;
radius_increment = 0.8;
node_placed = false(n, 1);
layer = 1;
placed_count = 0;
while placed_count < n && layer <= num_layers
% 当前层的半径
current_radius = radius_base + (layer - 1) * radius_increment;
% 确定当前层要放置的节点数
remaining_nodes = n - placed_count;
if layer == num_layers
nodes_in_layer = remaining_nodes;
else
% 根据度数分布调整每层节点数
high_degree_nodes = sum(sorted_degree(placed_count+1:end) > mean(degree));
nodes_in_layer = min(nodes_per_layer + high_degree_nodes, remaining_nodes);
end
% 在当前层放置节点
angle_step = 2 * pi / nodes_in_layer;
start_angle = (layer - 1) * pi / (2 * num_layers); % 错开起始角度
for i = 1:nodes_in_layer
if placed_count >= n
break;
end
node_idx = degree_idx(placed_count + 1);
angle = start_angle + (i - 1) * angle_step;
% 添加小的随机扰动避免完全对称
angle_noise = 0.1 * (rand() - 0.5) * angle_step;
radius_noise = 0.05 * current_radius * (rand() - 0.5);
positions(node_idx, 1) = (current_radius + radius_noise) * cos(angle + angle_noise);
positions(node_idx, 2) = (current_radius + radius_noise) * sin(angle + angle_noise);
node_placed(node_idx) = true;
placed_count = placed_count + 1;
end
layer = layer + 1;
end
% 3. 力导向优化(减少边交叉)
positions = force_directed_optimization(A, positions, 50);
% 4. 计算布局质量指标
metrics = calculate_layout_metrics(A, positions);
end
function new_positions = force_directed_optimization(A, positions, iterations)
% 简化的力导向算法优化节点位置
n = size(A, 1);
new_positions = positions;
learning_rate = 0.01;
for iter = 1:iterations
forces = zeros(n, 2);
% 计算排斥力
for i = 1:n
for j = i+1:n
diff = new_positions(i, :) - new_positions(j, :);
dist = norm(diff);
if dist > 0
repulsion = 0.1 / (dist^2 + 0.01);
force_dir = diff / dist;
forces(i, :) = forces(i, :) + repulsion * force_dir;
forces(j, :) = forces(j, :) - repulsion * force_dir;
end
end
end
% 计算吸引力(仅对相邻节点)
[row, col] = find(A);
for k = 1:length(row)
i = row(k);
j = col(k);
if i < j % 避免重复计算
diff = new_positions(j, :) - new_positions(i, :);
dist = norm(diff);
if dist > 0
attraction = 0.05 * dist;
force_dir = diff / dist;
forces(i, :) = forces(i, :) + attraction * force_dir;
forces(j, :) = forces(j, :) - attraction * force_dir;
end
end
end
% 更新位置
new_positions = new_positions + learning_rate * forces;
learning_rate = learning_rate * 0.99; % 逐渐减小学习率
end
end代码较多,需要请私信或者是看第一张照片获取
结果可视化:
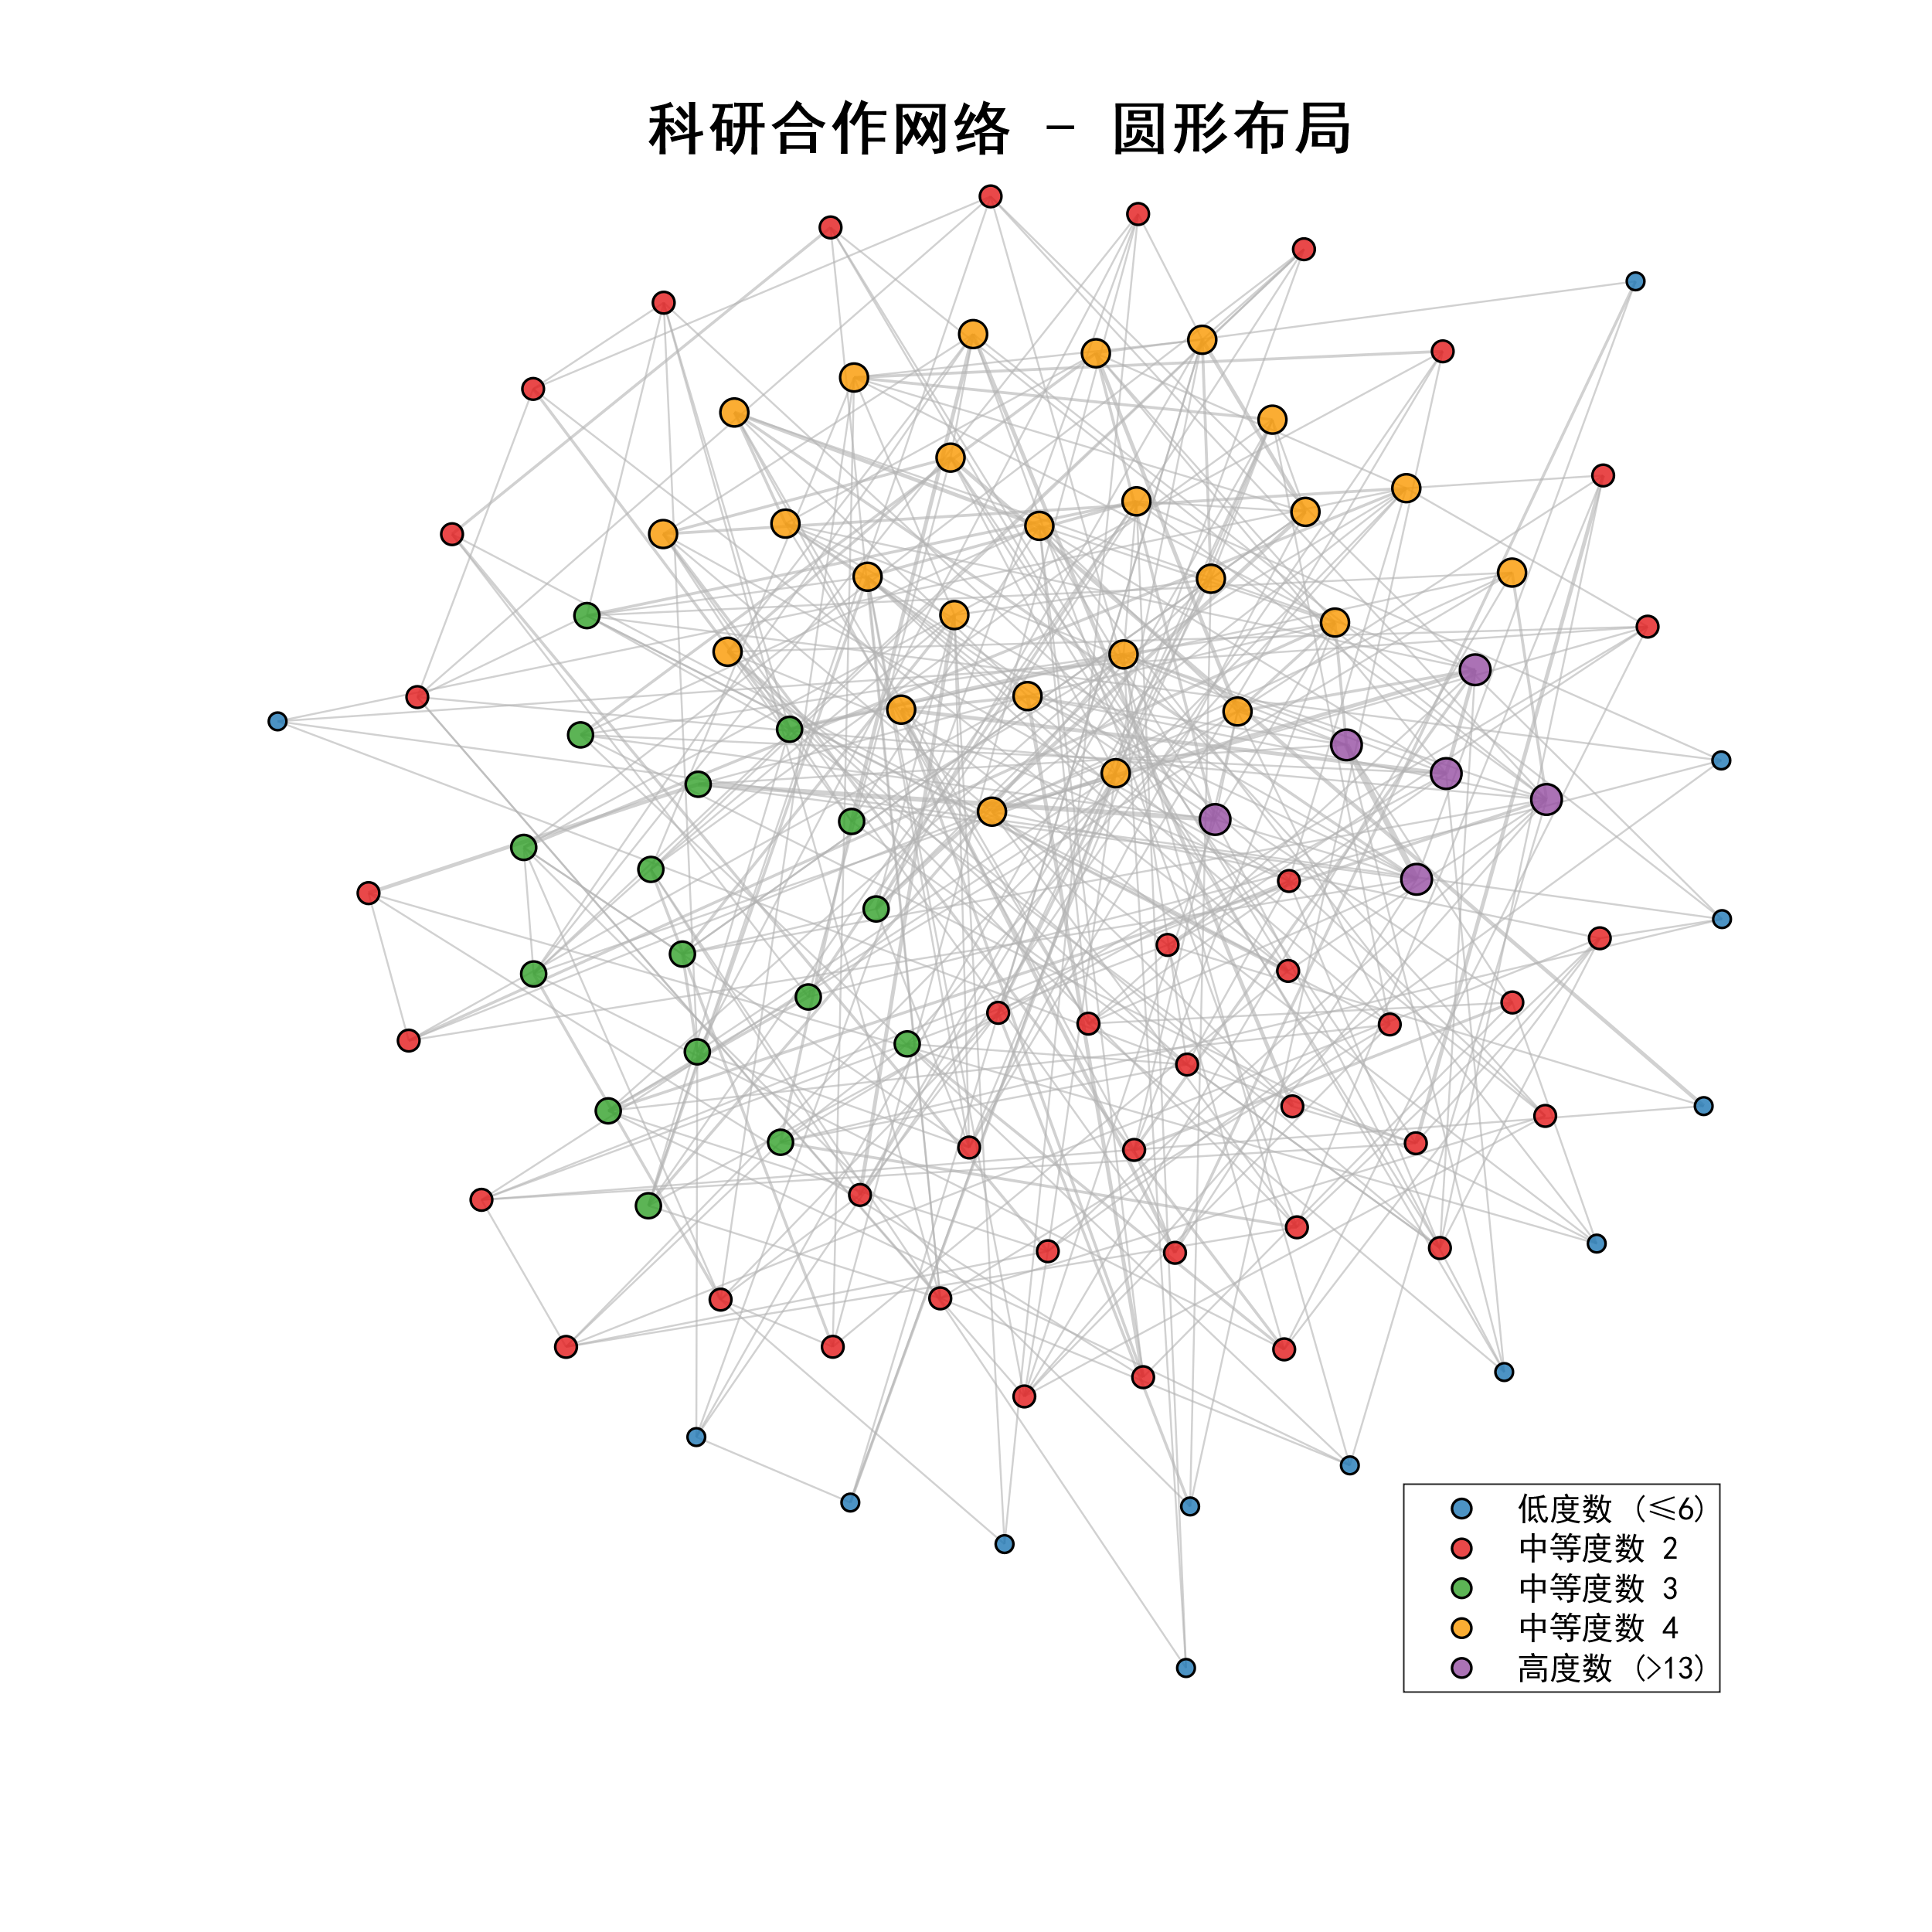
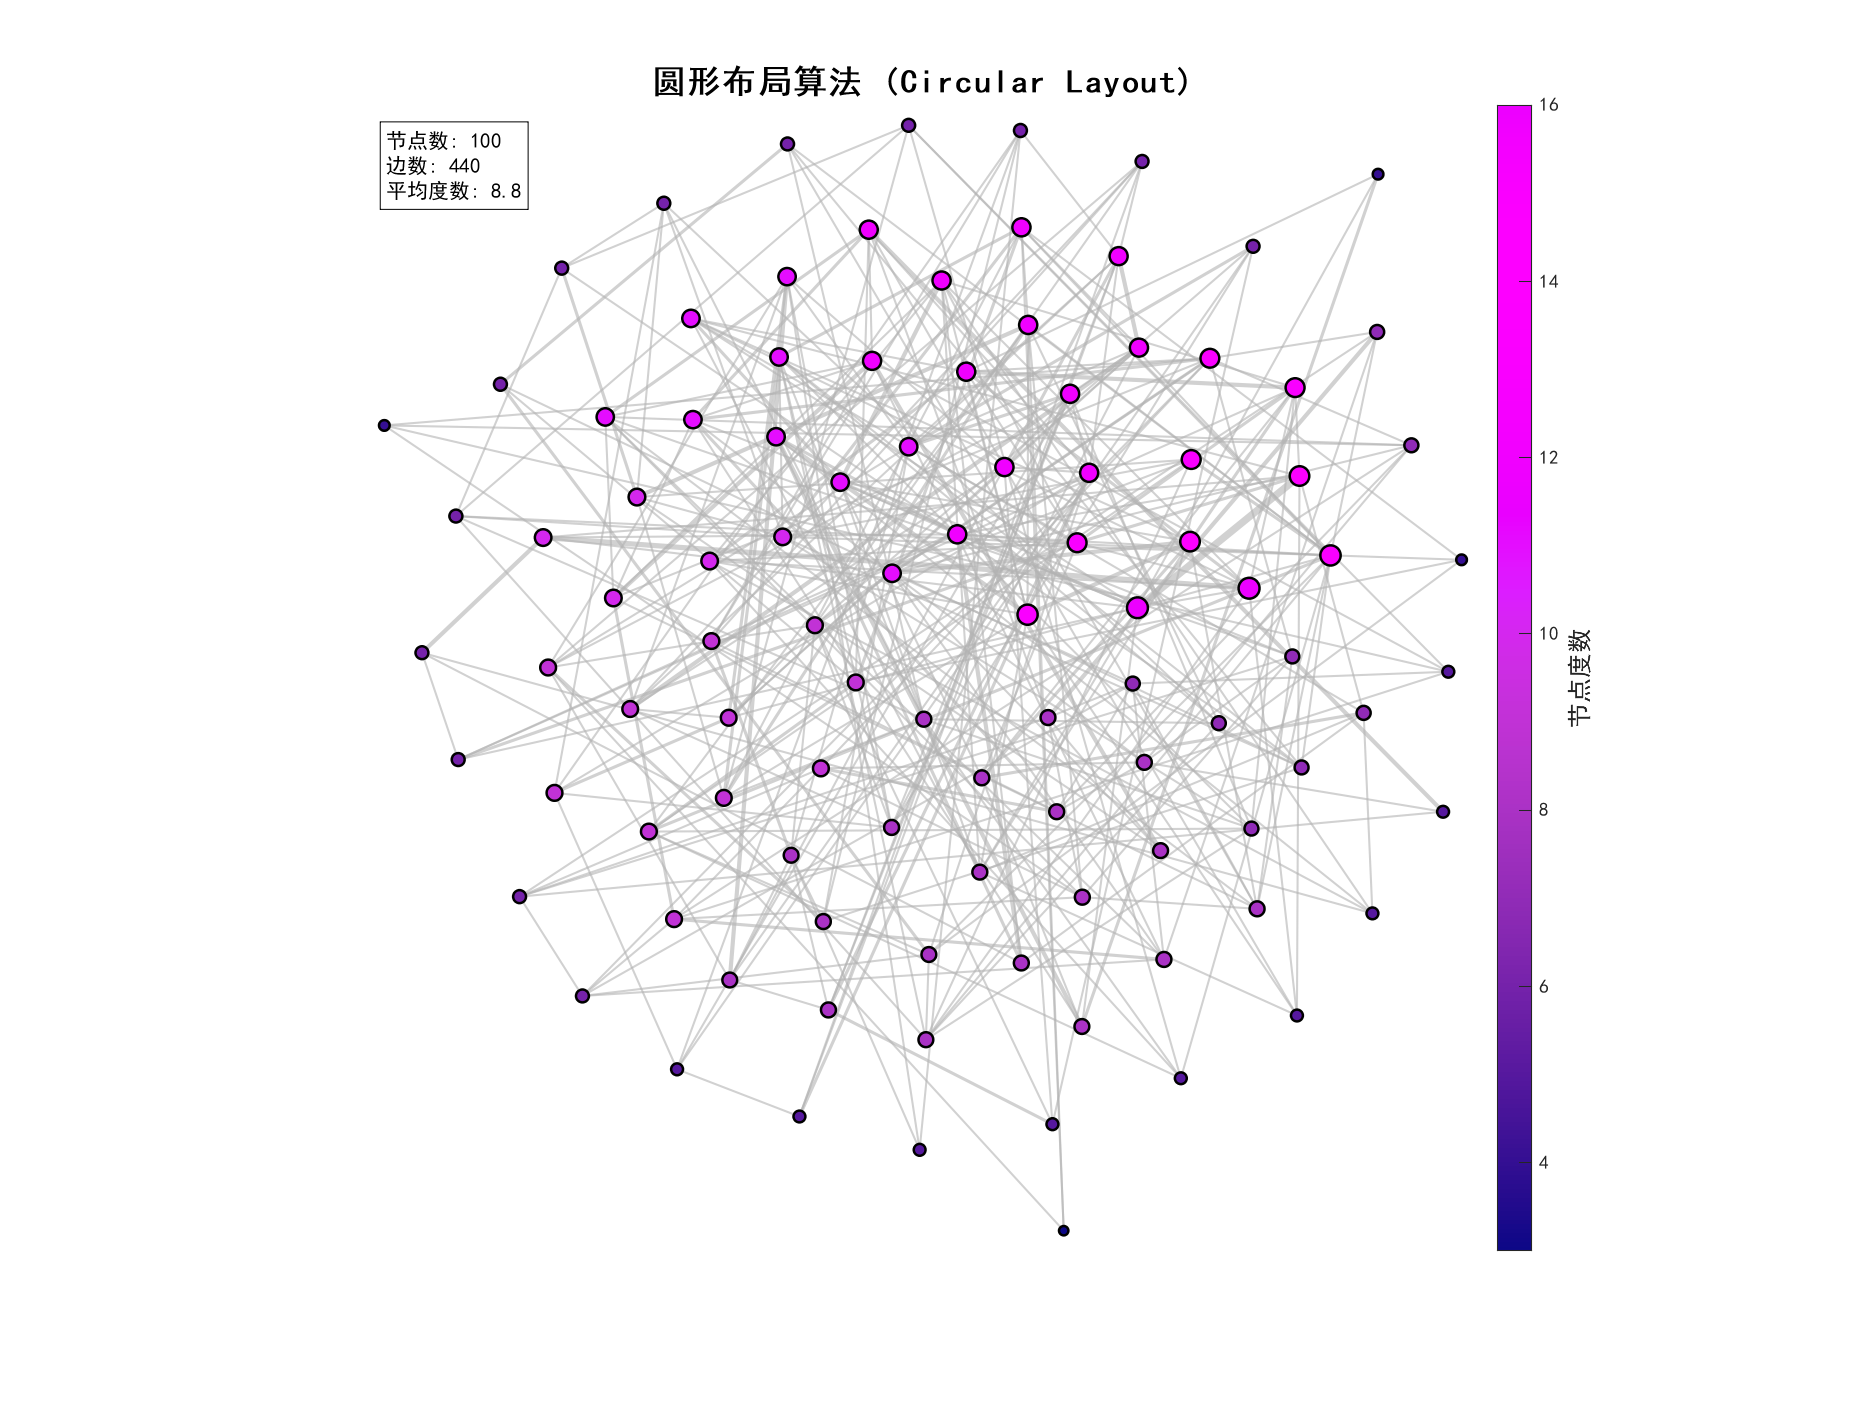
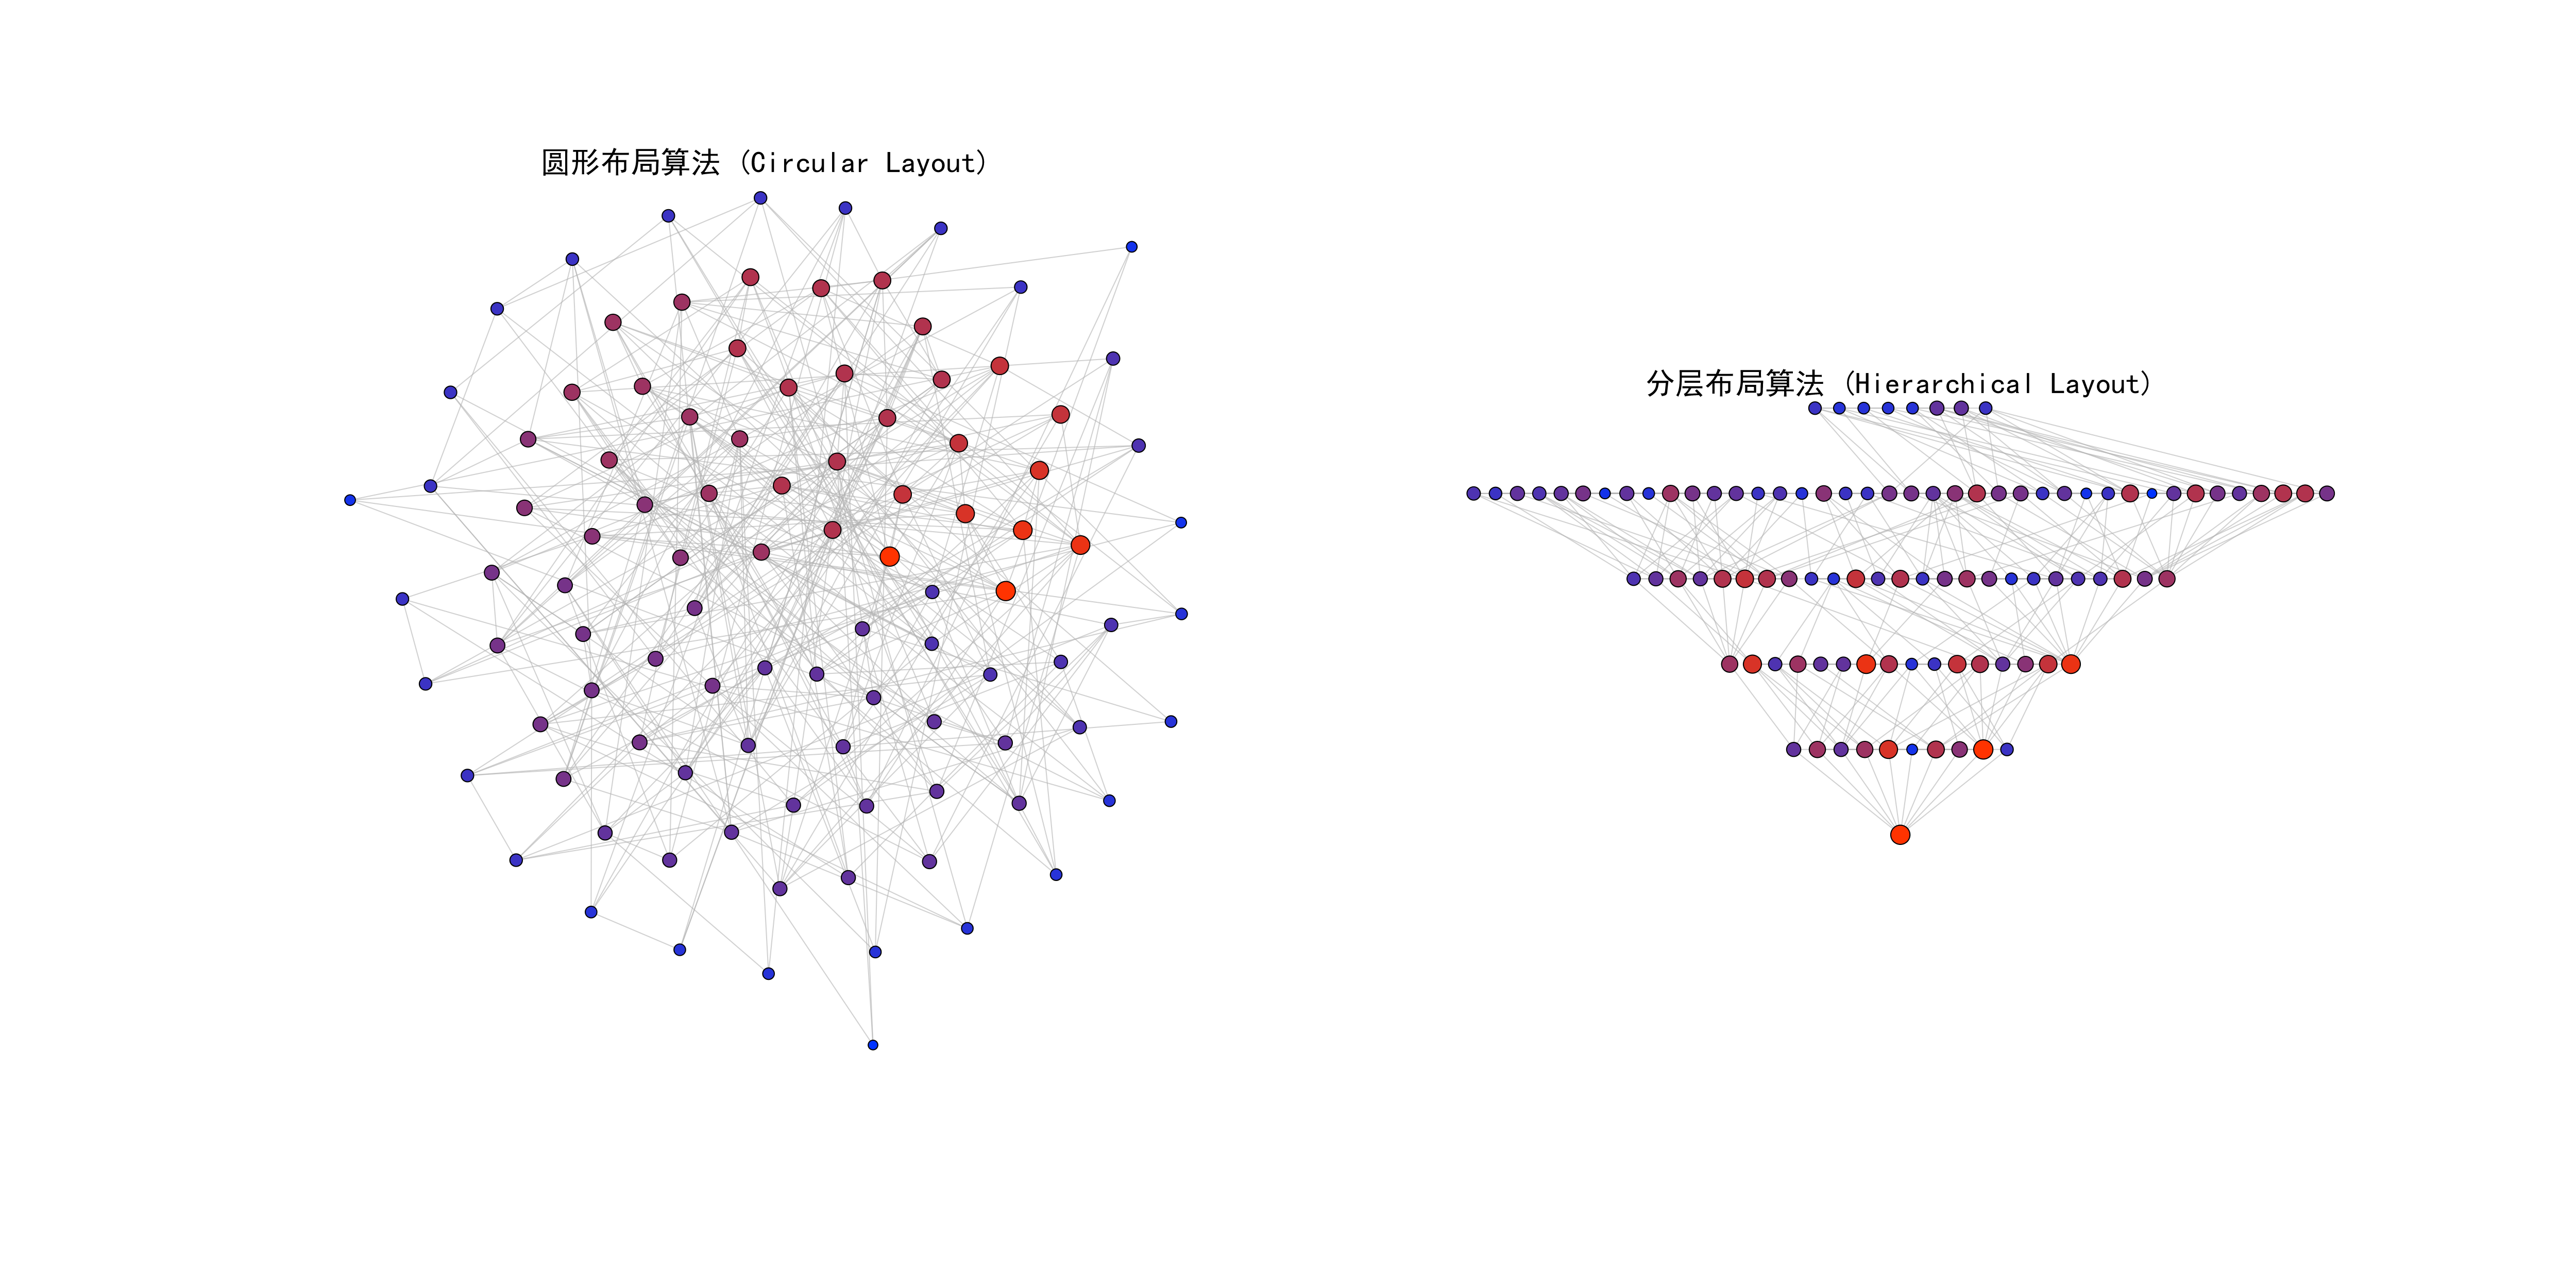
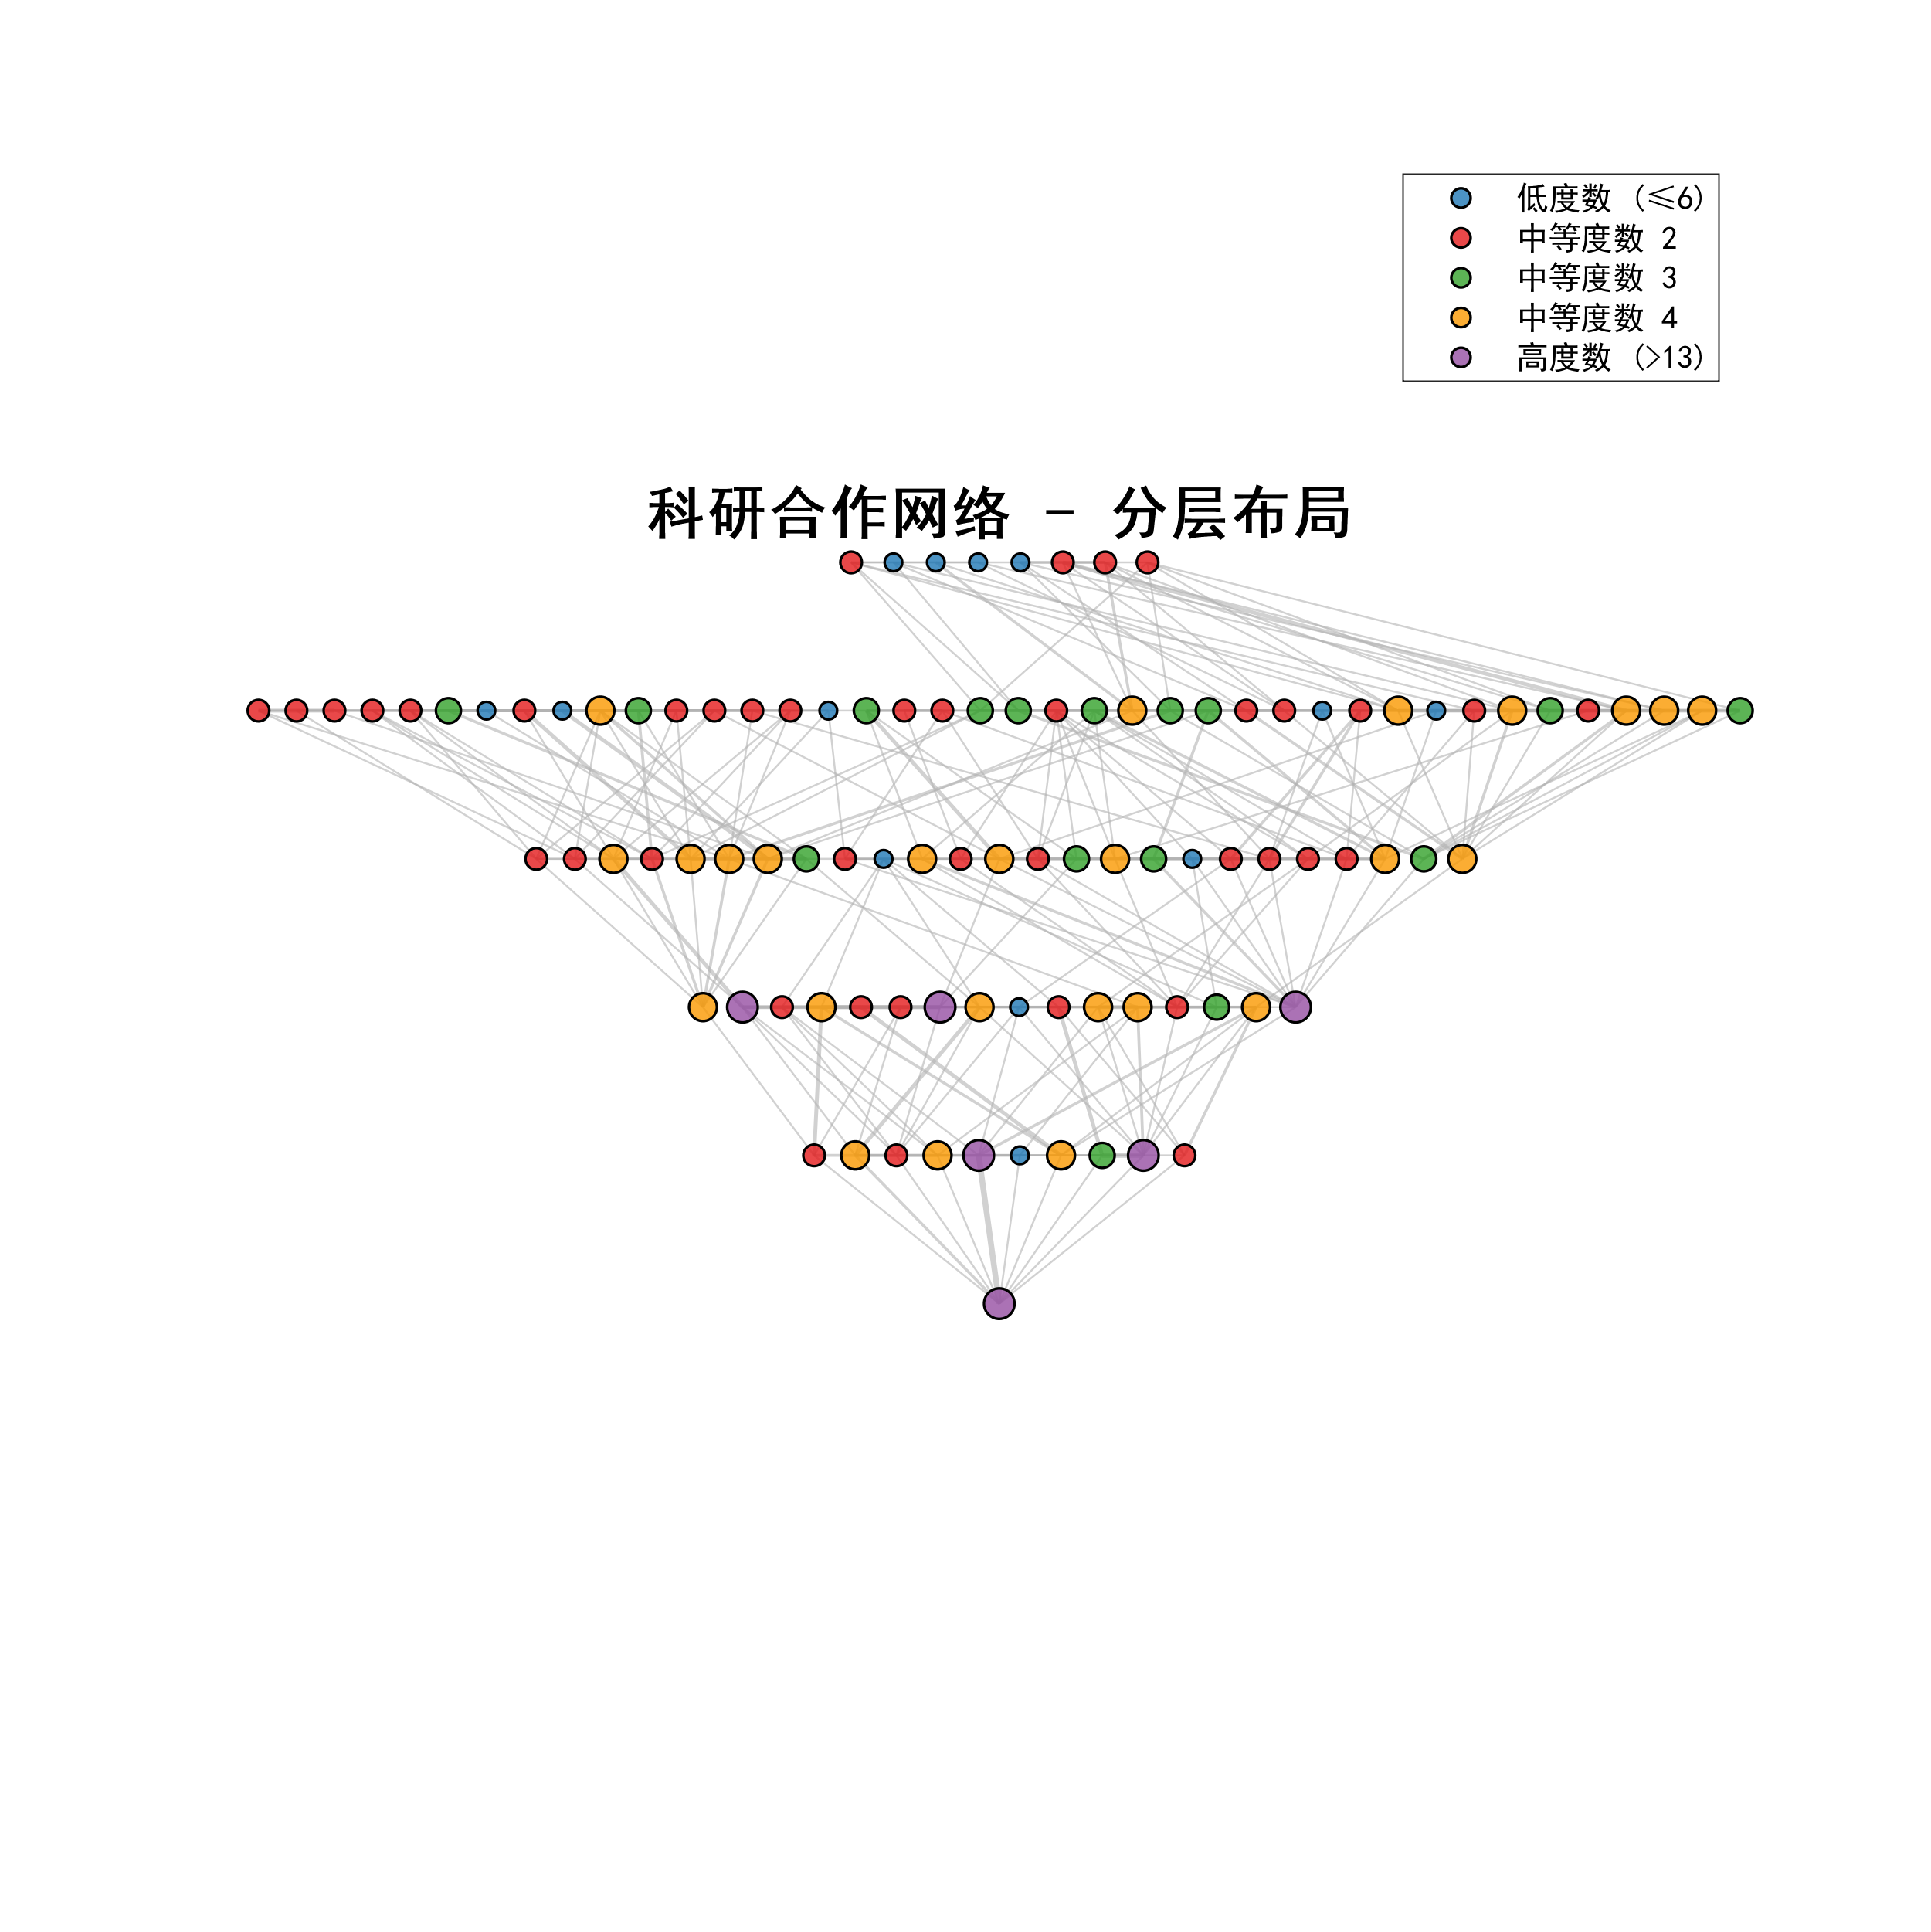
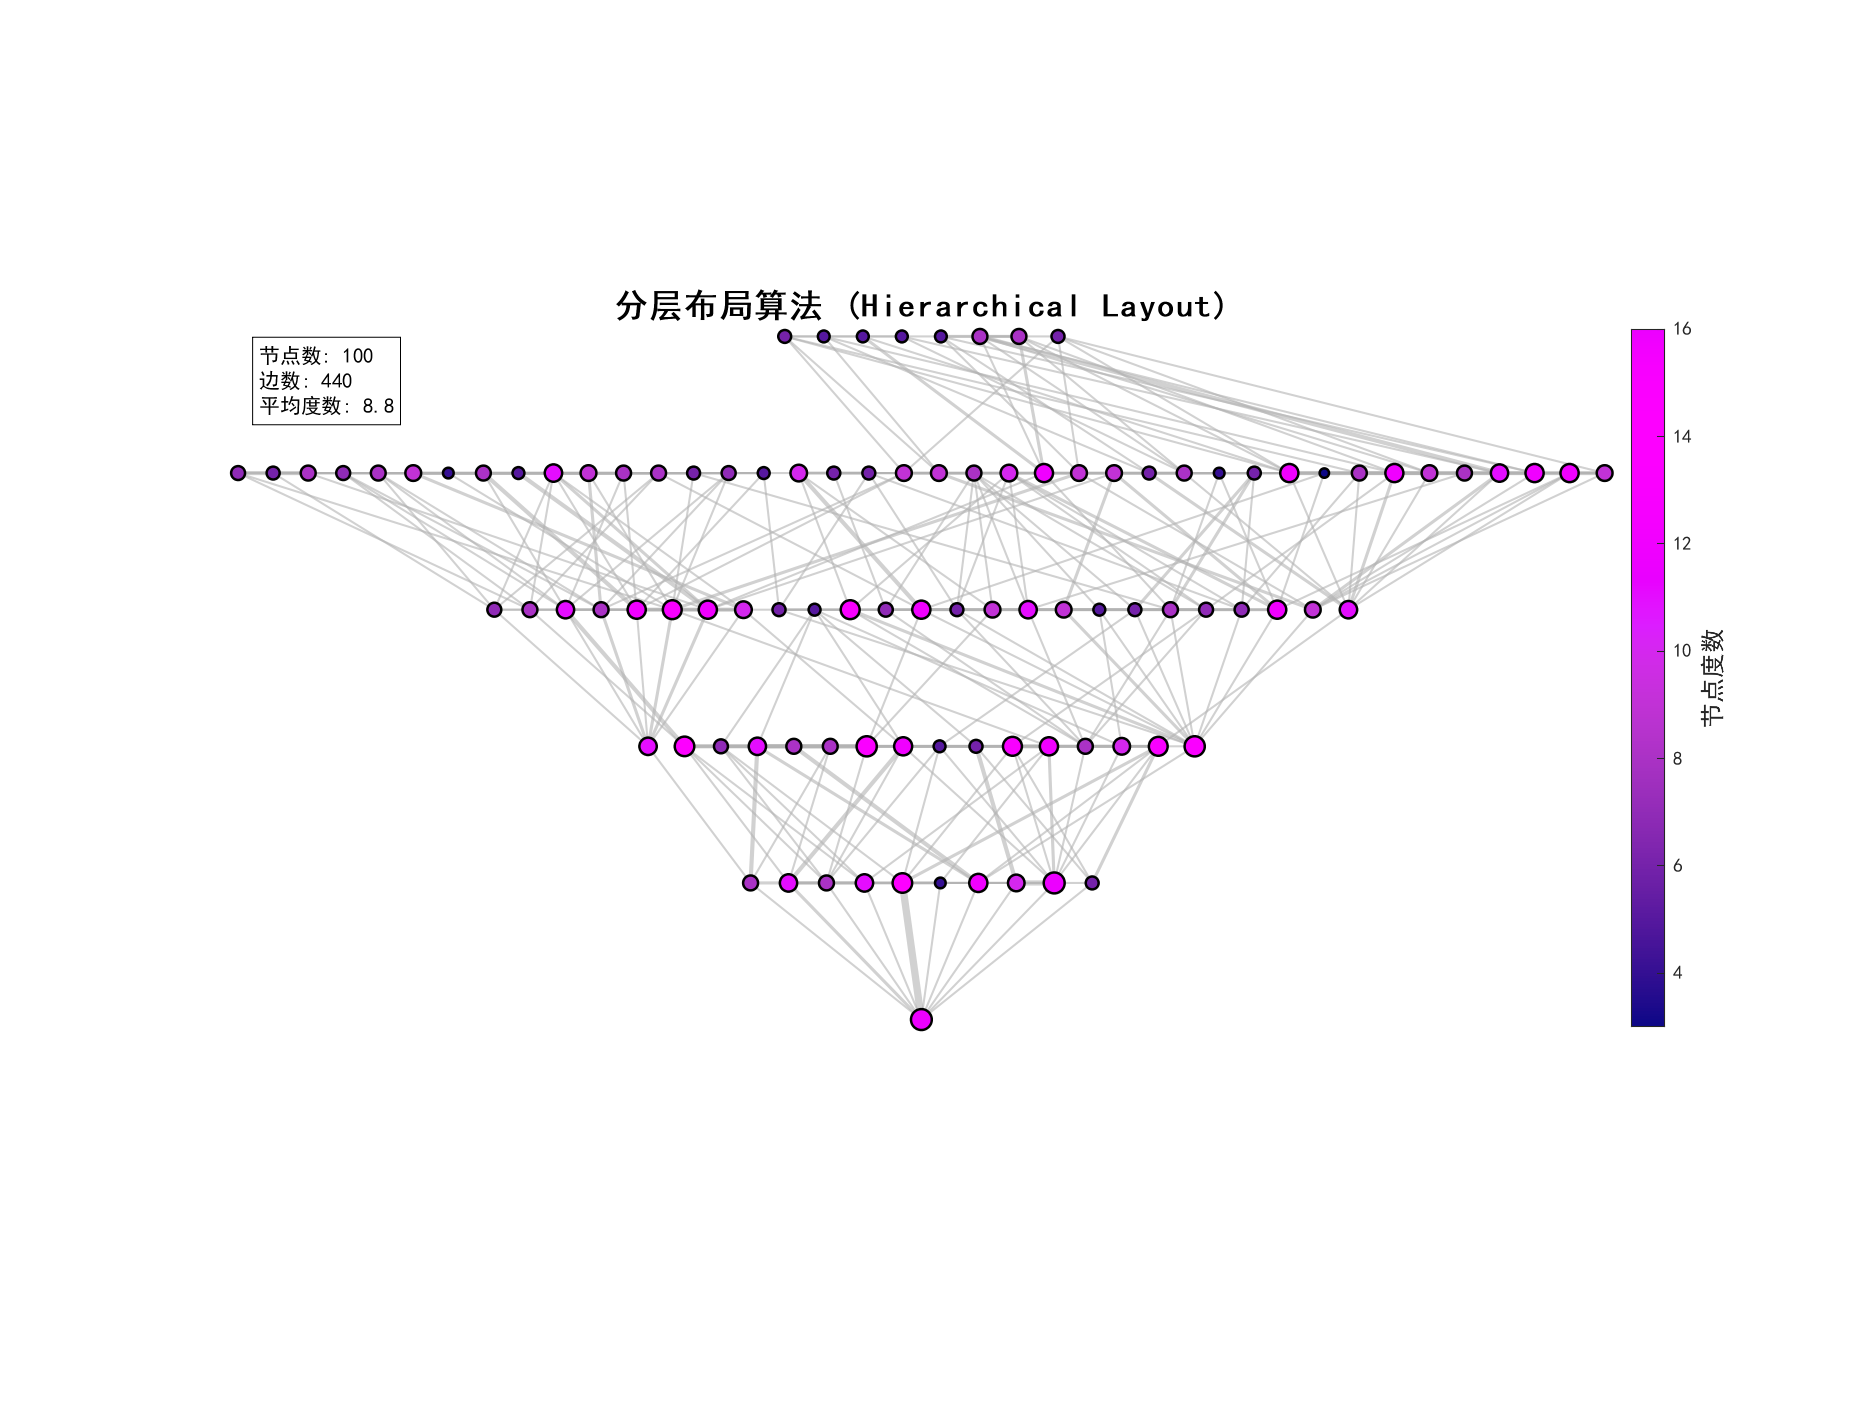
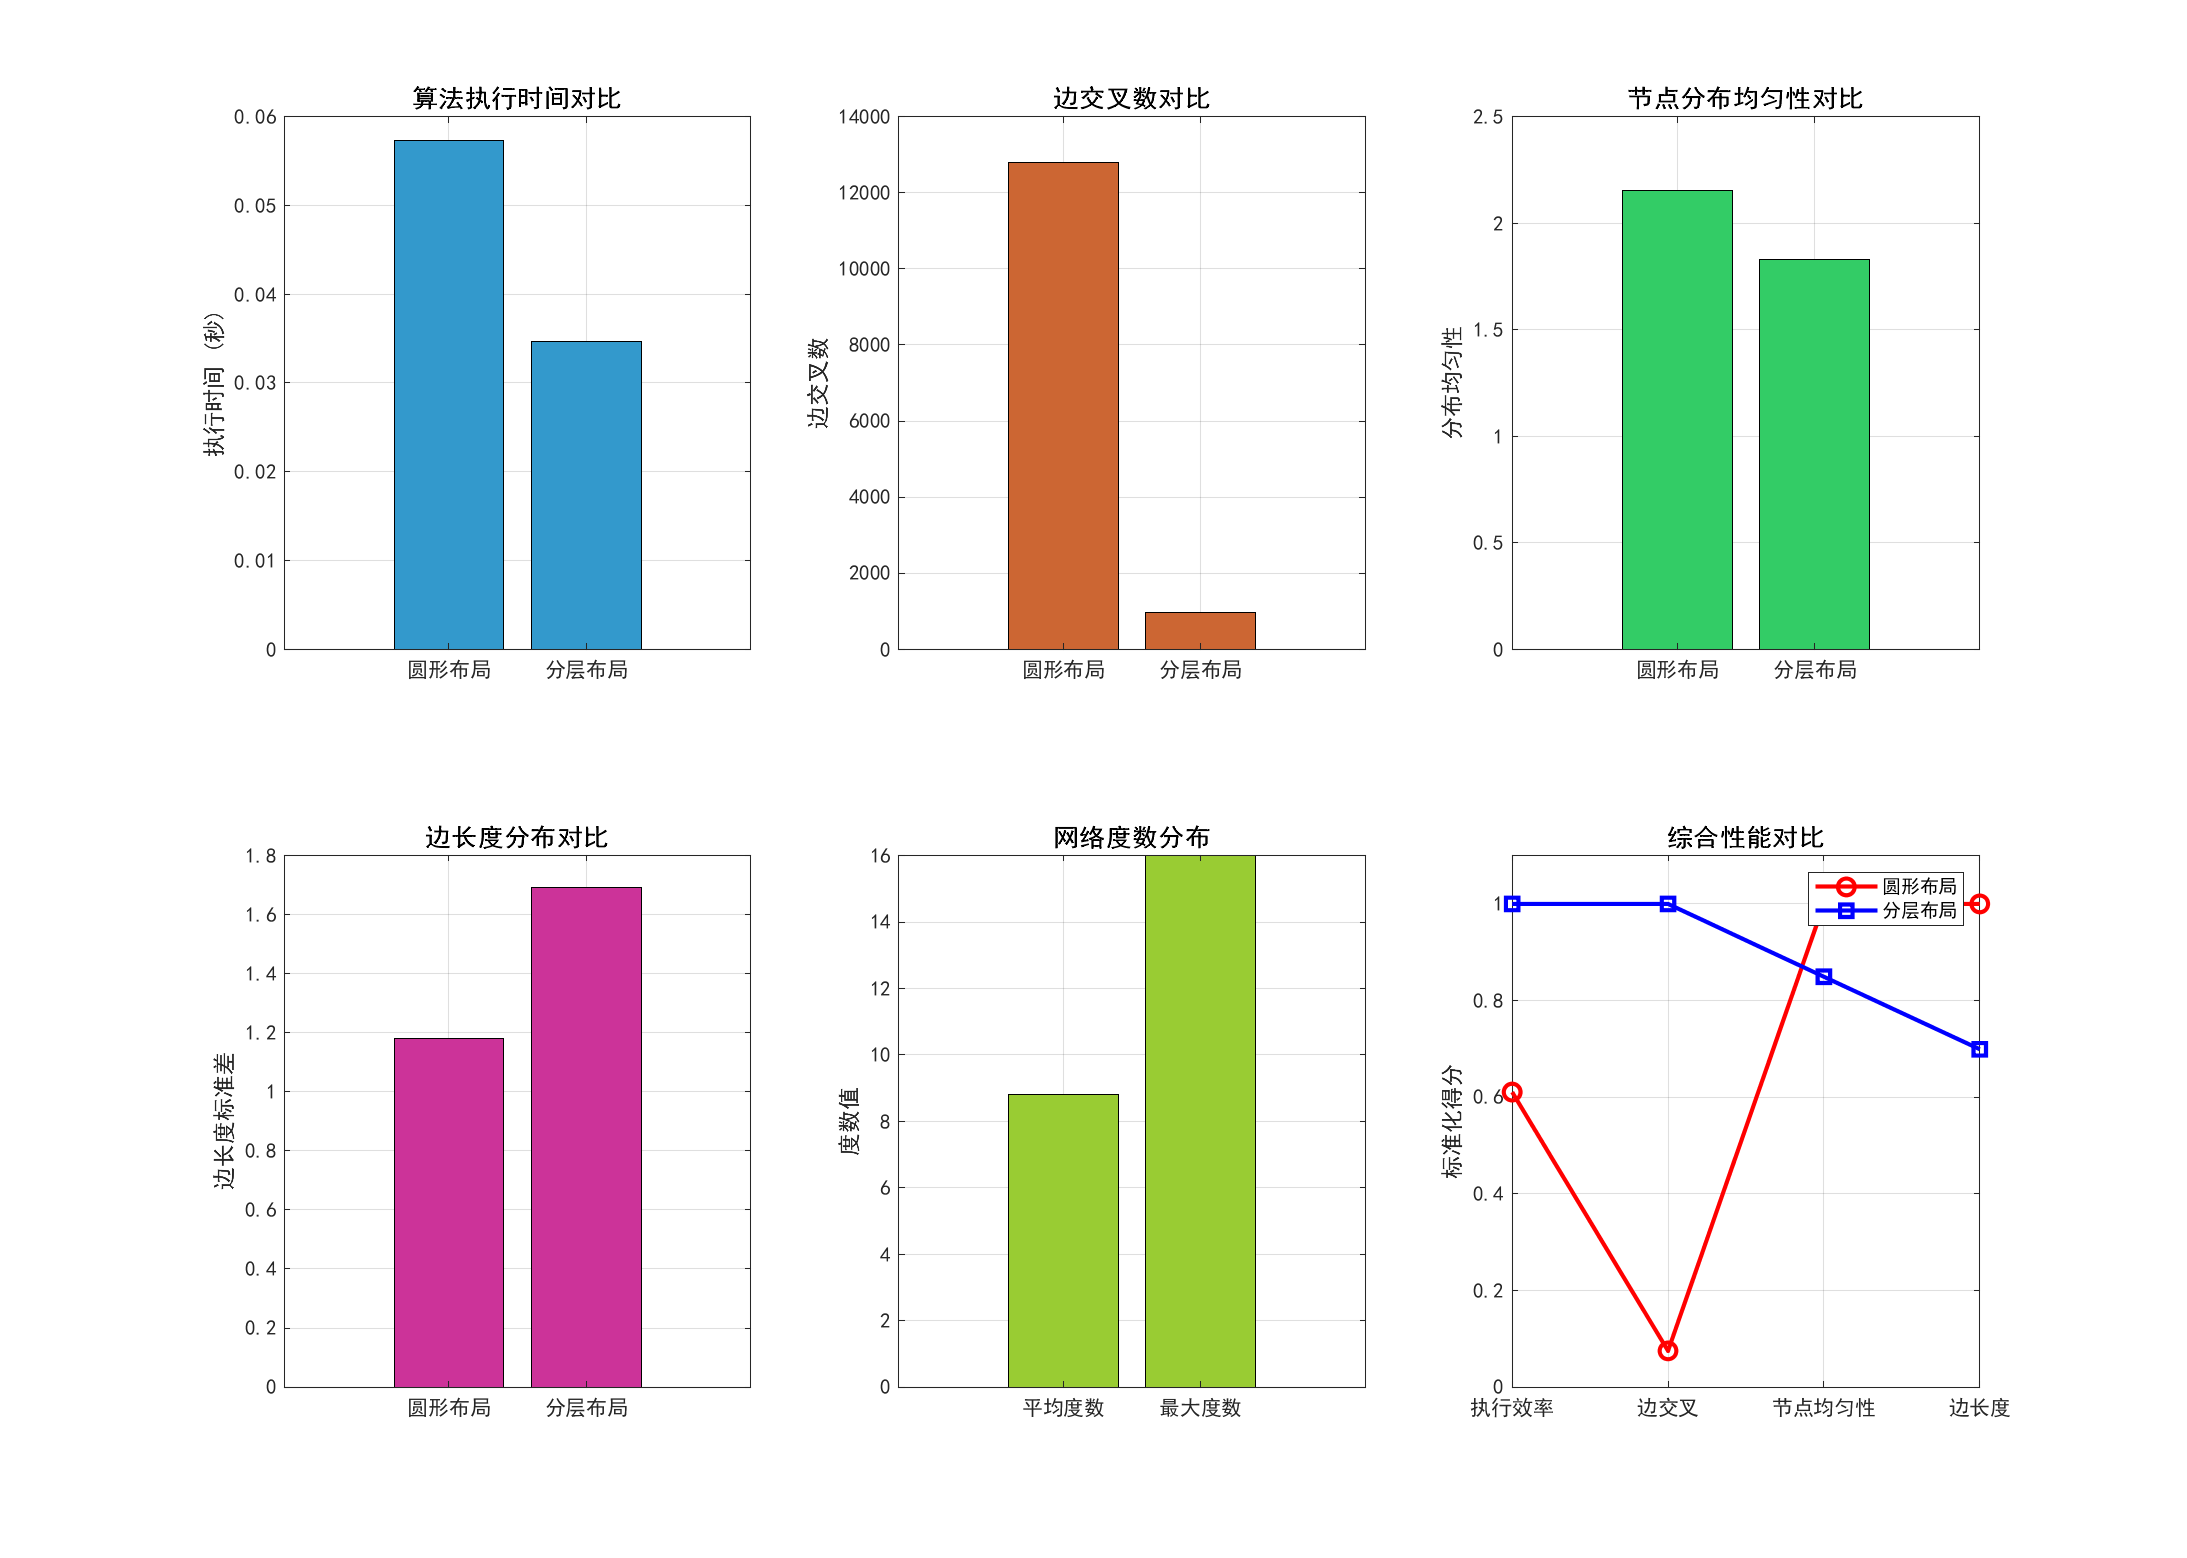
结果报告:
=== 图布局算法分析报告 ===
网络基本信息:
节点数: 100
边数: 440
平均度数: 8.80
最大度数: 16
算法性能对比:
圆形布局:
执行时间: 0.0574 秒
时间复杂度: O(n²)
空间复杂度: O(n)
边交叉数: 12791
节点分布均匀性: 2.1537
边长度标准差: 1.1819
分层布局:
执行时间: 0.0346 秒
时间复杂度: O(n²+m)
空间复杂度: O(n+m)
边交叉数: 958
节点分布均匀性: 1.8290
边长度标准差: 1.6909
结论:
分层布局在执行效率上优于圆形布局
分层布局在减少边交叉方面优于圆形布局
论文:


DAMO开发者矩阵,由阿里巴巴达摩院和中国互联网协会联合发起,致力于探讨最前沿的技术趋势与应用成果,搭建高质量的交流与分享平台,推动技术创新与产业应用链接,围绕“人工智能与新型计算”构建开放共享的开发者生态。
更多推荐
 已为社区贡献15条内容


所有评论(0)