《统计学习方法》|第二章感知机课后习题|感知机的python实现代码(三种方法)|详细注释
Perceptron() 等效于 SGDClassifier(loss="perceptron", eta0=1, learning_rate="constant", penalty=None)。将输入向量 X 上的每个特征缩放到 [0,1] 或 [- 1,+1], 或将其标准化,使其均值为 0,方差为 1。是时间步长(总共有 n_samples * n_iter 个时间步长0),w = [1.
目录
第二种方法 直接调用sklearn.linear_model 中的 Perception类
第三种方法 直接调用sklearn.linear_model 中的 SGDClassifier
2、拟合出的线性模型参数存放于:coef_(即weight) 和intercept_ (即bias)
第一种方法 自写感知机类
这篇有李航老师《统计学习方法》详细的课后习题 ,本人小白在他的代码上补充了注释,主要是我不理解的地方,欢迎交流
代码如下:
'''
感知机perception习题2.2 python实现
自写perception类
参考链接:https://datawhalechina.github.io/statistical-learning-method-solutions-manual/#/part01/chapter02/ch02
'''

import numpy as np
from matplotlib import pyplot as plt


# %matplotlib matplotlib_inline   不是在jupyter中运行的 因此注释了这句


class Perceptron:
    def __init__(self, X, Y, lr=0.001, plot=True):
        """
        初始化感知机
        :param X: 特征向量
        :param Y: 类别
        :param lr: 学习率
        :param plot: 是否绘制图形
        """
        self.X = X
        self.Y = Y
        self.lr = lr
        self.plot = plot
        if plot:
            # 初始化画图 先实例化 再打开交互模式
            self.__model_plot = self._ModelPlot(self.X, self.Y)
            self.__model_plot.open_in()

    def fit(self):
        # (1)初始化weight, b
        weight = np.zeros(self.X.shape[1])  # 特征维数
        b = 0
        # 训练次数
        train_counts = 0
        # 分类错误标识
        mistake_flag = True
        while mistake_flag:
            # 开始前,将mistake_flag设置为False,用于判断本次循环是否有分类错误
            mistake_flag = False
            # (2)从训练集中选取x,y
            for index in range(self.X.shape[0]):  # X.shape[0] 样本数
                if self.plot:
                    self.__model_plot.plot(weight, b, train_counts)
                # 损失函数
                loss = self.Y[index] * (weight @ self.X[index] + b)  # @内积
                # (3)如果损失函数小于0,则该点是误分类点
                if loss <= 0:
                    # 更新weight, b
                    weight += self.lr * self.Y[index] * self.X[index]
                    b += self.lr * self.Y[index]
                    # 训练次数加1
                    train_counts += 1
                    print("Epoch {}, weight = {}, b = {}, formula: {}".format(
                        train_counts, weight, b, self.__model_plot.formula(weight, b)))
                    # 本次循环有误分类点(即分类错误),置为True
                    mistake_flag = True
                    break  # 更新一次后跳出for循环,重新判断所有样本点是否有被误分类
        if self.plot:
            # 关闭交互模式 并显示图像
            self.__model_plot.close()
        # (4)直至训练集中没有误分类点
        return weight, b

    class _ModelPlot:
        def __init__(self, X, Y):  # 初始化参数 X为输入数据 Y为类别
            self.X = X
            self.Y = Y

        # staticmethod用于修饰类中的方法,使其可以在不创建类实例的情况下调用方法
        @staticmethod
        def open_in():
            # 打开交互模式,用于展示动态交互图
            plt.ion()

        @staticmethod
        def close():
            # 关闭交互模式,并显示最终的图形
            plt.ioff()  # 没有使用ioff()关闭的话,则图像会一闪而过,并不会常留
            plt.show()

        def plot(self, weight, b, epoch):
            plt.cla()  # 清除axes,即当前 figure 中的活动的axes,但其他axes保持不变。
            # x轴表示x1
            plt.xlim(0, np.max(self.X.T[0]) + 1)  # .T 表示转置
            # y轴表示x2
            plt.ylim(0, np.max(self.X.T[1]) + 1)
            # 画出散点图,并添加图示
            scatter = plt.scatter(self.X.T[0], self.X.T[1], c=self.Y)  # s参数指定散点的大小 c参数指定color,即颜色
            plt.legend(*scatter.legend_elements())  # 按照散点图中标记(比如不同颜色代表什么 不同大小代表什么) 生成legend
            # 画出拟合的平面
            if True in list(weight == 0):
                plt.plot(0, 0)
            else:
                # 取出两个点 两点确定一条直线
                x1 = -b / weight[0]  # 超平面与x轴的截距
                x2 = -b / weight[1]  # 超平面与y轴的截距
                # 画出分离超平面
                plt.plot([x1, 0], [0, x2])  # 根据(x1,0)与(0,x2)绘出超平面
                # 绘制公式
                text = self.formula(weight, b)
                plt.text(0.3, x2 - 0.1, text)
            plt.title('Epoch %d' % epoch)
            plt.pause(0.01)

        @staticmethod
        def formula(weight, b):
            # %d ,相当于占位符,就是告诉python,我这里需要填充1一个数字;有几个%d就需要填充几个数字
            text = 'x1 ' if weight[0] == 1 else '%d*x1 ' % weight[0]  # w=(w1,w2),如果w1为1,则text=x1;否则text=w1*x1
            text += '+ x2 ' if weight[1] == 1 else ('+ %d*x2 ' % weight[1] if weight[1] > 0
                                                    else '- %d*x2 ' % -weight[1])
            text += '= 0' if b == 0 else ('+ %d = 0' % b if b > 0 else '- %d = 0' % -b)
            return text

            # 上面的写法个人感觉不是很好读 我一般习惯下面这样写
            # if weight[0]==1:
            #     text = 'x1'
            # else:
            #     text = '{}*x1'.format(weight[0])
            #
            # if weight[1]==1:
            #     text +='+x2'
            # elif weight[1]<0:
            #     text +='-{}*x2'.format(-weight[1])
            # else:
            #     text +='+{}*x2'.format(weight[1])
            #
            # if b==0:
            #     text += '=0'
            # elif b<0:
            #     text += '-{}=0'.format(-b)
            # else:
            #     text += '+{}=0'.format(b)
            # return text

# 创建数据
X = np.array([[3, 3], [4, 3], [1, 1]])
Y = np.array([1, 1, -1])

# 实例化
model = Perceptron(X, Y, lr=1)
# 训练
weight, b = model.fit()
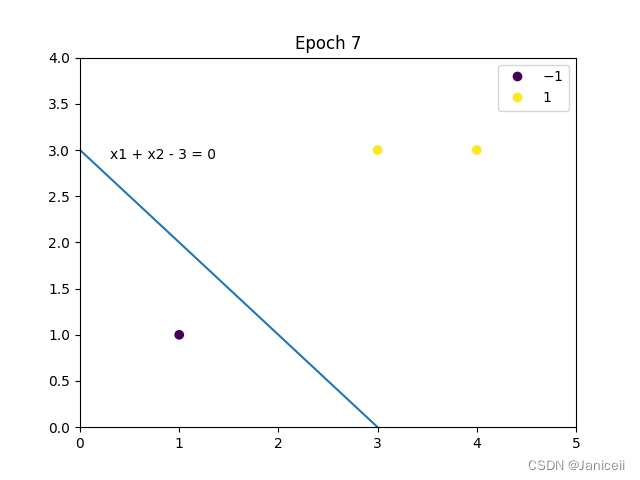
结果:与书上例题2.1结果相同
Epoch 1, weight = [3. 3.], b = 1, formula: 3*x1 + 3*x2 + 1 = 0
Epoch 2, weight = [2. 2.], b = 0, formula: 2*x1 + 2*x2 = 0
Epoch 3, weight = [1. 1.], b = -1, formula: x1 + x2 - 1 = 0
Epoch 4, weight = [0. 0.], b = -2, formula: 0*x1 - 0*x2 - 2 = 0
Epoch 5, weight = [3. 3.], b = -1, formula: 3*x1 + 3*x2 - 1 = 0
Epoch 6, weight = [2. 2.], b = -2, formula: 2*x1 + 2*x2 - 2 = 0
Epoch 7, weight = [1. 1.], b = -3, formula: x1 + x2 - 3 = 0

第二种方法 直接调用sklearn.linear_model 中的 Perception类
代码如下:
import numpy as np
from matplotlib import pyplot as plt
from sklearn.linear_model import Perceptron
# 输入数据  X: 特征向量 Y: 类别
X = np.array([[3,3],[4,3],[1,1]])
Y = np.array([1,1,-1])

# 训练
model = Perceptron()
model.fit(X, Y)

# 取出最终拟合的weight和bias
weight = model.coef_[0]
b = model.intercept_[0]
print('w = {}'.format(weight), 'b = {}'.format(b))

# 超平面公式
def formula(weight, b):
    # %d ,相当于占位符,就是告诉python,我这里需要填充1一个数字;有几个%d就需要填充几个数字
    text = 'x1 ' if weight[0] == 1 else '%d*x1 ' % weight[0]  # w=(w1,w2),如果w1为1,则text=x1;否则text=w1*x1
    text += '+ x2 ' if weight[1] == 1 else ('+ %d*x2 ' % weight[1] if weight[1] > 0
                                            else '- %d*x2 ' % -weight[1])
    text += '= 0' if b == 0 else ('+ %d = 0' % b if b > 0 else '- %d = 0' % -b)

# 画图
plt.xlim(0, np.max(X.T[0]) + 1)  # .T 表示转置
plt.ylim(0, np.max(X.T[1]) + 1)
# 画出散点图,并添加图示
scatter = plt.scatter(X.T[0], X.T[1], c=Y)  # s参数指定散点的大小 c参数指定color,即颜色
plt.legend(*scatter.legend_elements())  # 按照散点图中标记(比如不同颜色代表什么 不同大小代表什么) 生成legend
# 画出拟合的平面
if True in list(weight == 0):
    plt.plot(0, 0)
else:
    # 取出两个点 两点确定一条直线
    x1 = -b / weight[0]  # 超平面与x轴的截距
    x2 = -b / weight[1]  # 超平面与y轴的截距
    # 画出分离超平面
    plt.plot([x1, 0], [0, x2])  # 根据(x1,0)与(0,x2)绘出超平面
    # 绘制公式
    text = formula(weight, b)
    plt.text(0.3, x2 - 0.1, text)
plt.show()
结果:与例题2.1结果不同
w = [1. 0.] b = -2.0 ,即超平面为x1-2=0

因为w2=0,所以超平面无法绘出
第三种方法 直接调用sklearn.linear_model 中的 SGDClassifier
类
Perceptron() 等效于 SGDClassifier(loss="perceptron", eta0=1, learning_rate="constant", penalty=None) 。
代码如下:
import numpy as np
from matplotlib import pyplot as plt
from sklearn.linear_model import SGDClassifier

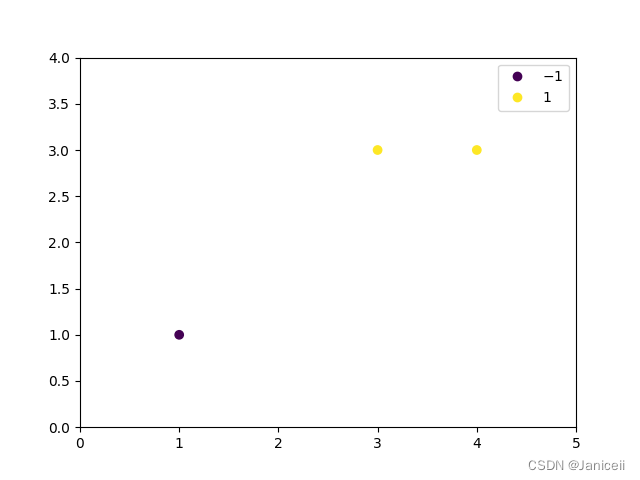
X = np.array([[3, 3], [4, 3], [1, 1]])
Y = np.array([1, 1, -1])

model = SGDClassifier()
model.fit(X, Y)

# 取出最终拟合的weight和bias
weight = model.coef_[0]
b = model.intercept_[0]
print('w = {}'.format(weight), 'b = {}'.format(b))

# 超平面公式
def formula(weight, b):
    # %d ,相当于占位符,就是告诉python,我这里需要填充1一个数字;有几个%d就需要填充几个数字
    text = 'x1 ' if weight[0] == 1 else '%d*x1 ' % weight[0]  # w=(w1,w2),如果w1为1,则text=x1;否则text=w1*x1
    text += '+ x2 ' if weight[1] == 1 else ('+ %d*x2 ' % weight[1] if weight[1] > 0
                                            else '- %d*x2 ' % -weight[1])
    text += '= 0' if b == 0 else ('+ %d = 0' % b if b > 0 else '- %d = 0' % -b)

# 画图
plt.xlim(0, np.max(X.T[0]) + 1)  # .T 表示转置
plt.ylim(0, np.max(X.T[1]) + 1)
# 画出散点图,并添加图示
scatter = plt.scatter(X.T[0], X.T[1], c=Y)  # s参数指定散点的大小 c参数指定color,即颜色
plt.legend(*scatter.legend_elements())  # 按照散点图中标记(比如不同颜色代表什么 不同大小代表什么) 生成legend
# 画出拟合的平面
if True in list(weight == 0):
    plt.plot(0, 0)
else:
    # 取出两个点 两点确定一条直线
    x1 = -b / weight[0]  # 超平面与x轴的截距
    x2 = -b / weight[1]  # 超平面与y轴的截距
    # 画出分离超平面
    plt.plot([x1, 0], [0, x2])  # 根据(x1,0)与(0,x2)绘出超平面
    # 绘制公式
    text = formula(weight, b)
    plt.text(0.3, x2 - 0.1, text)
plt.show()
结果:
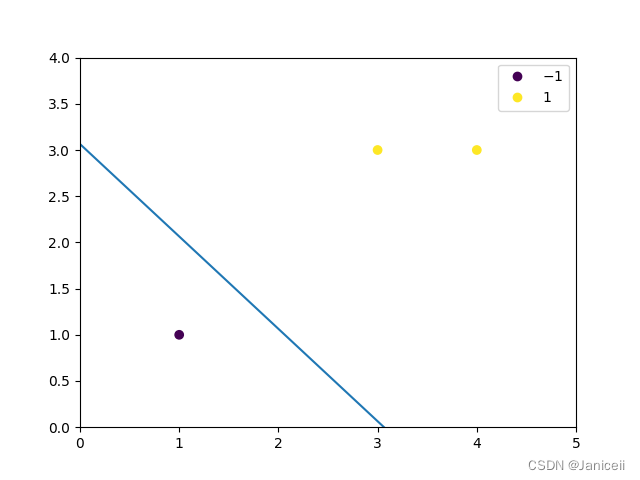
w = [9.68992248 9.68992248] b = -29.693250595661755
即 9.68992248x1+ 9.68992248x2 - 29.693250595661755 = 0
约一约之后与例题差不多

SGD随机梯度下降
1、预测:model.predict()
2、拟合出的线性模型参数存放于:coef_(即weight) 和intercept_ (即bias)
3、归一化数据
随机梯度下降法对特征归一化(feature scaling)很敏感,因此 强烈建议归一化数据 。
将输入向量 X 上的每个特征缩放到 [0,1] 或 [- 1,+1], 或将其标准化,使其均值为 0,方差为 1。
3、learning rate 如何修改?
- learning_rate:字符串,可选的。学习速率的策略
- ‘constant’:
- ‘optimal’:
,默认值
- ‘invscaling’:
,其中
和
是用户通过
和
分别选择的超参数。
- ‘constant’:
默认学习率设置方案( learning_rate='optimal' )的具体计算公式为:
其中,是时间步长(总共有 n_samples * n_iter 个时间步长0),
是由 Léon Bottou 提出的启发式算法决定的。

DAMO开发者矩阵,由阿里巴巴达摩院和中国互联网协会联合发起,致力于探讨最前沿的技术趋势与应用成果,搭建高质量的交流与分享平台,推动技术创新与产业应用链接,围绕“人工智能与新型计算”构建开放共享的开发者生态。
更多推荐
 已为社区贡献1条内容
 https://datawhalechina.github.io/statistical-learning-method-solutions-manual/#/part01/chapter02/ch02


所有评论(0)