

数据分析中假设检验
Using Inferential Statistics, we learned how to analyze the sample data and make inferences about the population mean and other population data. However, we could not confirm the conclusions we made about the population data. That is why the concept of Hypothesis Testing comes into the picture.
使用推断统计,我们学习了如何分析样本数据以及如何推断总体平均值和其他总体数据。 但是,我们无法确认关于人口数据得出的结论。 这就是假设检验概念出现的原因。
You can find out more about Inferential Statistics and Central Limit Theorem in my previous articles.
假设 (Hypothesis)
Using Inferential, Descriptive, and Exploratory analysis, we performed some research on the population sample. We derived some insights from the sample and made claims about the entire population. These are just the claims; they are not exactly true. This type of claim or assumption is called Hypothesis.
使用推论,描述性和探索性分析,我们对总体样本进行了一些研究。 我们从样本中得出了一些见解,并对整个人群提出了主张。 这些仅仅是要求; 他们并不完全正确。 这种类型的主张或假设称为假设。
假设检验 (Hypothesis Testing)
There are some ways or tricks to check the Hypothesis, and if the hypothesis is correct, then we apply it to the whole population. This process is known as Hypothesis Testing. The final goal is whether there is enough evidence that the hypothesis is correct. As we have already seen in Inferential Statistics and Central Limit Theorem(CLT), we will work with sample data and confirm our assumption about the population in Hypothesis Testing.
有一些方法或技巧可以检查假设,如果假设是正确的,那么我们将其应用于整个人群。 此过程称为假设检验。 最终目标是是否有足够的证据证明该假设是正确的。 正如我们在推论统计和中心极限定理(CLT)中已经看到的那样,我们将使用样本数据并在假设检验中确认我们对总体的假设。
In Hypothesis Testing, we formulate two hypotheses:
在假设检验中,我们提出两个假设:
-
Null Hypothesis (H₀): Status quo
零假设(H₀) :现状
-
Alternate Hypothesis (H₁): It challenges the status quo
替代假设(H₁) :它挑战现状
零假设(H₀) (Null Hypothesis (H₀))
The null hypothesis is the prevailing belief about a population. It states that there is no change or no difference in the situation or the claim. H₀ denotes the null hypothesis.
零假设是关于人口的普遍信念。 它指出,情况或索赔没有变化或没有差异。 H₀表示原假设。
替代假设(H₁) (Alternate Hypothesis (H₁))
The alternate hypothesis is the claim that opposes the null hypothesis. H₁ denotes an alternate hypothesis.
替代假设是反对原假设的主张。 H₁表示另一种假设。
For Example, in a criminal trial, the jury has to decide whether the defendant is innocent or guilty for a case. Here the null hypothesis is, the defendant is innocent just like before the charges. The alternate hypothesis is the defendant is guilty, and the prosecutor would try to prove this.
例如,在刑事审判中,陪审团必须确定被告是否无罪或有罪。 在这里,零假设是,被告就像被指控前一样是无辜的。 另一种假设是被告有罪,检察官将试图证明这一点。
假设检验的结果 (The outcome of Hypothesis Testing)
In hypothesis testing, we reject the null hypothesis if there is sufficient evidence to support the alternate hypothesis. If there is no sufficient evidence for the alternate hypothesis, we fail to reject the null hypothesis. That is how we make claims. In any case, we should never say that we “accept” the null hypothesis. Either we reject, or we fail to reject the null hypothesis, that’s it.
在假设检验中,如果有足够的证据支持替代假设,我们将拒绝原假设。 如果没有足够的证据支持替代假设,那么我们将无法拒绝原假设。 这就是我们提出索赔的方式。 无论如何,我们永远不应该说我们“接受”原假设。 我们要么拒绝,要么我们不能拒绝零假设,就是这样。
Example:
例:
If a company has 30000 employees and claims that it takes an average of 35 minutes for the employees to reach the office daily.
如果一家公司有30000名员工,并声称员工平均每天需要35分钟才能到达办公室。
Here,The Null Hypothesis(H₀): Average time for employees = 35 minutesThe Alternate Hypothesis(H₁): Average time for employees ≠ 35 minutes
此处, 空假设(H₀) :员工平均时间= 35分钟交替假设(H₁) :员工平均时间≠35分钟
制定原假设和替代假设 (Formulating the null and alternate hypothesis)
There is a common rule to formulate the null and alternate hypotheses from the claim statement.
有一条通用规则可从索赔声明中表述零假设和替代假设。
-
The null hypothesis always has the following signs: = OR ≤ OR ≥
零假设总是具有以下标志:= OR≤或≥
-
The alternate hypothesis always has the following signs: ≠ OR < OR >
备用假设始终具有以下符号:≠OR <OR>
Example 1
例子1
A company claimed that its total valuation in August 2022 was at least $20 billion in a statement.
一家公司声称,其在2022年8月的总估值至少为200亿美元。
The Hypothesis for the above claim will be:
上述要求的假设是:
-
Null Hypothesis(H₀): Total Valuation ≥ $20 billion
空假设(H₀):总估值≥200亿美元
-
Alternate Hypothesis(H₁): Total Valuation < $20 billion
替代假设(H₁):总估值<200亿美元
Example 2
例子2
Another company claimed that its total valuation in August 2020 was more than $20 billion.
另一家公司声称,其2020年8月的总估值超过200亿美元。
The Hypothesis for the above claim will be:
上述要求的假设是:
-
Null Hypothesis(H₀): Total Valuation ≤ $20 billion
零假设(H₀):总估值≤200亿美元
-
Alternate Hypothesis(H₁): Total Valuation > $20 billion
替代假设(H₁):总估值> 200亿美元
As we can observe from the two examples above, we cannot decide the status quo or formulate the null hypothesis from the claim statement itself. Null Hypothesis never contains ≠ or < or > signs.
从上面的两个示例可以看出,我们无法根据索赔声明本身来确定现状或制定无效假设。 零假设永远不会包含≠或<或>符号。
The next most crucial step after formulating a null and alternate hypothesis is making a decision to either reject or fail to reject the null hypothesis.
在提出零假设和替代假设之后,下一个最关键的步骤是做出决定 , 决定拒绝还是不拒绝零假设。
做决定 (Make a Decision)
Let’s take an example to understand how to decide whether to reject or fail to reject the null hypothesis.
让我们举一个例子来理解如何决定是否拒绝原假设。
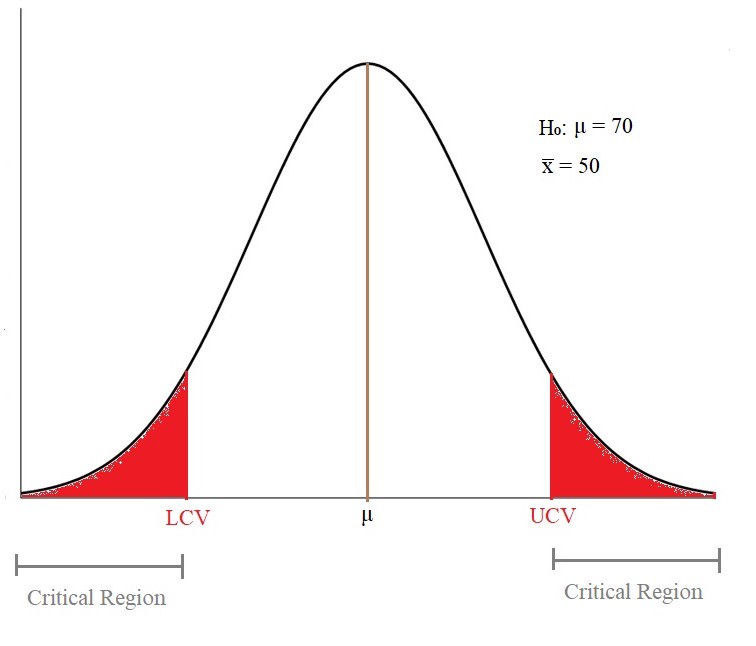
Claim: Average time taken by the employees to reach the office is 70minutes. We have selected some random people from the company and calculated the average as 50 minutes.
索赔:员工到达办公室的平均时间为70分钟。 我们从公司选择了一些随机的人,并计算出平均时间为50分钟。
-
Null Hypothesis(H₀): μ = 70
零假设(H₀): μ= 70
-
Sample Mean: x̅ = 50
样本均值: x = 50
Now, we make a decision based on the distribution graph,
现在,我们根据分布图做出决定,
-
We reject the null hypothesis(H₀) if the sample mean(x̅ ) lies inside the Critical Region.
如果样本均值(x̅)位于关键区域内,我们将拒绝原假设(H₀) 。
-
We fail to reject the null hypothesis(H₀) if the sample mean(x̅ ) lies outside the Critical Region.
如果样本均值(x̅)位于关键区域之外,我们将无法拒绝零假设(H₀) 。
The formulation of the null and alternate hypothesis determines the type of the test and the critical regions’ position in the normal distribution.
零假设和交替假设的表述决定了检验的类型以及关键区域在正态分布中的位置。
There are three types of tests which is based on ‘sign’ in the alternate hypothesis:
在替代假设中,有三种基于“符号”的检验类型 :
- ≠ in H₁ → Two-tailed test → Rejection/Critical region on both sides of the distribution H₁≠→双尾检验→分布两侧的排斥/临界区
- < in H₁ → Lower-tailed test → Rejection/Critical region on the left side of the distribution <inH₁→下尾检验→分布左侧的拒绝/关键区域
- > in H₁ → Upper-tailed test → Rejection region on the right side of the distribution >在H₁中→上尾检验→分布右侧的排斥区域
Examples:
例子:
- If the average commute time is at least 30 minutes, then H₀ ≥ 30 and H₁< 30, that means the test is a Lower Tailed test since the critical region will be on the left side of the distribution. 如果平均通勤时间至少为30分钟,则H₀≥30且H₁<30,这意味着该测试为低尾测试,因为关键区域将位于分布的左侧。
- If the average commute time is at most 30 minutes, then H₀≤ 30 and H₁> 30, that means the test is an Upper Tailed test since the critical region will be on the right side of the distribution. 如果平均通勤时间最多为30分钟,则H₀≤30且H₁> 30,这意味着该测试是上尾测试,因为关键区域将位于分布的右侧。
- If the average commute time is 30 minutes, then H₀= 30 and H₁≠30, that means the test is a Two-Tailed test since the critical region will be on both sides of the distribution. 如果平均通勤时间为30分钟,则H₀= 30且H₁≠30,这意味着该测试为两尾测试,因为关键区域将位于分布的两侧。
To find the critical values for the critical region, we use the Critical Value Method or p-Value Method.
为了找到临界区域的临界值 ,我们使用临界值方法或p值方法。
临界值法 (Critical Value Method)
The steps to follow to make a decision using the critical value method are as follows:
使用临界值方法进行决策的步骤如下:
-
Formulate the hypothesis and determine H₀ and H₁ and confirm the type of test we have to do.
提出假设并确定H₀和H₁并确认我们必须进行的测试类型。
- Calculate the value of z-Critical Value(Zc) from the given value of α(Significance Level). 根据给定的α(有效水平)值计算z临界值(Zc)的值。
- Calculate the critical values (UCV and LCV) from Zc based on the type of test. 根据测试类型,从Zc计算临界值(UCV和LCV)。
- The decision is based on the sample mean(x̅ ) for the critical values. 该决定基于临界值的样本均值(x̅)。
Finding Critical Values using an Example
使用示例查找关键值
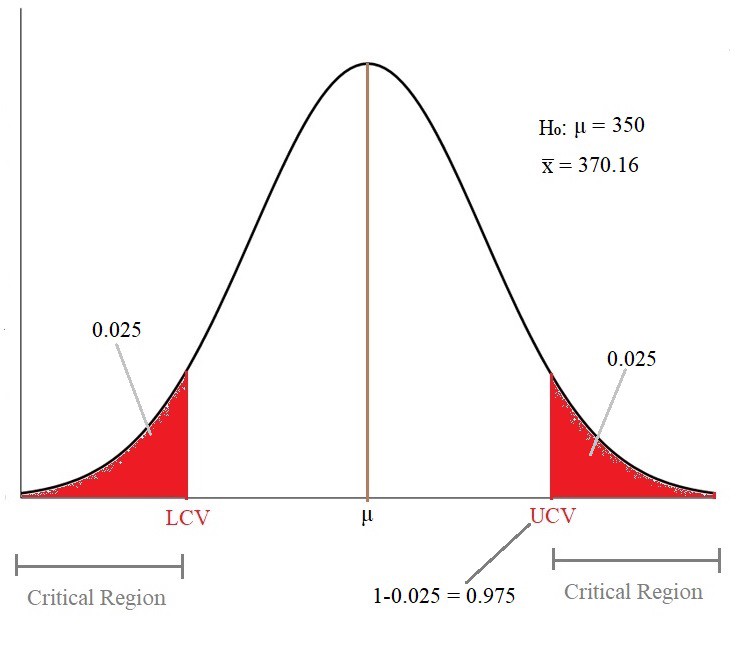
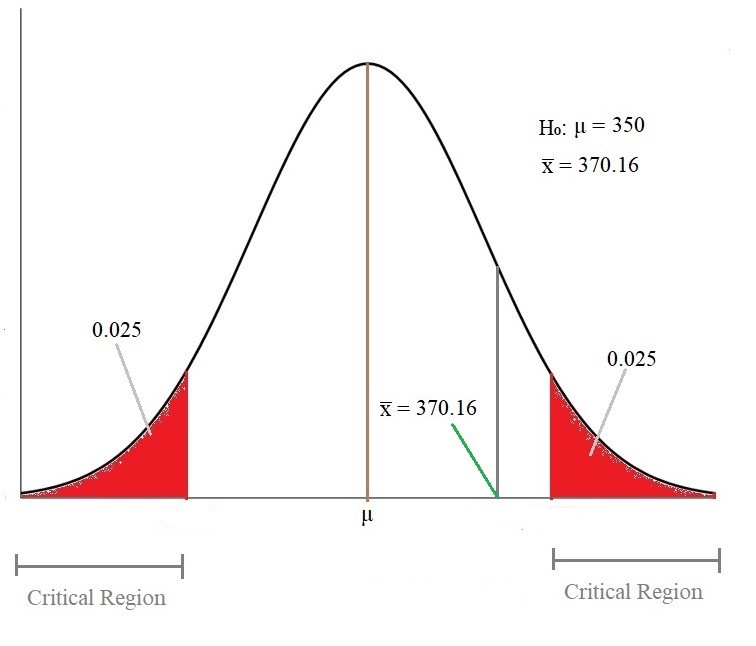
Claim: Let’s say weather forecast claims that average rainfall in a country is 350mm with a standard deviation(σ) of 90. Now, we took 36 cities in the country as a sample and calculated the average sample mean(x̅ ) as 370.16. We have to reject or fail to reject the claim at 5% significance.
声明:假设天气预报声称一个国家的平均降雨量为350毫米,标准差(σ)为90。现在,我们以该国家的36个城市为样本,计算出的平均样本平均值(x̅)为370.16。 我们必须拒绝或未能拒绝5%的索赔要求。
Now, using this information, we need to calculate critical values.
现在,使用此信息,我们需要计算临界值。
1. Formulating the Hypothesis
1.提出假设
- Null Hypothesis (H₀): μ = 350 零假设(H₀):μ= 350
- Alternate Hypothesis (H₁) ≠350 候补假设(H₁)≠350
Since H₁ contains ≠ sign, the test will be of a Two-tailed test with a critical region on both sides of the normal distribution.
由于H₁包含≠符号,所以该检验将是两尾检验,在正态分布的两侧都有一个关键区域。
2. Find Zc value
2.查找Zc值
Given α = 0.05, since it is a two-tailed test, the critical region lies on both sides of distribution so that the significance level will be 0.025 on both sides. That means the area of the critical region on the right side would be 0.025. Which means the area till UCV (Cumulative Probability till that point) would be 1–0.025 = 0.975.
给定α= 0.05,因为这是一个双尾检验,所以关键区域位于分布的两侧,因此显着性水平将在两侧均为0.025。 这意味着右侧的关键区域的面积为0.025。 这意味着直到UCV为止的面积(到那时为止的累积概率)将为1–0.025 = 0.975。
So, we need to find Z score at the value of 0.975 using Z-Table. The Z score will be 1.96
因此,我们需要使用Z-Table查找Z得分为0.975的值。 Z分数将是1.96
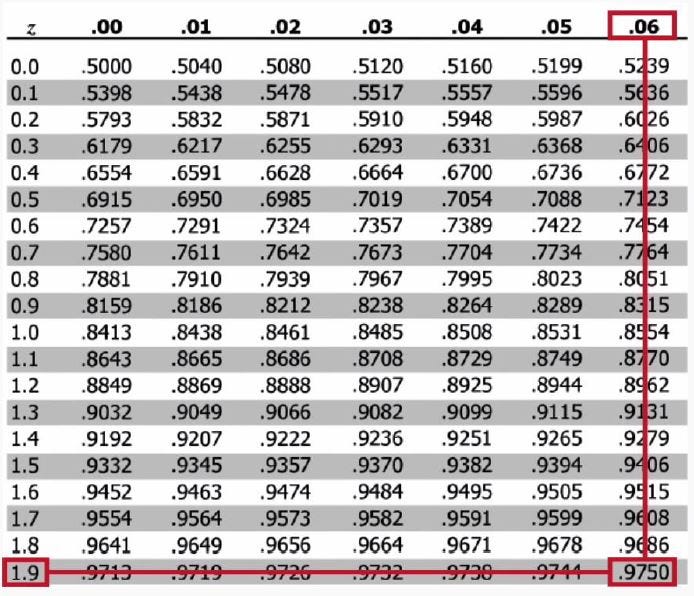
Zc = 1.96
Zc = 1.96
3. Calculate Critical Values
3.计算临界值
The formula to calculate the critical values is:UCV = μ+(Zc * σx)LCV = μ-(Zc * σx)
计算临界值的公式为:UCV =μ+(Zc *σx)LCV =μ-(Zc *σx)
σx = σ/√n = 90/√36 = 90/6 = 15
σx=σ/√n= 90 /√36= 90/6 = 15
UCV =350+(1.96*15) = 379.4LCV =350-(1.96*15) = 320.6
UCV = 350 +(1.96 * 15)= 379.4LCV = 350-(1.96 * 15)= 320.6
Now, let’s plot the all the values of μ, x̅ , UCV, and LCV in the distribution graph and make a decision.
现在,让我们在分布图中绘制μ,x̅,UCV和LCV的所有值并做出决定。
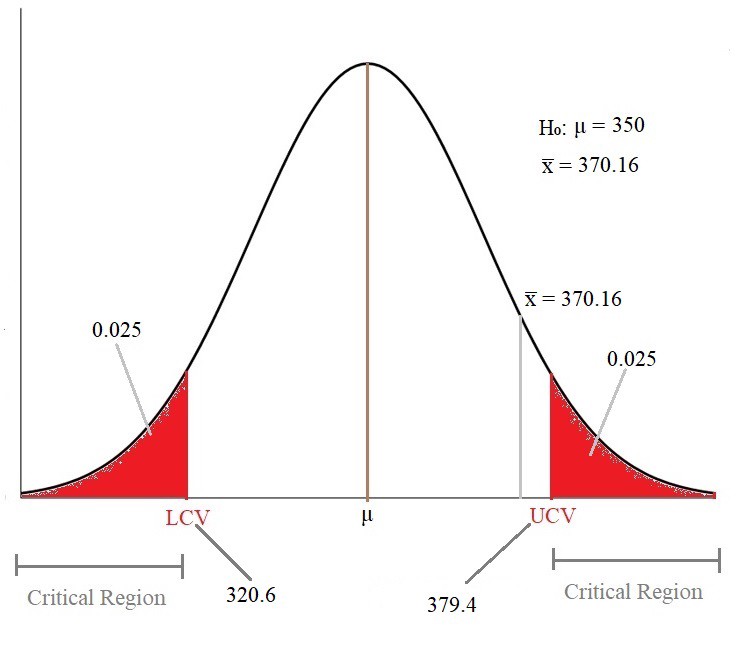
As we can see, the Sample Mean(x̅ ) lies outside the Critical Region.
如我们所见,样本均值(x̅)位于关键区域之外。
4. Make a Decision
4.做出决定
As the Sample Mean lies outside the Critical Region, we fail to reject the null hypothesis.
由于样本均值位于关键区域之外,因此我们无法拒绝原假设。
That is how we claim about whether the Hypothesis is correct or not using the Critical Value Method. Next, we’ll see another method called the p-Value Method. The p-Value Method is important and is used more frequently in the industry.
这就是我们使用临界值方法对假设是否正确的主张。 接下来,我们将看到另一个称为p值方法的方法。 p值方法很重要,在行业中使用更为频繁。
p值法 (p-Value Method)
In simple terms, p-Value is defined as the probability that the null hypothesis will not be rejected. It is not the formal definition; it is for better understanding.
简单来说,p值定义为原假设不会被拒绝的概率。 这不是正式的定义; 这是为了更好地理解。
The following are the steps we need to follow to decide on the null hypothesis using the p-value method:
下面是使用p值方法确定零假设的步骤:
-
Formulate the hypothesis and determine H₀ and H₁ and confirm the type of test we have to do.
提出假设并确定H₀和H₁并确认我们必须进行的测试类型。
- Calculate the value of Z for the sample mean. 计算样本平均值的Z值。
- Calculate the p-value for the given z-score using the z-table. 使用z表计算给定z分数的p值。
- Make a decision based on the p-value for the given value of σ(significance) 根据给定的σ(有效值)的p值进行决策
To find the p-value using z-score.
使用z分数查找p值。
Situation 1: If the sample mean is on the right side of the distribution mean, z-value= +3.02, then from Z-table, we can find the value = 0.9987
情况1:如果样本均值在分布均值的右侧,z值= +3.02,则从Z表中,我们可以找到该值= 0.9987
Now,
现在,
For one-tailed test → p = 1–0.9987 = 0.0013For two-tailed test → p =2(1–0.9987) = 0.0026
对于单尾检验→p = 1–0.9987 = 0.0013对于单尾检验→p = 2(1-0.9987)= 0.0026
Situation 2: If the sample mean is on the left side of the distribution mean, z-value= -3.02, then from Z-table, we can find the value = 0.0013
情况2:如果样本均值在分布均值的左侧,z值= -3.02,则从Z表中,我们可以找到该值= 0.0013
Now,
现在,
For one-tailed test → p = 0.0013For two-tailed test → p =2*0.0013= 0.0026
对于单尾检验→p = 0.0013对于单尾检验→p = 2 * 0.0013 = 0.0026
Finding the p-Value using an Example
使用示例查找p值
Let’s take the same weather forecast example we’ve used for the critical value method.We have μ = 350, x̅ =370.16, σ=90, α = 5%
让我们以临界值方法使用的相同天气预报示例为例,我们有μ= 350,x̅= 370.16,σ= 90,α= 5%
σx = σ/√n = 90/√36 = 15
σx=σ/√n= 90 /√36= 15
1. Formulating the Hypothesis
1.提出假设
- Null Hypothesis (H₀): μ = 350 零假设(H₀):μ= 350
- Alternate Hypothesis (H₁) ≠350 候补假设(H₁)≠350
Since H₁ contains ≠ sign, the test will be of a Two-tailed test with a critical region on both sides of the normal distribution.
由于H₁包含≠符号,所以该检验将是两尾检验,在正态分布的两侧都有一个关键区域。
2. Calculate the value of Z-score for the sample mean
2.计算样本均值的Z值
Z =( x̅ -μ)/σx = (370.16–350)/15 = 1.34
Z =(x̅-μ)/σx=(370.16–350)/ 15 = 1.34
Using the Z-Table, we’ll find the cumulative probability for Z-Value
使用Z表 ,我们将找到Z值的累积概率
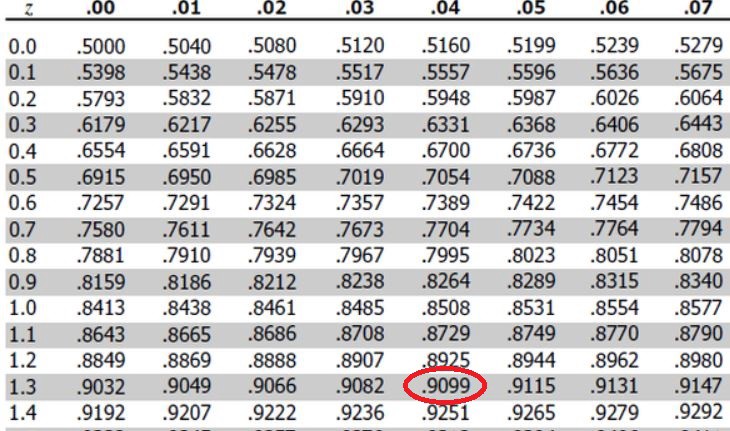
P(Z=1.34) = 0.9099
P(Z = 1.34)= 0.9099
3. Calculate the value of p
3.计算p的值
Using the two situations mentioned earlier, since the sample mean lies to the right side of the distribution mean.
使用前面提到的两种情况,因为样本均值位于分布均值的右侧。
Since the sample mean is on the right side of the distribution mean value and the test is of a two-tailed test,
由于样本均值位于分布均值的右侧,而检验属于两尾检验,
p =2(1–0.9099) = 0.1802
p = 2(1-0.9099)= 0.1802
4. Make a Decision
4.做出决定
Since the p-value (0.1802) is greater than the value of α (0.05), we fail to reject the null hypothesis.
由于p值(0.1802)大于α的值(0.05),因此我们无法拒绝原假设。
失误 (Errors)
There are two types of errors we can commit during hypothesis testing:
在假设检验期间,我们可以犯两种错误:
- Type-I error I型错误
- Type-II error II型错误
Type-I Error
I型错误
The Type-I error occurs when the null hypothesis is correct, but we reject it, i.e., reject H₀ when it is true.The probability of type 1 error is denoted by alpha(α) and is usually 0.05 or 0.01, i.e., only a 5% or 1% chance. The type 1 error is also called the level of significance of the hypothesis test.
当零假设正确时,会发生I型错误,但我们拒绝它,即当H₀为真时拒绝H₀。类型1错误的概率由alpha(α)表示,通常为0.05或0.01,即仅5%或1%的机会。 类型1错误也称为假设检验的显着性水平。
Type-II Error
II型错误
The Type-II error occurs when the null hypothesis is false, but we fail to reject it, i.e., fail to reject H₀ when it is false.In practical terms, this is the most severe error we can make. The probability of type 2 error is denoted by beta (β).
II型错误是在原假设为假时发生的,但是我们不能拒绝它,也就是说,当假假设为假时,我们不能拒绝H₀。实际上,这是我们可以犯的最严重的错误。 类型2错误的概率由beta(β)表示。
结论 (Conclusion)
As we have seen, a Hypothesis is a claim or an assumption that we make about one or more population parameters. There are two types of Hypotheses, Null hypothesis (H₀) and Alternate hypothesis (H₁). Based on these hypotheses, we formulate three tests: a two-tailed test, a lower-tailed test, and an Upper-tailed test. Finally, with the help of the Critical Value Method and p-Value method, we decide to reject or fail to reject the null hypothesis.
正如我们所看到的,假设是对一个或多个总体参数的一种要求或一种假设。 假设有两种类型,无效假设(H₀)和替代假设(H₁)。 基于这些假设,我们制定了三个检验:一个双尾检验,一个下尾检验和一个上尾检验。 最后,借助临界值方法和p值方法,我们决定拒绝或不拒绝原假设。
There are so many other methods to make decisions like the T-distribution method, Two-sample mean test, Two-sample proportion test, A/B testing, etc. Once we understand how the hypothesis works, we can explore more about the methods and techniques.
还有许多其他决策方法,例如T分布法,两次抽样均值检验,两次抽样比例检验,A / B检验等。一旦我们了解了假设的工作原理,我们就可以探索更多关于这些方法的方法。和技术。
Thank you for reading and happy coding!!!
感谢您的阅读和愉快的编码!!!
在这里查看我以前有关Python的文章 (Check out my previous articles about Python here)
翻译自: https://towardsdatascience.com/hypothesis-testing-data-science-1b620240802c
数据分析中假设检验


 已为社区贡献2条内容

所有评论(0)