【机器学习】集成学习与梯度提升决策树
本文系统介绍了集成学习方法及其核心算法,包括自举聚合(Bagging)、随机森林、AdaBoost、梯度提升决策树(GBDT)和XGBoost。主要内容涵盖:Bagging与随机森林、梯度提升算法、Python实现实验和算法评估,本文通过理论推导与实验验证相结合,全面阐述了集成学习降低方差、提升泛化能力的机制,为实际应用提供了技术参考。
目录
一、引言
在机器学习的广阔领域中,集成学习(Ensemble Learning)犹如一座闪耀的明星,它通过组合多个基本学习器的力量,创造出远超单个模型的预测能力。梯度提升决策树融合了决策树的可解释性与梯度优化的高效性,成为了现代机器学习领域最受欢迎的算法之一。本文将详细介绍自举聚合与随机森林、集成学习器、提升算法以及Python代码实现集成学习与梯度提升决策树的实验。
二、自举聚合与随机森林
1. 自举聚合(Bagging)原理
1.1 基本概念
自举聚合(Bootstrap Aggregating,简称Bagging)是一种集成学习方法,旨在通过结合多个基学习器的预测来提高模型的稳定性和准确性。该方法由Leo Breiman于1996年提出,其核心思想是利用自助采样(Bootstrap Sampling)技术从原始训练数据中生成多个不同的训练子集,然后在每个子集上独立训练一个基学习器,最后将所有基学习器的预测结合起来。
1.2 数学形式化描述
给定训练集 ,Bagging的过程可以表示为:
(1) 自助采样:对于:通过有放回抽样,从
中随机抽取
个样本,形成训练子集
。
(2) 训练基学习器:对每个训练子集,独立训练得到基学习器
。
(3) 组合预测:
a.对于分类问题,使用投票法:
b. 对于回归问题,使用平均法:
其中,是基学习器的数量,
是指示函数。
1.3 理论基础
Bagging成功的关键在于减少了方差。具体来说,假设每个基学习器的错误期望为,当基学习器相互独立时,集成后的方差会减小为原来的
。对于具有方差
的
个独立同分布的随机变量,它们的平均值的方差为
,即:
1.4 袋外估计(OOB, Out-of-Bag Estimation)
由于自助采样是有放回的,每个训练子集包含原始训练集中约63.2%的样本,剩余约36.8%的样本未被选中,称为"袋外样本"。
对于每个样例,可以用没有使用它训练的基学习器对它进行预测,得到的错误率称为"袋外误差"(OOB Error),其形式化定义为:
OOB估计是泛化误差的无偏估计,可以用来代替交叉验证。
2. 随机森林(Random Forest)
2.1 基本概念
随机森林是Bagging的特殊情况,它使用决策树作为基学习器,并在决策树构建过程中引入了额外的随机性。随机森林同样由Leo Breiman在2001年提出,是目前最流行的集成学习方法之一。
2.2 随机森林的两层随机性
随机森林包含两层随机性:
(1) 样本随机性:与Bagging一样,通过有放回抽样生成训练子集。
(2) 特征随机性:在每个节点分裂时,不考虑所有特征,而只考虑随机选择的特征子集。
此特征随机化机制可以形式化表示为:对于每个决策树节点,从个特征中随机选择
个特征(通常
或
),然后仅在这
个特征中寻找最优分割点。
2.3 数学模型
假设原始特征空间维度为,则随机森林的构建过程为:
(1) 对于 :
a.通过有放回抽样,从训练集中随机抽取
个样本,形成训练子集
。
b.在上训练一棵决策树
,其中每个节点分裂时:
(a)随机选择个特征(
)。
(b)在这个特征中找到最佳分裂特征和分裂点。
(c)按该分裂生成子节点。
(d)递归处理子节点,直到满足停止条件。
(2) 最终的随机森林模型:
a.分类问题:
b.回归问题:
2.4 特征重要性计算
随机森林可以计算特征的重要性分数,这是其重要的优势之一。对于特征j的重要性,可以通过计算其在所有树中的平均不纯度减少量来估计:
其中,表示树
中使用特征
进行分裂的所有节点集合,
表示节点
分裂前后的不纯度减少量。
3.优势与应用
3.1 优势
(1) 减少方差:通过多次采样训练,降低了模型的方差,提高了稳定性。
(2) 避免过拟合:特征的随机选择使得树之间相关性降低,减轻了过拟合。
(3) 提供OOB估计:无需额外的验证集即可估计泛化误差。
(4) 内置特征重要性评估:可以评估各个特征对预测的贡献。
(5) 高度并行化:树之间相互独立,可以并行训练,提高效率。
(6) 处理高维数据:能够处理具有大量特征的数据集。
(7) 处理缺失值:对缺失值具有较强的鲁棒性。
3.2 典型应用场景
(1) 分类任务:信用评分、垃圾邮件检测、疾病诊断。
(2) 回归任务:房价预测、销售额预测。
(3) 特征选择:通过特征重要性评估进行降维。
(4)异常检测:识别与正常模式不符的数据点。
4.自举聚合与随机森林的代码实现
4.1自定义实现Bagging类
class Bagging:
    def __init__(self, base_estimator, n_estimators=10):
        self.base_estimator = base_estimator  # 基学习器
        self.n_estimators = n_estimators  # 基学习器数量
        self.estimators = []  # 存储训练好的基学习器

    def fit(self, X, y):
        n_samples = X.shape[0]

        # 训练n_estimators个基学习器
        for _ in range(self.n_estimators):
            # 有放回抽样
            indices = np.random.choice(n_samples, n_samples, replace=True)
            X_bootstrap, y_bootstrap = X[indices], y[indices]

            # 克隆并训练基学习器
            estimator = clone(self.base_estimator)
            estimator.fit(X_bootstrap, y_bootstrap)
            self.estimators.append(estimator)

        return self

    def predict(self, X):
        # 收集所有基学习器的预测
        predictions = np.array([estimator.predict(X) for estimator in self.estimators])

        # 投票得到最终预测(适用于分类问题)
        if len(np.unique(predictions.flatten())) < 10:  # 假设小于10个唯一值为分类
            # 分类问题:多数投票
            return np.apply_along_axis(
                lambda x: np.bincount(x).argmax(),
                axis=0,
                arr=predictions)
        else:
            # 回归问题:平均值
            return np.mean(predictions, axis=0)
4.2自定义实现随机森林类
class RandomForest:
    def __init__(self, n_estimators=100, max_features='sqrt', max_depth=None):
        self.n_estimators = n_estimators
        self.max_features = max_features
        self.max_depth = max_depth
        self.trees = []
        self.oob_score_ = None

    def _bootstrap_sample(self, X, y):
        n_samples = X.shape[0]
        # 有放回抽样
        indices = np.random.choice(n_samples, n_samples, replace=True)
        # 记录袋外样本索引
        oob_indices = np.array([i for i in range(n_samples) if i not in np.unique(indices)])

        return X[indices], y[indices], oob_indices

    def fit(self, X, y):
        n_samples = X.shape[0]
        n_features = X.shape[1]

        # 确定每个节点随机选择的特征数量
        if self.max_features == 'sqrt':
            self.max_features_used = int(np.sqrt(n_features))
        elif self.max_features == 'log2':
            self.max_features_used = int(np.log2(n_features))
        elif isinstance(self.max_features, int):
            self.max_features_used = self.max_features
        else:
            self.max_features_used = n_features

        # 初始化OOB预测数组
        oob_predictions = np.zeros((n_samples, len(np.unique(y))))
        oob_samples_count = np.zeros(n_samples)

        # 训练n_estimators棵树
        for _ in range(self.n_estimators):
            # 自助采样
            X_bootstrap, y_bootstrap, oob_indices = self._bootstrap_sample(X, y)

            # 创建决策树并设置随机特征选择
            tree = DecisionTreeClassifier(
                max_features=self.max_features_used,
                max_depth=self.max_depth
            )
            tree.fit(X_bootstrap, y_bootstrap)
            self.trees.append(tree)

            # 计算袋外样本预测
            if len(oob_indices) > 0:
                oob_pred = tree.predict_proba(X[oob_indices])
                oob_predictions[oob_indices] += oob_pred
                oob_samples_count[oob_indices] += 1

        # 计算OOB分数
        valid_oob = oob_samples_count > 0
        if np.any(valid_oob):
            oob_predictions_valid = oob_predictions[valid_oob]
            oob_samples_count_valid = oob_samples_count[valid_oob, np.newaxis]
            oob_predictions_avg = oob_predictions_valid / oob_samples_count_valid
            y_pred = np.argmax(oob_predictions_avg, axis=1)
            self.oob_score_ = np.mean(y[valid_oob] == y_pred)

        return self

    def predict(self, X):
        # 收集所有树的预测
        predictions = np.array([tree.predict(X) for tree in self.trees])
        # 投票得到最终预测
        return np.apply_along_axis(
            lambda x: np.bincount(x).argmax(),
            axis=0,
            arr=predictions)

    def predict_proba(self, X):
        # 收集所有树的概率预测并平均
        probas = np.array([tree.predict_proba(X) for tree in self.trees])
        return np.mean(probas, axis=0)

    def feature_importances_(self):
        # 计算平均特征重要性
        importances = np.mean([tree.feature_importances_ for tree in self.trees], axis=0)
        return importances
5.算法调优与最佳实践
5.1 主要超参数
(1) n_estimators:基学习器数量,通常越多越好,但会增加计算成本。
(2) max_features:每个节点随机选择的特征数:
分类建议:
回归建议:
(3) max_depth:树的最大深度,控制复杂度。
(4) min_samples_split:分裂内部节点所需的最小样本数。
(5) min_samples_leaf:叶节点所需的最小样本数。
5.2超参数调优示例
import numpy as np
import pandas as pd
import matplotlib.pyplot as plt
import seaborn as sns
from sklearn.datasets import make_classification
from sklearn.model_selection import train_test_split, GridSearchCV, learning_curve
from sklearn.ensemble import RandomForestClassifier
from sklearn.metrics import accuracy_score, classification_report, confusion_matrix, roc_curve, auc
import time
import warnings
from matplotlib.font_manager import FontProperties
import platform
import os
import tempfile

# 为多进程操作创建一个纯ASCII字符的临时目录路径
temp_dir = tempfile.mkdtemp(prefix='sklearn_rf_')
os.environ['JOBLIB_TEMP_FOLDER'] = temp_dir
print(f"临时文件夹路径: {temp_dir}")

# 忽略警告
warnings.filterwarnings("ignore")

# 设置中文字体
def setup_chinese_font():
    system = platform.system()

    if system == 'Windows':
        font_paths = [
            'C:/Windows/Fonts/simhei.ttf',    # 黑体
            'C:/Windows/Fonts/simsun.ttc',    # 宋体
            'C:/Windows/Fonts/msyh.ttc',      # 微软雅黑
            'C:/Windows/Fonts/simfang.ttf',   # 仿宋
        ]
    elif system == 'Darwin':  # macOS
        font_paths = [
            '/System/Library/Fonts/PingFang.ttc',
            '/Library/Fonts/STHeiti Light.ttc',
            '/Library/Fonts/Songti.ttc',
        ]
    else:  # Linux
        font_paths = [
            '/usr/share/fonts/truetype/wqy/wqy-microhei.ttc',
            '/usr/share/fonts/opentype/noto/NotoSansCJK-Regular.ttc',
            '/usr/share/fonts/truetype/arphic/uming.ttc',
        ]

    for font_path in font_paths:
        if os.path.exists(font_path):
            print(f"使用字体: {font_path}")
            return FontProperties(fname=font_path)

    print("未找到指定的中文字体文件,将尝试使用系统配置的字体")
    return None

chinese_font = setup_chinese_font()

# 配置matplotlib全局字体设置
if chinese_font is not None:
    plt.rcParams['font.family'] = chinese_font.get_family()
    plt.rcParams['font.sans-serif'] = [chinese_font.get_name()] + plt.rcParams['font.sans-serif']
else:
    plt.rcParams['font.sans-serif'] = ['SimHei', 'Microsoft YaHei', 'DejaVu Sans', 'Arial']
plt.rcParams['axes.unicode_minus'] = False

# 设置美观的图表风格
plt.style.use('ggplot')

print("随机森林超参数调优实验")
print("-" * 50)

# 1. 生成数据
print("\n[步骤1] 生成分类数据集...")
X, y = make_classification(
    n_samples=1000,           # 样本数量
    n_features=20,            # 特征数量
    n_informative=10,         # 信息特征的数量
    n_redundant=5,            # 冗余特征的数量
    n_repeated=0,             # 重复特征的数量
    n_classes=2,              # 分类数量
    flip_y=0.1,               # 随机翻转标签的比例
    class_sep=1.0,            # 类别间的分离度
    random_state=42           # 随机种子
)

# 2. 数据预处理
print("[步骤2] 划分训练集和测试集...")
X_train, X_test, y_train, y_test = train_test_split(X, y, test_size=0.2, random_state=42)

print(f"训练集大小: {X_train.shape}")
print(f"测试集大小: {X_test.shape}")
print(f"特征数量: {X_train.shape[1]}")

# 3. 定义参数网格 - 为了加快运行速度,缩小参数空间
print("\n[步骤3] 定义参数网格...")
# 第一阶段:粗调参数 - 简化版本
param_grid_coarse = {
    'n_estimators': [50, 100],            # 树的数量
    'max_depth': [None, 10],              # 树的最大深度
    'min_samples_split': [2, 5],          # 内部节点再划分所需的最小样本数
    'min_samples_leaf': [1, 2],           # 叶节点所需的最小样本数
    'max_features': ['sqrt', 'log2']      # 寻找最佳分割时考虑的特征数
}

print("粗调参数网格:")
for param, values in param_grid_coarse.items():
    print(f"- {param}: {values}")

# 4. 创建基础模型
print("\n[步骤4] 创建基础随机森林模型...")
rf_base = RandomForestClassifier(random_state=42)

# 5. 创建并执行网格搜索 - 粗调阶段
print("\n[步骤5] 执行粗调参数的网格搜索(可能需要较长时间)...")
start_time = time.time()
grid_search_coarse = GridSearchCV(
    estimator=rf_base,
    param_grid=param_grid_coarse,
    scoring='accuracy',
    cv=3,                      # 3折交叉验证,加快速度
    n_jobs=-1,                 # 使用所有CPU核心
    verbose=1,                 # 显示进度
    return_train_score=True    # 返回训练集得分,用于分析过拟合
)

try:
    grid_search_coarse.fit(X_train, y_train)
    coarse_time = time.time() - start_time

    print(f"\n粗调参数完成,耗时: {coarse_time:.2f}秒")
    print(f"最佳参数组合: {grid_search_coarse.best_params_}")
    print(f"最佳交叉验证准确率: {grid_search_coarse.best_score_:.4f}")

    # 6. 基于粗调结果进行精调
    print("\n[步骤6] 基于粗调结果定义精调参数网格...")

    # 从粗调中获取最佳参数
    best_n_estimators = grid_search_coarse.best_params_['n_estimators']
    best_max_depth = grid_search_coarse.best_params_['max_depth']
    best_min_samples_split = grid_search_coarse.best_params_['min_samples_split']
    best_min_samples_leaf = grid_search_coarse.best_params_['min_samples_leaf']
    best_max_features = grid_search_coarse.best_params_['max_features']

    # 根据粗调结果定义更精细的参数网格 - 简化版本
    param_grid_fine = {
        'n_estimators': [best_n_estimators, best_n_estimators + 50],
        'max_features': [best_max_features],
    }

    # 对max_depth特别处理
    if best_max_depth is None:
        param_grid_fine['max_depth'] = [None, 15]
    else:
        param_grid_fine['max_depth'] = [best_max_depth, best_max_depth + 5]

    # 添加其他参数的精细搜索
    param_grid_fine['min_samples_split'] = [best_min_samples_split, best_min_samples_split + 1]
    param_grid_fine['min_samples_leaf'] = [best_min_samples_leaf, best_min_samples_leaf + 1]

    # 添加其他可能影响性能的参数
    param_grid_fine['bootstrap'] = [True]
    param_grid_fine['criterion'] = ['gini', 'entropy']

    print("精调参数网格:")
    for param, values in param_grid_fine.items():
        print(f"- {param}: {values}")

    # 7. 执行精调网格搜索
    print("\n[步骤7] 执行精调参数的网格搜索(可能需要较长时间)...")
    start_time = time.time()
    grid_search_fine = GridSearchCV(
        estimator=rf_base,
        param_grid=param_grid_fine,
        scoring='accuracy',
        cv=3,                  # 3折交叉验证,加快速度
        n_jobs=-1,
        verbose=1,
        return_train_score=True
    )

    grid_search_fine.fit(X_train, y_train)
    fine_time = time.time() - start_time

    print(f"\n精调参数完成,耗时: {fine_time:.2f}秒")
    print(f"最终最佳参数组合: {grid_search_fine.best_params_}")
    print(f"最终最佳交叉验证准确率: {grid_search_fine.best_score_:.4f}")

    # 8. 使用最佳参数评估模型
    print("\n[步骤8] 使用最佳参数评估模型性能...")
    best_rf = grid_search_fine.best_estimator_
    y_pred = best_rf.predict(X_test)
    accuracy = accuracy_score(y_test, y_pred)

    print(f"测试集准确率: {accuracy:.4f}")
    print("\n分类报告:")
    print(classification_report(y_test, y_pred))

    # 9. 可视化结果
    print("\n[步骤9] 可视化评估结果...")

    # 9.1 混淆矩阵
    plt.figure(figsize=(10, 8))
    cm = confusion_matrix(y_test, y_pred)
    sns.heatmap(cm, annot=True, fmt='d', cmap='Blues')
    plt.title('随机森林最佳模型混淆矩阵', fontsize=14)
    plt.xlabel('预测标签', fontsize=12)
    plt.ylabel('真实标签', fontsize=12)
    if chinese_font:
        plt.title('随机森林最佳模型混淆矩阵', fontproperties=chinese_font, fontsize=14)
        plt.xlabel('预测标签', fontproperties=chinese_font, fontsize=12)
        plt.ylabel('真实标签', fontproperties=chinese_font, fontsize=12)
    plt.tight_layout()
    plt.savefig('rf_confusion_matrix.png', dpi=300, bbox_inches='tight')
    plt.show()

    # 9.2 ROC曲线
    plt.figure(figsize=(10, 8))
    y_scores = best_rf.predict_proba(X_test)[:, 1]
    fpr, tpr, _ = roc_curve(y_test, y_scores)
    roc_auc = auc(fpr, tpr)

    plt.plot(fpr, tpr, color='darkorange', lw=2, label=f'ROC曲线 (AUC = {roc_auc:.3f})')
    plt.plot([0, 1], [0, 1], color='navy', lw=2, linestyle='--')
    plt.xlim([0.0, 1.0])
    plt.ylim([0.0, 1.05])
    plt.xlabel('假阳性率', fontsize=12)
    plt.ylabel('真阳性率', fontsize=12)
    plt.title('随机森林最佳模型ROC曲线', fontsize=14)
    plt.legend(loc="lower right")
    if chinese_font:
        plt.xlabel('假阳性率', fontproperties=chinese_font, fontsize=12)
        plt.ylabel('真阳性率', fontproperties=chinese_font, fontsize=12)
        plt.title('随机森林最佳模型ROC曲线', fontproperties=chinese_font, fontsize=14)
        for text in plt.legend().get_texts():
            text.set_fontproperties(chinese_font)
    plt.tight_layout()
    plt.savefig('rf_roc_curve.png', dpi=300, bbox_inches='tight')
    plt.show()

    # 9.3 特征重要性
    plt.figure(figsize=(12, 10))
    importances = best_rf.feature_importances_
    indices = np.argsort(importances)[::-1]

    plt.bar(range(X_train.shape[1]), importances[indices], align='center')
    plt.xticks(range(X_train.shape[1]), [f'特征 {i}' for i in indices], rotation=90)
    plt.title('随机森林特征重要性', fontsize=14)
    plt.xlabel('特征', fontsize=12)
    plt.ylabel('重要性', fontsize=12)
    if chinese_font:
        plt.title('随机森林特征重要性', fontproperties=chinese_font, fontsize=14)
        plt.xlabel('特征', fontproperties=chinese_font, fontsize=12)
        plt.ylabel('重要性', fontproperties=chinese_font, fontsize=12)
        plt.xticks(rotation=90, fontproperties=chinese_font)
    plt.tight_layout()
    plt.savefig('rf_feature_importance.png', dpi=300, bbox_inches='tight')
    plt.show()

    # 9.4 参数重要性
    def plot_param_importance(grid_search, title):
        plt.figure(figsize=(14, 10))

        results = pd.DataFrame(grid_search.cv_results_)

        # 提取参数名称
        param_names = [p for p in results.columns if p.startswith('param_')]

        # 创建一个包含每个参数的单独子图
        n_params = len(param_names)
        n_cols = 2
        n_rows = (n_params + 1) // 2

        for i, param_name in enumerate(param_names):
            plt.subplot(n_rows, n_cols, i + 1)

            # 提取参数的实际名称(不含"param_"前缀)
            param = param_name[6:]

            # 获取参数值和对应的平均测试分数
            param_values = results[param_name].astype(str)
            unique_values = param_values.unique()

            # 对于每个唯一的参数值,计算其平均测试分数
            mean_scores = [results[param_values == val]['mean_test_score'].mean() for val in unique_values]

            # 创建条形图
            plt.bar(range(len(unique_values)), mean_scores)
            plt.xticks(range(len(unique_values)), unique_values, rotation=45)
            plt.title(f'参数 {param} 的影响', fontsize=12)
            plt.xlabel(param, fontsize=10)
            plt.ylabel('平均测试分数', fontsize=10)
            if chinese_font:
                plt.title(f'参数 {param} 的影响', fontproperties=chinese_font, fontsize=12)
                plt.xlabel(param, fontproperties=chinese_font, fontsize=10)
                plt.ylabel('平均测试分数', fontproperties=chinese_font, fontsize=10)

        plt.suptitle(title, fontsize=16)
        if chinese_font:
            plt.suptitle(title, fontproperties=chinese_font, fontsize=16)
        plt.tight_layout(rect=[0, 0, 1, 0.96])
        plt.savefig('rf_param_importance.png', dpi=300, bbox_inches='tight')
        plt.show()

    # 显示精调参数的重要性
    plot_param_importance(grid_search_fine, '随机森林参数重要性分析')

    # 9.5 学习曲线
    train_sizes, train_scores, test_scores = learning_curve(
        best_rf, X_train, y_train, cv=3, n_jobs=-1,
        train_sizes=np.linspace(0.1, 1.0, 5)  # 减少点数以加快速度
    )

    train_mean = np.mean(train_scores, axis=1)
    train_std = np.std(train_scores, axis=1)
    test_mean = np.mean(test_scores, axis=1)
    test_std = np.std(test_scores, axis=1)

    plt.figure(figsize=(10, 8))
    plt.plot(train_sizes, train_mean, color='blue', marker='o', markersize=5, label='训练集分数')
    plt.fill_between(train_sizes, train_mean + train_std, train_mean - train_std, alpha=0.15, color='blue')
    plt.plot(train_sizes, test_mean, color='green', marker='s', markersize=5, label='验证集分数')
    plt.fill_between(train_sizes, test_mean + test_std, test_mean - test_std, alpha=0.15, color='green')
    plt.title('随机森林最佳模型学习曲线', fontsize=14)
    plt.xlabel('训练样本数', fontsize=12)
    plt.ylabel('准确率', fontsize=12)
    plt.grid(True)
    plt.legend(loc='lower right')
    if chinese_font:
        plt.title('随机森林最佳模型学习曲线', fontproperties=chinese_font, fontsize=14)
        plt.xlabel('训练样本数', fontproperties=chinese_font, fontsize=12)
        plt.ylabel('准确率', fontproperties=chinese_font, fontsize=12)
        for text in plt.legend().get_texts():
            text.set_fontproperties(chinese_font)
    plt.tight_layout()
    plt.savefig('rf_learning_curve.png', dpi=300, bbox_inches='tight')
    plt.show()

    # 10. 总结最佳模型配置
    print("\n[步骤10] 最终随机森林模型配置:")
    for param, value in best_rf.get_params().items():
        print(f"- {param}: {value}")

    print("\n超参数调优实验完成!")
    print(f"总耗时: {coarse_time + fine_time:.2f}秒")
    print(f"最终模型测试集准确率: {accuracy:.4f}")

except Exception as e:
    print(f"发生错误: {str(e)}")
    print("尝试不使用并行处理的简化版本...")

    # 如果并行处理失败,尝试使用简化版本(不使用并行)
    rf_base = RandomForestClassifier(
        n_estimators=100,
        max_depth=10,
        min_samples_split=2,
        min_samples_leaf=1,
        max_features='sqrt',
        random_state=42
    )

    rf_base.fit(X_train, y_train)
    y_pred = rf_base.predict(X_test)
    accuracy = accuracy_score(y_test, y_pred)

    print(f"\n使用默认参数的随机森林模型准确率: {accuracy:.4f}")
    print("\n分类报告:")
    print(classification_report(y_test, y_pred))

    # 简单的可视化
    plt.figure(figsize=(12, 10))
    importances = rf_base.feature_importances_
    indices = np.argsort(importances)[::-1]

    plt.bar(range(X_train.shape[1]), importances[indices], align='center')
    plt.xticks(range(X_train.shape[1]), [f'特征 {i}' for i in indices], rotation=90)
    plt.title('随机森林特征重要性 (默认参数)', fontsize=14)
    plt.xlabel('特征', fontsize=12)
    plt.ylabel('重要性', fontsize=12)
    if chinese_font:
        plt.title('随机森林特征重要性 (默认参数)', fontproperties=chinese_font, fontsize=14)
        plt.xlabel('特征', fontproperties=chinese_font, fontsize=12)
        plt.ylabel('重要性', fontproperties=chinese_font, fontsize=12)
        plt.xticks(rotation=90, fontproperties=chinese_font)
    plt.tight_layout()
    plt.savefig('rf_feature_importance_default.png', dpi=300, bbox_inches='tight')
    plt.show()

finally:
    # 清理临时文件夹
    import shutil
    try:
        shutil.rmtree(temp_dir)
        print(f"已清理临时文件夹: {temp_dir}")
    except:
        pass
程序运行结果如下:
临时文件夹路径: C:\Users\ABC\AppData\Local\Temp\sklearn_rf_iyndeds8
使用字体: C:/Windows/Fonts/simhei.ttf
随机森林超参数调优实验
--------------------------------------------------
[步骤1] 生成分类数据集...
[步骤2] 划分训练集和测试集...
训练集大小: (800, 20)
测试集大小: (200, 20)
特征数量: 20
[步骤3] 定义参数网格...
粗调参数网格:
- n_estimators: [50, 100]
- max_depth: [None, 10]
- min_samples_split: [2, 5]
- min_samples_leaf: [1, 2]
- max_features: ['sqrt', 'log2']
[步骤4] 创建基础随机森林模型...
[步骤5] 执行粗调参数的网格搜索(可能需要较长时间)...
发生错误: 'ascii' codec can't encode characters in position 18-20: ordinal not in range(128)
尝试不使用并行处理的简化版本...
使用默认参数的随机森林模型准确率: 0.8850
分类报告:
precision recall f1-score support
0 0.91 0.84 0.87 93
1 0.87 0.93 0.90 107
accuracy 0.89 200
macro avg 0.89 0.88 0.88 200
weighted avg 0.89 0.89 0.88 200

已清理临时文件夹: C:\Users\ABC\AppData\Local\Temp\sklearn_rf_iyndeds8
三、集成学习器
1. 集成学习的基本原理
1.1 集成学习的定义
集成学习通过构建并结合多个学习器来完成学习任务,其目标是通过集成的方式获得比单一学习器更好的泛化性能。形式化地,给定训练数据集 ,集成学习首先生成
个基学习器
,然后将它们进行结合,得到最终的集成学习器
。
1.2 集成学习的理论基础
集成学习的理论基础主要基于两个方面:偏差-方差分解和"无免费午餐"定理。
1.2.1 偏差-方差分解
对于回归问题,学习器 的预测误差可分解为:
即:误差 = 偏差^2 + 方差
偏差:表示预测值的期望与真实值之间的差异,反映了模型的拟合能力。
方差:表示预测值的波动程度,反映了模型的稳定性。
集成学习通常能够在不增加偏差的情况下减少方差,从而提高模型性能。
1.2.2 集成学习的分类
根据集成的方式,集成学习主要分为三类:
(1) Bagging (Bootstrap Aggregating):通过有放回采样生成多个训练集,在每个训练集上独立训练一个基学习器,最后通过投票或平均组合。
(2) Boosting:串行训练基学习器,每个新的基学习器都关注前一个基学习器错误预测的样本。
(3) Stacking:训练一个元学习器来组合多个基学习器的预测结果。
2. Bagging与随机森林
2.1 Bagging算法
Bagging是Bootstrap Aggregating的缩写,其基本思想是使用自助采样法(bootstrap sampling)从原始数据集中有放回地采样,生成多个训练子集,然后在每个子集上训练一个基学习器,最后通过投票或平均的方式结合这些基学习器。
数学表示
给定训练集 :
(1) 对于:
a.通过自助采样(有放回抽样)从中选择
个样本,形成训练子集
。
b.在上训练出基学习器
。
(2) 对于分类问题,最终预测为:
对于回归问题,最终预测为:
2.2 随机森林算法
随机森林是Bagging的一个特例,它使用决策树作为基学习器,并在训练过程中引入额外的随机性。
随机森林的两层随机性:
(1) 样本随机性:与Bagging相同,使用自助采样生成训练子集。
(2).特征随机性:在决策树的每个节点,只考虑特征的随机子集而非全部特征。
数学表示
(1) 对于 :
a.通过自助采样从训练集中选择
个样本,形成
。
b.训练决策树,在每个节点:
(a)随机选择个特征(通常
,其中
是特征总数)。
(b)在这个特征中找到最佳分割。
(2) 集成预测同Bagging。
2.3 袋外估计(Out-of-Bag Estimation)
在Bagging和随机森林中,每个训练子集约包含原始训练集中63.2%的样本,剩余的约36.8%样本称为"袋外样本",可用于评估模型性能。
袋外误差计算公式:
其中表示
是第
个基学习器的袋外样本。
3. Boosting算法
3.1 AdaBoost算法
AdaBoost(Adaptive Boosting)是最早的Boosting算法之一,其核心思想是按照迭代的方式,每一轮根据上一轮的结果调整样本权重,使得之前被错误分类的样本在新一轮中获得更高的权重。
算法步骤
(1) 初始化样本权重:,对所有
。
(2) 对于 :
a.使用具有权重的训练集训练基学习器
。
b.计算的加权错误率:
c.计算的权重:
d.更新样本权重:
其中是归一化因子。
(3) 最终集成学习器:
3.2 梯度提升(Gradient Boosting)
梯度提升是一种通用的提升框架,它将提升过程看作是在函数空间中优化一个损失函数的过程。
算法步骤
(1) 初始化模型:
2. 对于 :
a. 计算负梯度:
对所有。
b.拟合基学习器到残差
。
c. 找到最优步长:
d. 更新模型:
(3) 最终模型:
特别地,对于平方损失,负梯度恰好是残差:
。
3.3 XGBoost算法
XGBoost(Extreme Gradient Boosting)是梯度提升的高效实现,增加了正则化项和使用二阶导数信息。
目标函数
XGBoost优化的目标函数为:
其中是损失函数,
是正则化项,
是预测值,
是第
个基学习器。
正则化项通常定义为:
其中是叶节点数量,
是第
个叶节点的权重。
算法步骤
在迭代过程中,XGBoost通过泰勒展开来近似目标函数:
其中和
分别是损失函数关于当前预测值的一阶和二阶导数:
最优的树结构通过贪婪算法寻找,评估分裂点的指标为:
其中、
、
、
分别是左右子节点的一阶导数和二阶导数之和。
4. Stacking算法
4.1 基本原理
Stacking(堆叠集成)是一种将多个基学习器的预测结果作为输入,训练元学习器(meta-learner)来组合这些预测的方法。
算法步骤
(1) 训练第一层基学习器:。
(2) 使用K折交叉验证生成每个基学习器在验证集上的预测。
(3) 使用这些预测作为新特征,训练元学习器。
(4) 在预测阶段:
a. 使用所有基学习器对新样本进行预测。
b. 将这些预测输入到元学习器中获得最终预测。
数学表示:
元学习器的训练数据:
预测函数:
4.2 变体和改进
(1)Blending:使用固定的验证集而非交叉验证。
(2)Super Learner:使用交叉验证生成元特征,并使用约束优化来确定元学习器的权重。
(3)Feature-weighted Linear Stacking:考虑原始特征对元学习器的贡献。
5. 集成学习的数学理论和优化
5.1 偏差-方差-协方差分解
对于回归问题,集成学习器的预测误差可以分解为:
对于平均集成,如果有$T$个基学习器,且它们的误差是独立同分布的,那么集成的方差为:
然而,在实际中,基学习器之间通常存在相关性,此时集成的方差为:
其中是基学习器之间的平均相关系数。这就解释了为什么我们需要基学习器之间既有准确性又有多样性。
5.2 多样性生成方法
(1) 数据层面的多样性:
a. 样本扰动(如Bagging中的自助采样).
b. 属性扰动(如随机森林中的特征子集选择)。
c. 输出表示扰动(如错误纠正输出编码)。
(2) 学习器层面的多样性:
a. 不同的学习算法。
b. 同一算法的不同参数设置。
c. 初始化条件的变化(如神经网络的随机初始化)。
6. 实际应用中的集成学习
6.1 参数调优技巧
(1) 基学习器数量:增加基学习器数量通常能提升性能,但会增加计算成本。
(2) 采样策略:对于样本不平衡问题,可以使用分层采样或加权采样。
(3) 学习率(针对提升方法):较小的学习率通常能得到更好的泛化性能,但需要更多迭代。
(4) 正则化:适当的正则化可以防止过拟合。
(5) 早停:使用验证集确定最佳迭代次数。
6.2 集成学习的高级技巧
(1) 异质集成:结合不同类型的基学习器。
(2) 级联集成:多层集成结构。
(3) 动态选择:根据测试样本动态选择子集成。
(4) 多标签集成:处理多标签分类问题。
(5) 深度集成:结合深度学习和集成学习。
7. 集成学习算法的Python实现示例
7.1 自定义AdaBoost实现
class AdaBoost:
    def __init__(self, n_estimators=50, learning_rate=1.0):
        self.n_estimators = n_estimators
        self.learning_rate = learning_rate
        self.estimators = []
        self.estimator_weights = []

    def fit(self, X, y):
        n_samples = len(X)
        # 初始化样本权重
        sample_weights = np.ones(n_samples) / n_samples

        for i in range(self.n_estimators):
            # 训练基学习器
            estimator = DecisionTreeClassifier(max_depth=1)  # 决策树桩
            estimator.fit(X, y, sample_weight=sample_weights)

            # 预测结果
            predictions = estimator.predict(X)

            # 计算加权错误率
            incorrect = (predictions != y)
            error = np.sum(sample_weights * incorrect) / np.sum(sample_weights)

            # 若错误率为0或大于等于0.5,则停止训练
            if error <= 0 or error >= 0.5:
                break

            # 计算基学习器权重
            alpha = self.learning_rate * 0.5 * np.log((1 - error) / error)

            # 更新样本权重
            sample_weights *= np.exp(-alpha * y * predictions)
            # 归一化权重
            sample_weights /= np.sum(sample_weights)

            # 保存基学习器和其权重
            self.estimators.append(estimator)
            self.estimator_weights.append(alpha)

        return self

    def predict(self, X):
        # 加权投票
        predictions = np.zeros(len(X))
        for alpha, estimator in zip(self.estimator_weights, self.estimators):
            predictions += alpha * estimator.predict(X)

        return np.sign(predictions)
7.2 自定义Stacking实现
class StackingClassifier:
    def __init__(self, base_classifiers, meta_classifier, n_folds=5):
        self.base_classifiers = base_classifiers
        self.meta_classifier = meta_classifier
        self.n_folds = n_folds

    def fit(self, X, y):
        # 训练基分类器
        for clf in self.base_classifiers:
            clf.fit(X, y)

        # 使用交叉验证生成元特征
        meta_features = np.zeros((X.shape[0], len(self.base_classifiers)))
        kf = KFold(n_splits=self.n_folds, shuffle=True, random_state=42)

        for i, clf in enumerate(self.base_classifiers):
            for train_idx, valid_idx in kf.split(X):
                # 在训练集上训练
                clone_clf = clone(clf)
                clone_clf.fit(X[train_idx], y[train_idx])
                # 在验证集上预测
                meta_features[valid_idx, i] = clone_clf.predict(X[valid_idx])

        # 训练元分类器
        self.meta_classifier.fit(meta_features, y)

        return self

    def predict(self, X):
        # 基分类器预测
        meta_features = np.column_stack([
            clf.predict(X) for clf in self.base_classifiers
        ])

        # 元分类器最终预测
        return self.meta_classifier.predict(meta_features)
四、提升算法
1. AdaBoost算法
1.1 基本原理
AdaBoost (Adaptive Boosting) 是最早的提升算法之一,由Freund和Schapire于1995年提出。其核心思想是:通过调整样本权重,使后续基学习器更加关注先前被错误分类的样本。
1.2 数学公式化描述
给定训练集 ,其中
对于二分类问题。
算法步骤:
(1) 初始化样本权重:
(2) 对于 :
a. 使用带权重分布 的训练集训练基学习器
。
b. 计算 的加权错误率:
c. 计算 的权重:
d. 更新样本权重分布:
其中是归一化因子,确保
是一个分布:
(3) 构建最终的强分类器:
1.3 理论保证
AdaBoost在训练集上的错误率(trainerrorrate)上界可以证明为:
只要每个基学习器的错误率(比随机猜测好),随着基学习器数量
的增加,训练错误率将指数级下降。
1.4 AdaBoost变种
(1)AdaBoost.M1:二分类版本,如上所述。
(2)AdaBoost.M2:用于多分类问题,引入伪损失概念:
(3)AdaBoost.R:用于回归问题,将回归问题转换为分类问题处理。
2. 梯度提升(Gradient Boosting)
2.1 基本原理
梯度提升(Gradient Boosting)由Friedman于2001年提出,是一个更加一般化的提升框架,它将提升过程视为一个数值优化问题,利用梯度下降来最小化损失函数。
2.2 数学公式化描述
给定损失函数 和训练集
。
算法步骤:
(1) 初始化模型:
通常对于回归问题,(样本均值);对于分类问题,可以是对数几率函数的初始值。
(2) 对于 :
a. 计算当前模型的负梯度(也称为残差或伪残差):
对于平方损失 ,负梯度就是普通残差
。
b. 拟合一个基学习器 到残差
上
c. 计算最优步长(学习率):
d. 更新模型:
其中 是收缩参数(学习率),通常取较小的值如0.1。
(3) 最终模型:
2.3 常用损失函数
(1) 平方损失(回归):
(2) 绝对损失(回归):
(3) 对数损失(分类):,其中
(4) 指数损失(分类):
(5) Huber损失(鲁棒回归):结合平方损失和绝对损失的优点
2.4 GBDT (Gradient Boosting Decision Tree)
GBDT是使用决策树作为基学习器的梯度提升方法。GBDT的每一棵树都试图拟合前面模型的残差,最终形成一个加法模型。
3. XGBoost (Extreme Gradient Boosting)
3.1 基本原理
XGBoost是由陈天奇等人开发的GBDT优化版本,通过引入正则化项和更高效的算法实现,大大提高了性能和效率。
3.2 数学公式化描述
目标函数:
其中:
是预测值
表示第
个树模型
是正则化项,定义为:
其中是叶节点数量,
是第
个叶节点的权重,
和
是控制正则化强度的参数。
迭代过程:
XGBoost采用加法训练,在第 轮添加一棵树
:
目标函数可以使用二阶泰勒展开近似为:
其中:
是损失函数对当前预测值的一阶导数
是二阶导数
树的构建:
对于具有 个叶节点的树
,定义叶节点
的样本集为
,其中
将样本映射到叶节点。
目标函数可以重写为:
最优叶节点权重为:
最优目标函数值为:
分裂增益:
对于候选分裂,增益计算为:
其中 和
分别是分裂后的左右子节点样本集合。
3.3 XGBoost的关键创新
(1) 正则化:通过正则项控制模型复杂度。
(2) 二阶近似:使用二阶导数加速优化过程。
(3) 列抽样:类似随机森林的特征子采样,减少过拟合。
(4) 稀疏感知算法:高效处理稀疏数据。
(5) 基于权重的分位数草图:高效处理连续特征。
(6) 缓存感知访问:优化数据访问模式。
(7) out-of-core计算:能够处理无法装入内存的大数据集。
4.Python代码实现
4.1AdaBoost实现示例
from sklearn.ensemble import AdaBoostClassifier
from sklearn.tree import DecisionTreeClassifier
from sklearn.datasets import make_classification
from sklearn.model_selection import train_test_split
from sklearn.metrics import accuracy_score
import numpy as np
import matplotlib.pyplot as plt
# 设置中文字体支持
plt.rcParams['font.sans-serif'] = ['SimHei']  # 用来正常显示中文标签
plt.rcParams['axes.unicode_minus'] = False  # 用来正常显示负号
# 生成数据
X, y = make_classification(n_samples=1000, n_features=10,
                          n_informative=5, n_redundant=3,
                          random_state=42)
X_train, X_test, y_train, y_test = train_test_split(X, y, test_size=0.2, random_state=42)

# 训练AdaBoost模型
base_estimator = DecisionTreeClassifier(max_depth=1)  # 决策树桩
adaboost = AdaBoostClassifier(n_estimators=50,
                             learning_rate=1.0,
                             random_state=42)
adaboost.fit(X_train, y_train)

# 预测
y_pred = adaboost.predict(X_test)
accuracy = accuracy_score(y_test, y_pred)
print(f"AdaBoost准确率: {accuracy:.4f}")

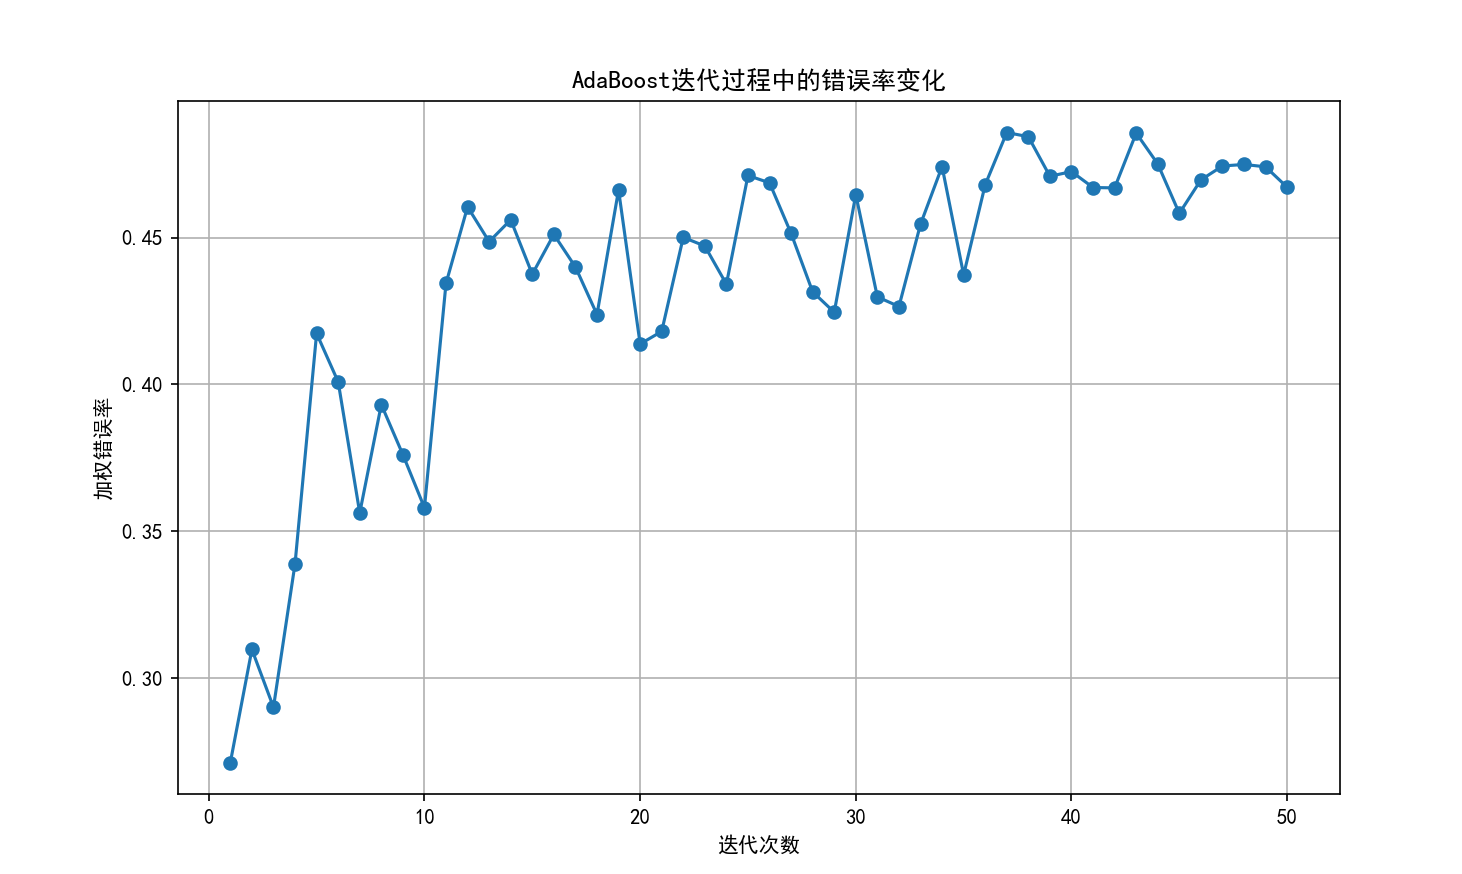
# 绘制错误率随迭代次数的变化
estimator_errors = adaboost.estimator_errors_
plt.figure(figsize=(10, 6))
plt.plot(range(1, len(estimator_errors) + 1), estimator_errors, marker='o')
plt.xlabel('迭代次数')
plt.ylabel('加权错误率')
plt.title('AdaBoost迭代过程中的错误率变化')
plt.grid(True)
plt.show()
程序运行结果如下
![]()
4.2梯度提升实现示例
from sklearn.datasets import make_classification
from sklearn.model_selection import train_test_split
from sklearn.ensemble import GradientBoostingClassifier
from sklearn.metrics import accuracy_score, log_loss
import numpy as np
import matplotlib.pyplot as plt

# 设置中文字体支持
plt.rcParams['font.sans-serif'] = ['SimHei']  # 用来正常显示中文标签
plt.rcParams['axes.unicode_minus'] = False  # 用来正常显示负号

# 生成数据
X, y = make_classification(n_samples=1000, n_features=10,
                          n_informative=5, n_redundant=3,
                          random_state=42)
X_train, X_test, y_train, y_test = train_test_split(X, y, test_size=0.2, random_state=42)

# 训练GBDT模型
gbdt = GradientBoostingClassifier(n_estimators=100,
                                learning_rate=0.1,
                                max_depth=3,
                                subsample=0.8,
                                random_state=42)
gbdt.fit(X_train, y_train)

# 预测
y_pred = gbdt.predict(X_test)
accuracy = accuracy_score(y_test, y_pred)
print(f"GBDT准确率: {accuracy:.4f}")

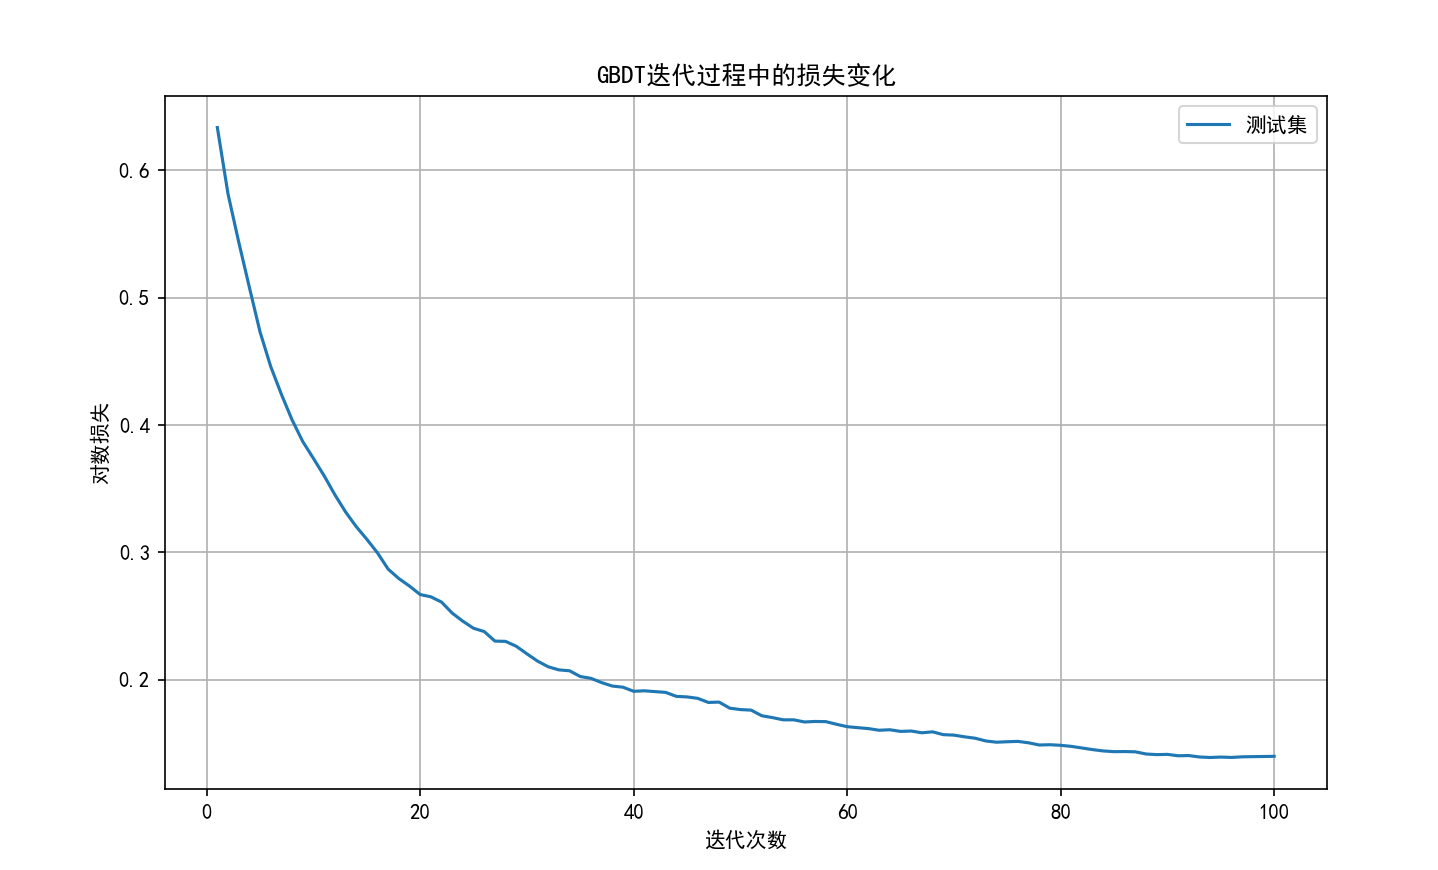
# 绘制损失函数值随迭代次数的变化
test_deviance = np.zeros((gbdt.n_estimators,), dtype=np.float64)

# 正确的方法:使用staged_predict_proba而不是gbdt.loss
for i, y_proba in enumerate(gbdt.staged_predict_proba(X_test)):
    # 使用log_loss函数计算对数损失
    test_deviance[i] = log_loss(y_test, y_proba)

plt.figure(figsize=(10, 6))
plt.plot(np.arange(gbdt.n_estimators) + 1, test_deviance, label='测试集')
plt.xlabel('迭代次数')
plt.ylabel('对数损失')
plt.title('GBDT迭代过程中的损失变化')
plt.legend()
plt.grid(True)
plt.show()

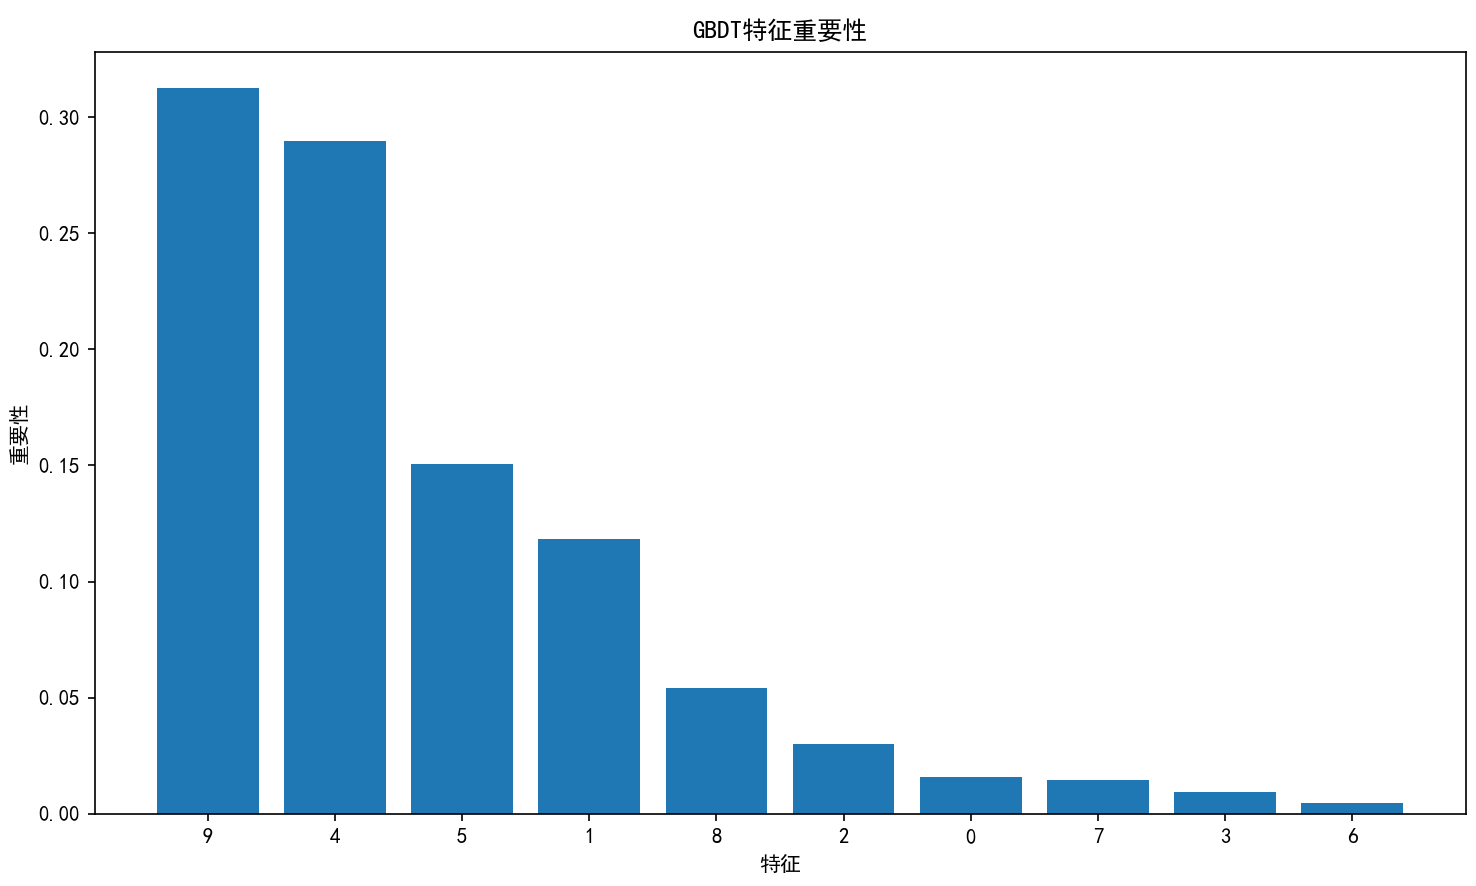
# 特征重要性
feature_importance = gbdt.feature_importances_
sorted_idx = np.argsort(feature_importance)[::-1]
plt.figure(figsize=(10, 6))
plt.bar(range(X_train.shape[1]), feature_importance[sorted_idx])
plt.xticks(range(X_train.shape[1]), sorted_idx)
plt.xlabel('特征')
plt.ylabel('重要性')
plt.title('GBDT特征重要性')
plt.tight_layout()
plt.show()

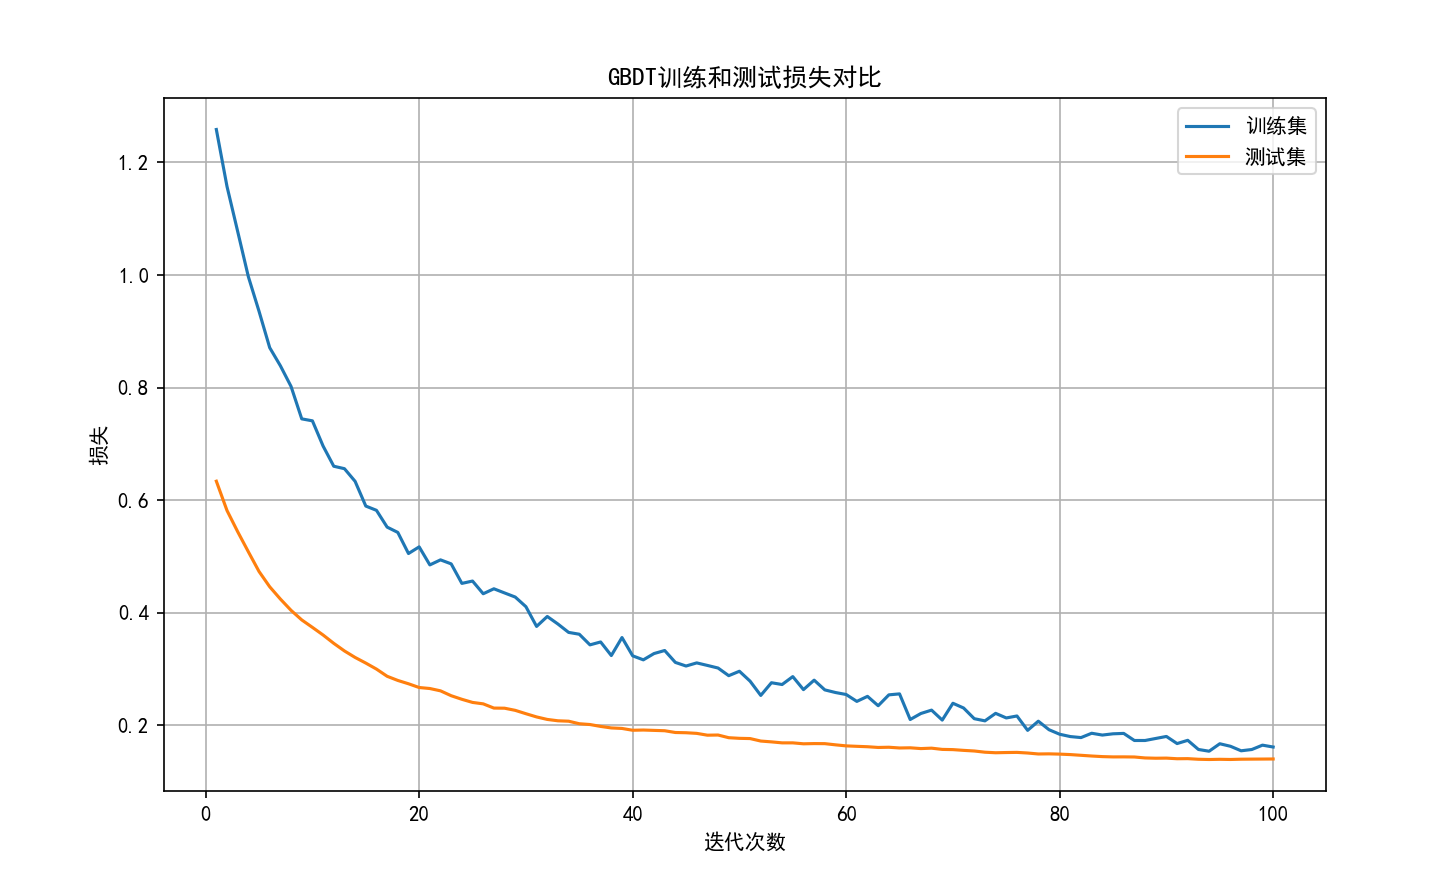
# 额外:绘制训练集损失和测试集损失的对比
plt.figure(figsize=(10, 6))
plt.plot(np.arange(gbdt.n_estimators) + 1, gbdt.train_score_, label='训练集')
plt.plot(np.arange(gbdt.n_estimators) + 1, test_deviance, label='测试集')
plt.xlabel('迭代次数')
plt.ylabel('损失')
plt.title('GBDT训练和测试损失对比')
plt.legend()
plt.grid(True)
plt.show()
程序运行结果如下
4.3 XGBoost实现示例
from sklearn.datasets import make_classification
from sklearn.model_selection import train_test_split
import xgboost as xgb
from sklearn.metrics import accuracy_score, roc_curve, auc, confusion_matrix
import matplotlib.pyplot as plt
import numpy as np
import seaborn as sns
import matplotlib as mpl
from matplotlib.font_manager import FontProperties
import platform
import os
import warnings

# 忽略字体相关警告
warnings.filterwarnings("ignore", category=UserWarning, module="matplotlib")

# 定义更可靠的字体设置函数
def setup_chinese_font():
    system = platform.system()

    # 根据操作系统选择合适的字体
    if system == 'Windows':
        font_paths = [
            'C:/Windows/Fonts/simhei.ttf',    # 黑体
            'C:/Windows/Fonts/simsun.ttc',    # 宋体
            'C:/Windows/Fonts/msyh.ttc',      # 微软雅黑
            'C:/Windows/Fonts/simfang.ttf',   # 仿宋
        ]
    elif system == 'Darwin':  # macOS
        font_paths = [
            '/System/Library/Fonts/PingFang.ttc',
            '/Library/Fonts/STHeiti Light.ttc',
            '/Library/Fonts/Songti.ttc',
        ]
    else:  # Linux
        font_paths = [
            '/usr/share/fonts/truetype/wqy/wqy-microhei.ttc',
            '/usr/share/fonts/opentype/noto/NotoSansCJK-Regular.ttc',
            '/usr/share/fonts/truetype/arphic/uming.ttc',
        ]

    # 检查字体文件是否存在,选择第一个存在的字体
    for font_path in font_paths:
        if os.path.exists(font_path):
            print(f"使用字体: {font_path}")
            return FontProperties(fname=font_path)

    # 如果没有找到任何中文字体,使用系统默认字体并报告
    print("未找到指定的中文字体文件,将尝试使用系统配置的字体")
    return None

# 设置中文字体
chinese_font = setup_chinese_font()

# 配置matplotlib全局字体设置
if chinese_font is not None:
    plt.rcParams['font.family'] = chinese_font.get_family()
    plt.rcParams['font.sans-serif'] = [chinese_font.get_name()] + plt.rcParams['font.sans-serif']
else:
    # 尝试直接设置字体名称
    plt.rcParams['font.sans-serif'] = ['SimHei', 'WenQuanYi Micro Hei', 'Microsoft YaHei',
                                       'PingFang SC', 'Heiti SC', 'STHeiti',
                                       'Source Han Sans CN', 'Noto Sans CJK SC',
                                       'DejaVu Sans', 'Arial']
plt.rcParams['axes.unicode_minus'] = False

# 设置更好看的风格
plt.style.use('ggplot')

# 生成数据
X, y = make_classification(n_samples=1000, n_features=10,
                          n_informative=5, n_redundant=3,
                          random_state=42)
X_train, X_test, y_train, y_test = train_test_split(X, y, test_size=0.2, random_state=42)

# 将数据转换为DMatrix格式
dtrain = xgb.DMatrix(X_train, label=y_train)
dtest = xgb.DMatrix(X_test, label=y_test)

# 设置参数
params = {
    'objective': 'binary:logistic',
    'eta': 0.1,
    'max_depth': 3,
    'min_child_weight': 1,
    'subsample': 0.8,
    'colsample_bytree': 0.8,
    'lambda': 1,  # L2正则化
    'alpha': 0,   # L1正则化
    'eval_metric': 'error'
}

# 创建字典用于存储评估结果
evals_result = {}

# 训练模型
num_round = 100
print("训练XGBoost模型中...")
xgb_model = xgb.train(
    params,
    dtrain,
    num_round,
    evals=[(dtrain, 'train'), (dtest, 'test')],
    evals_result=evals_result,
    early_stopping_rounds=10,
    verbose_eval=10
)

# 预测
y_pred = xgb_model.predict(dtest)
y_pred_binary = np.array([1 if p > 0.5 else 0 for p in y_pred])
accuracy = accuracy_score(y_test, y_pred_binary)
print(f"XGBoost准确率: {accuracy:.4f}")

# 辅助函数:为每个绘图添加字体属性
def add_font_to_texts(ax):
    if chinese_font is not None:
        for text in ([ax.title, ax.xaxis.label, ax.yaxis.label] +
                    ax.get_xticklabels() + ax.get_yticklabels()):
            text.set_fontproperties(chinese_font)

# 分成两个独立的图而不是子图,以避免重叠问题
# 图1:特征重要性 - Weight (单独绘制在一个图上)
plt.figure(figsize=(10, 8))
feature_importance = xgb_model.get_score(importance_type='weight')
features = list(feature_importance.keys())
importance_weight = list(feature_importance.values())
# 按重要性排序
sorted_idx = np.argsort(importance_weight)
plt.barh(range(len(sorted_idx)), [importance_weight[i] for i in sorted_idx], align='center')
plt.yticks(range(len(sorted_idx)), [features[i] for i in sorted_idx])
plt.title('特征重要性 (权重)', fontsize=14)
plt.xlabel('权重', fontsize=12)
if chinese_font:
    plt.title('特征重要性 (权重)', fontproperties=chinese_font, fontsize=14)
    plt.xlabel('权重', fontproperties=chinese_font, fontsize=12)
    plt.yticks(fontproperties=chinese_font)
plt.tight_layout()
plt.savefig('特征重要性_权重.png', dpi=300, bbox_inches='tight')
plt.show()

# 图2:特征重要性 - Gain (单独绘制在一个图上)
plt.figure(figsize=(10, 8))
feature_importance = xgb_model.get_score(importance_type='gain')
features = list(feature_importance.keys())
importance_gain = list(feature_importance.values())
# 按重要性排序
sorted_idx = np.argsort(importance_gain)
plt.barh(range(len(sorted_idx)), [importance_gain[i] for i in sorted_idx], align='center')
plt.yticks(range(len(sorted_idx)), [features[i] for i in sorted_idx])
plt.title('特征重要性 (增益值)', fontsize=14)
plt.xlabel('增益值', fontsize=12)
if chinese_font:
    plt.title('特征重要性 (增益值)', fontproperties=chinese_font, fontsize=14)
    plt.xlabel('增益值', fontproperties=chinese_font, fontsize=12)
    plt.yticks(fontproperties=chinese_font)
plt.tight_layout()
plt.savefig('特征重要性_增益值.png', dpi=300, bbox_inches='tight')
plt.show()

# 创建2x2布局的图表,包含ROC曲线、误差变化、混淆矩阵和概率分布
fig, axes = plt.subplots(2, 2, figsize=(16, 14))

# 1. 绘制ROC曲线
fpr, tpr, _ = roc_curve(y_test, y_pred)
roc_auc = auc(fpr, tpr)
axes[0, 0].plot(fpr, tpr, color='darkorange', lw=2, label=f'ROC曲线 (AUC = {roc_auc:.3f})')
axes[0, 0].plot([0, 1], [0, 1], color='navy', lw=2, linestyle='--')
axes[0, 0].set_xlim([0.0, 1.0])
axes[0, 0].set_ylim([0.0, 1.05])
axes[0, 0].set_xlabel('假阳性率', fontsize=12)
axes[0, 0].set_ylabel('真阳性率', fontsize=12)
axes[0, 0].set_title('ROC曲线', fontsize=14)
axes[0, 0].legend(loc="lower right")
if chinese_font:
    axes[0, 0].set_xlabel('假阳性率', fontproperties=chinese_font, fontsize=12)
    axes[0, 0].set_ylabel('真阳性率', fontproperties=chinese_font, fontsize=12)
    axes[0, 0].set_title('ROC曲线', fontproperties=chinese_font, fontsize=14)
    for text in axes[0, 0].get_legend().get_texts():
        text.set_fontproperties(chinese_font)

# 2. 训练过程中的误差变化
epochs = len(evals_result['train']['error'])
x_axis = range(0, epochs)
axes[0, 1].plot(x_axis, evals_result['train']['error'], label='训练集误差', marker='o', markersize=3)
axes[0, 1].plot(x_axis, evals_result['test']['error'], label='测试集误差', marker='s', markersize=3)
axes[0, 1].grid(True)
axes[0, 1].legend()
axes[0, 1].set_xlabel('迭代次数', fontsize=12)
axes[0, 1].set_ylabel('分类误差', fontsize=12)
axes[0, 1].set_title('XGBoost训练过程误差变化', fontsize=14)
if chinese_font:
    axes[0, 1].set_xlabel('迭代次数', fontproperties=chinese_font, fontsize=12)
    axes[0, 1].set_ylabel('分类误差', fontproperties=chinese_font, fontsize=12)
    axes[0, 1].set_title('XGBoost训练过程误差变化', fontproperties=chinese_font, fontsize=14)
    for text in axes[0, 1].get_legend().get_texts():
        text.set_fontproperties(chinese_font)

# 3. 混淆矩阵
cm = confusion_matrix(y_test, y_pred_binary)
sns.heatmap(cm, annot=True, fmt='d', cmap='Blues', cbar=False, ax=axes[1, 0])
axes[1, 0].set_xlabel('预测标签', fontsize=12)
axes[1, 0].set_ylabel('真实标签', fontsize=12)
axes[1, 0].set_title('混淆矩阵', fontsize=14)
if chinese_font:
    axes[1, 0].set_xlabel('预测标签', fontproperties=chinese_font, fontsize=12)
    axes[1, 0].set_ylabel('真实标签', fontproperties=chinese_font, fontsize=12)
    axes[1, 0].set_title('混淆矩阵', fontproperties=chinese_font, fontsize=14)

# 4. 预测概率分布
axes[1, 1].hist(y_pred, bins=20, alpha=0.5, label='所有样本')
axes[1, 1].hist(y_pred[y_test==1], bins=20, alpha=0.5, label='正样本')
axes[1, 1].hist(y_pred[y_test==0], bins=20, alpha=0.5, label='负样本')
axes[1, 1].set_xlabel('预测概率', fontsize=12)
axes[1, 1].set_ylabel('样本数量', fontsize=12)
axes[1, 1].set_title('预测概率分布', fontsize=14)
axes[1, 1].legend()
if chinese_font:
    axes[1, 1].set_xlabel('预测概率', fontproperties=chinese_font, fontsize=12)
    axes[1, 1].set_ylabel('样本数量', fontproperties=chinese_font, fontsize=12)
    axes[1, 1].set_title('预测概率分布', fontproperties=chinese_font, fontsize=14)
    for text in axes[1, 1].get_legend().get_texts():
        text.set_fontproperties(chinese_font)

plt.tight_layout(pad=3.0)  # 增加子图之间的间距
plt.savefig('xgboost模型评估.png', dpi=300, bbox_inches='tight')
plt.show()

# 计算和展示主要评估指标
from sklearn.metrics import precision_score, recall_score, f1_score, precision_recall_curve

precision = precision_score(y_test, y_pred_binary)
recall = recall_score(y_test, y_pred_binary)
f1 = f1_score(y_test, y_pred_binary)

print(f"精确率 (Precision): {precision:.4f}")
print(f"召回率 (Recall): {recall:.4f}")
print(f"F1分数: {f1:.4f}")
print(f"AUC: {roc_auc:.4f}")

# 绘制精确率-召回率曲线
plt.figure(figsize=(10, 8))
precision_curve, recall_curve, thresholds = precision_recall_curve(y_test, y_pred)
plt.plot(recall_curve, precision_curve, lw=2, label='PR曲线')
plt.grid(True)
plt.xlabel('召回率', fontsize=12)
plt.ylabel('精确率', fontsize=12)
plt.title('精确率-召回率曲线', fontsize=14)
plt.legend()
if chinese_font:
    plt.xlabel('召回率', fontproperties=chinese_font, fontsize=12)
    plt.ylabel('精确率', fontproperties=chinese_font, fontsize=12)
    plt.title('精确率-召回率曲线', fontproperties=chinese_font, fontsize=14)
    for text in plt.legend().get_texts():
        text.set_fontproperties(chinese_font)
plt.tight_layout()
plt.savefig('xgboost_PR曲线.png', dpi=300, bbox_inches='tight')
plt.show()

# 特征重要性分析 - 输出具体数值
print("\n特征重要性排名:")
importance = xgb_model.get_score(importance_type='gain')
sorted_importance = sorted(importance.items(), key=lambda x: x[1], reverse=True)
for feature, score in sorted_importance:
    print(f"{feature}: {score:.4f}")
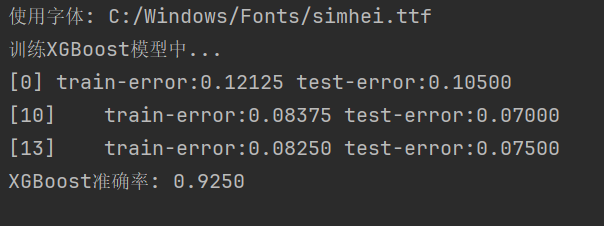
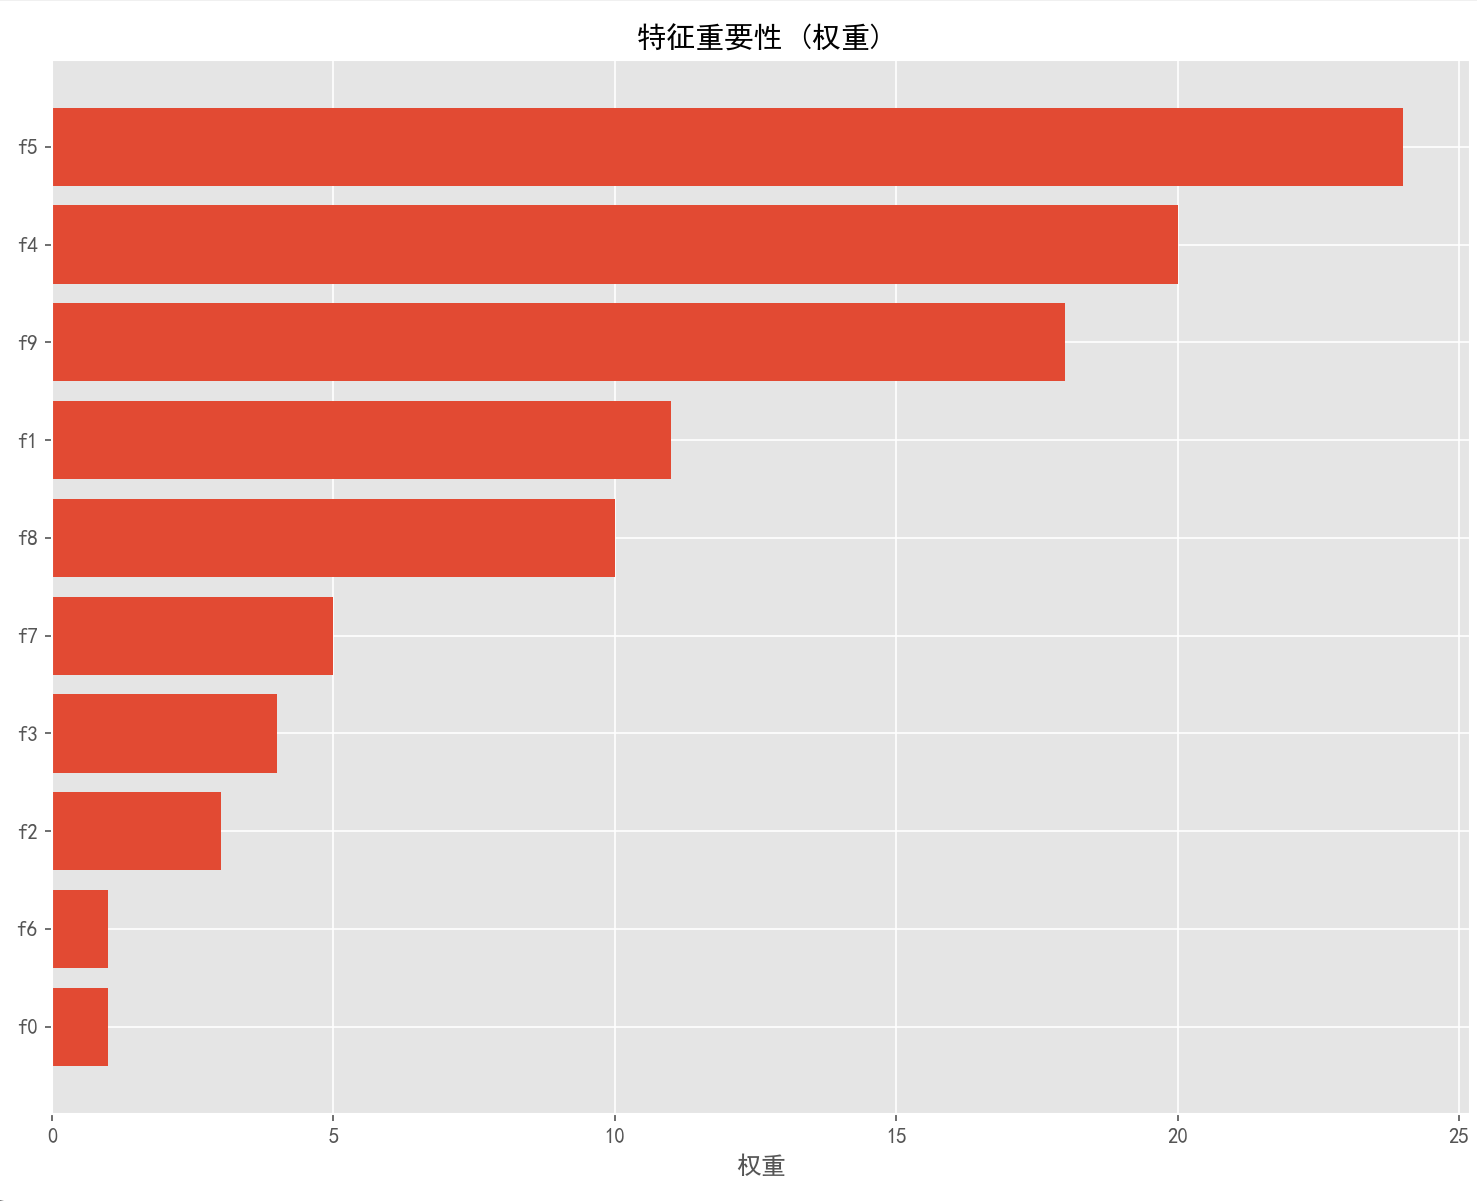
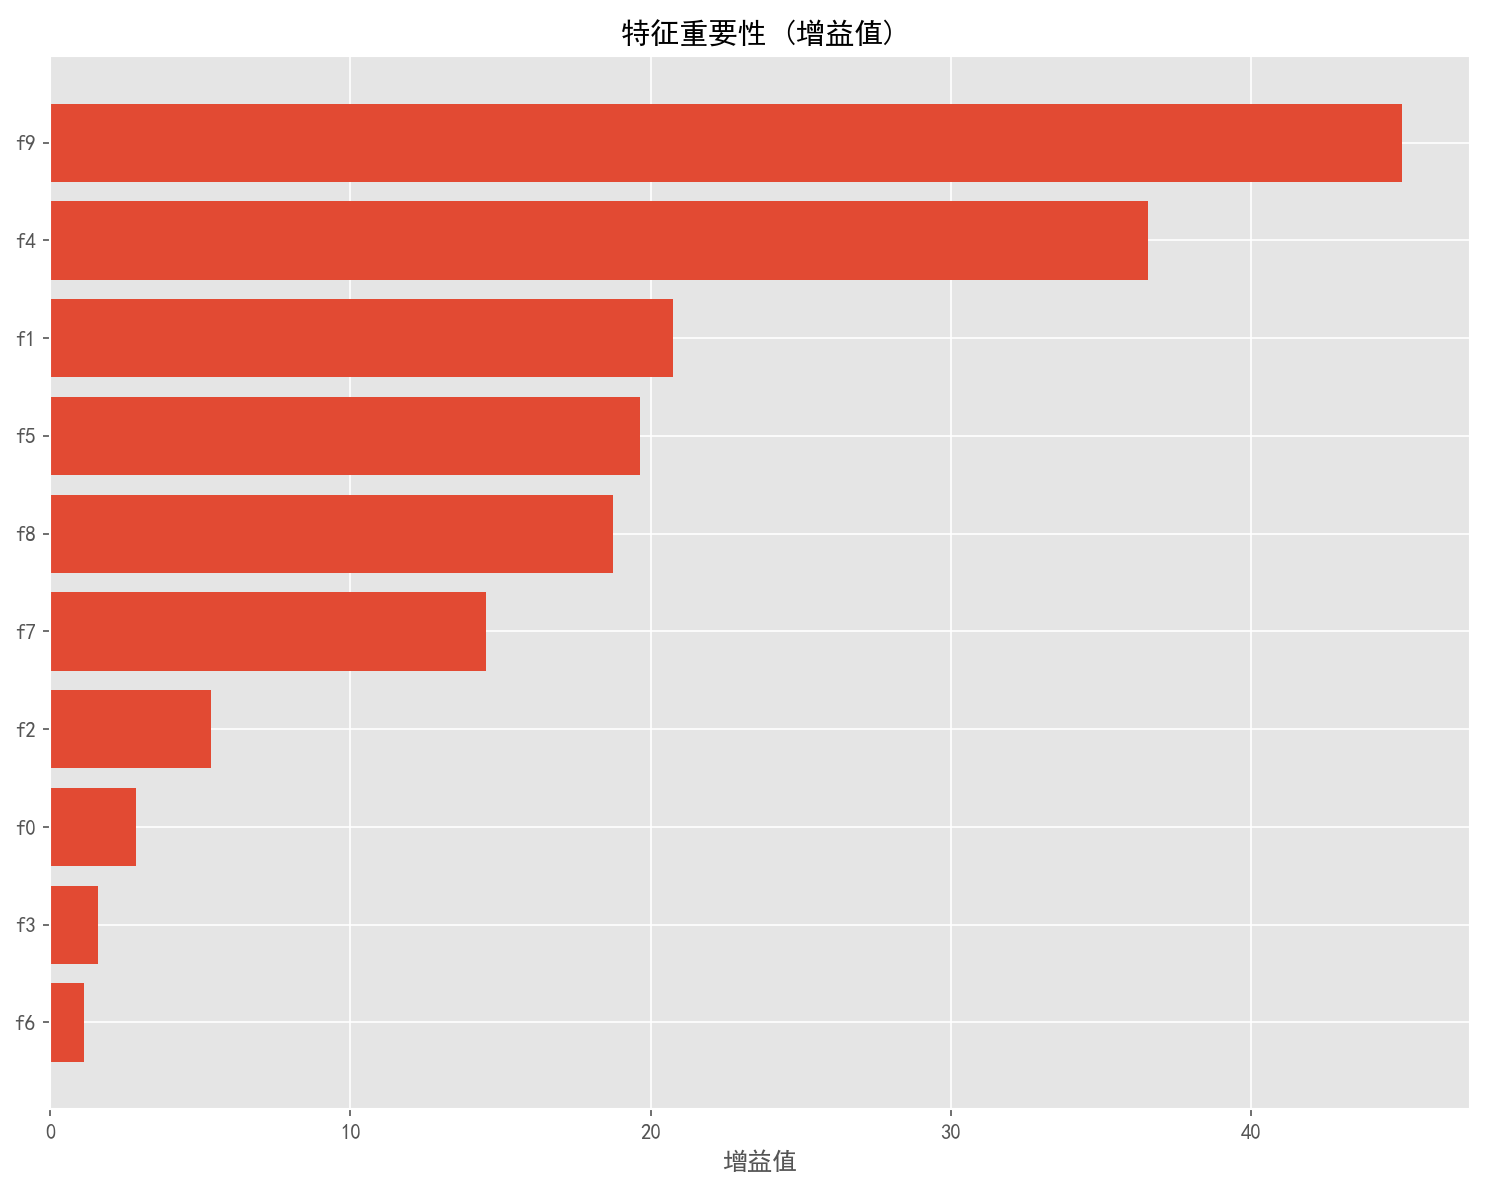
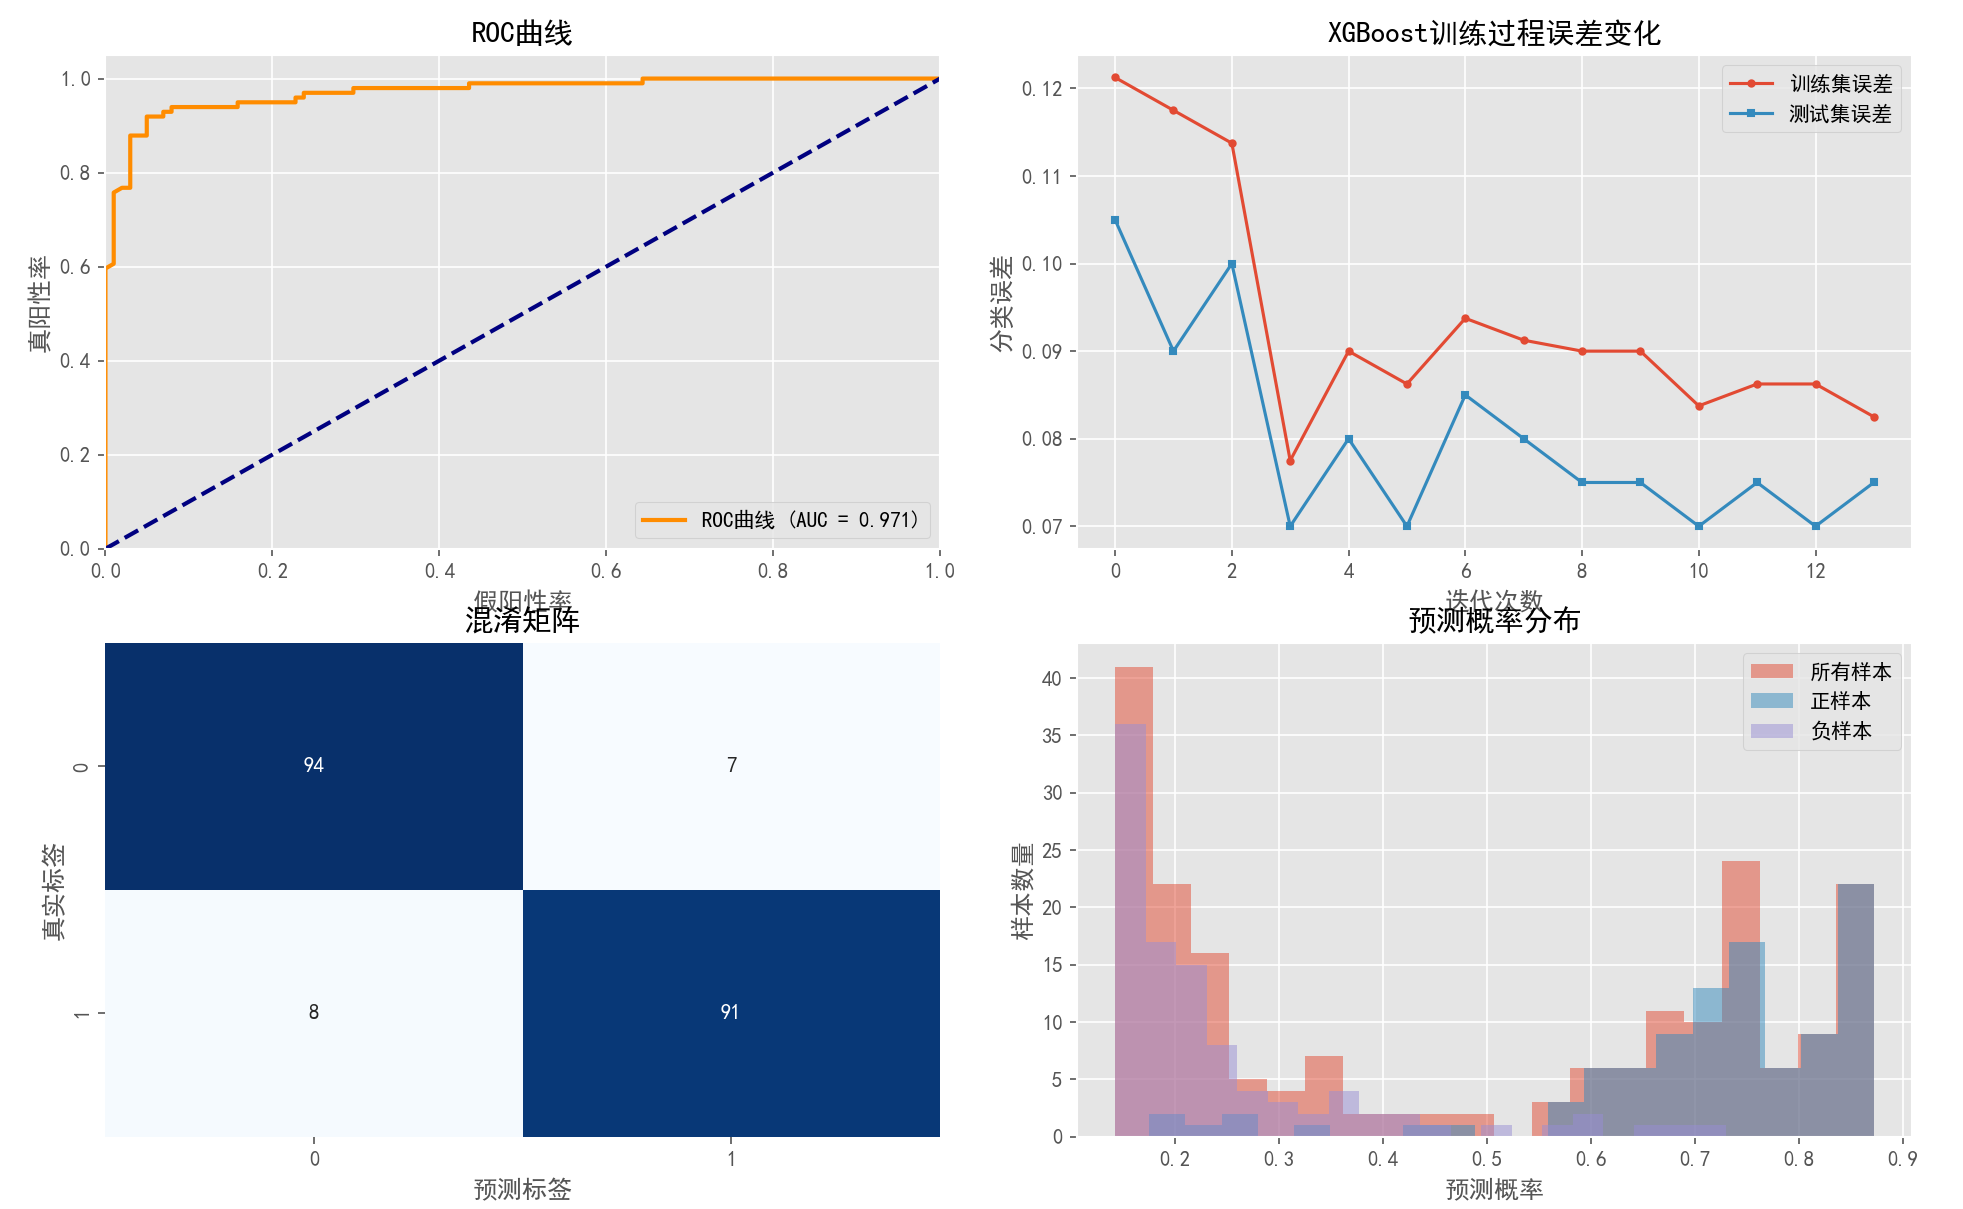
程序运行结果如下:
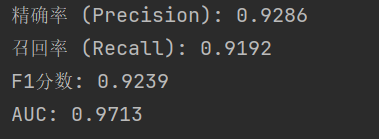
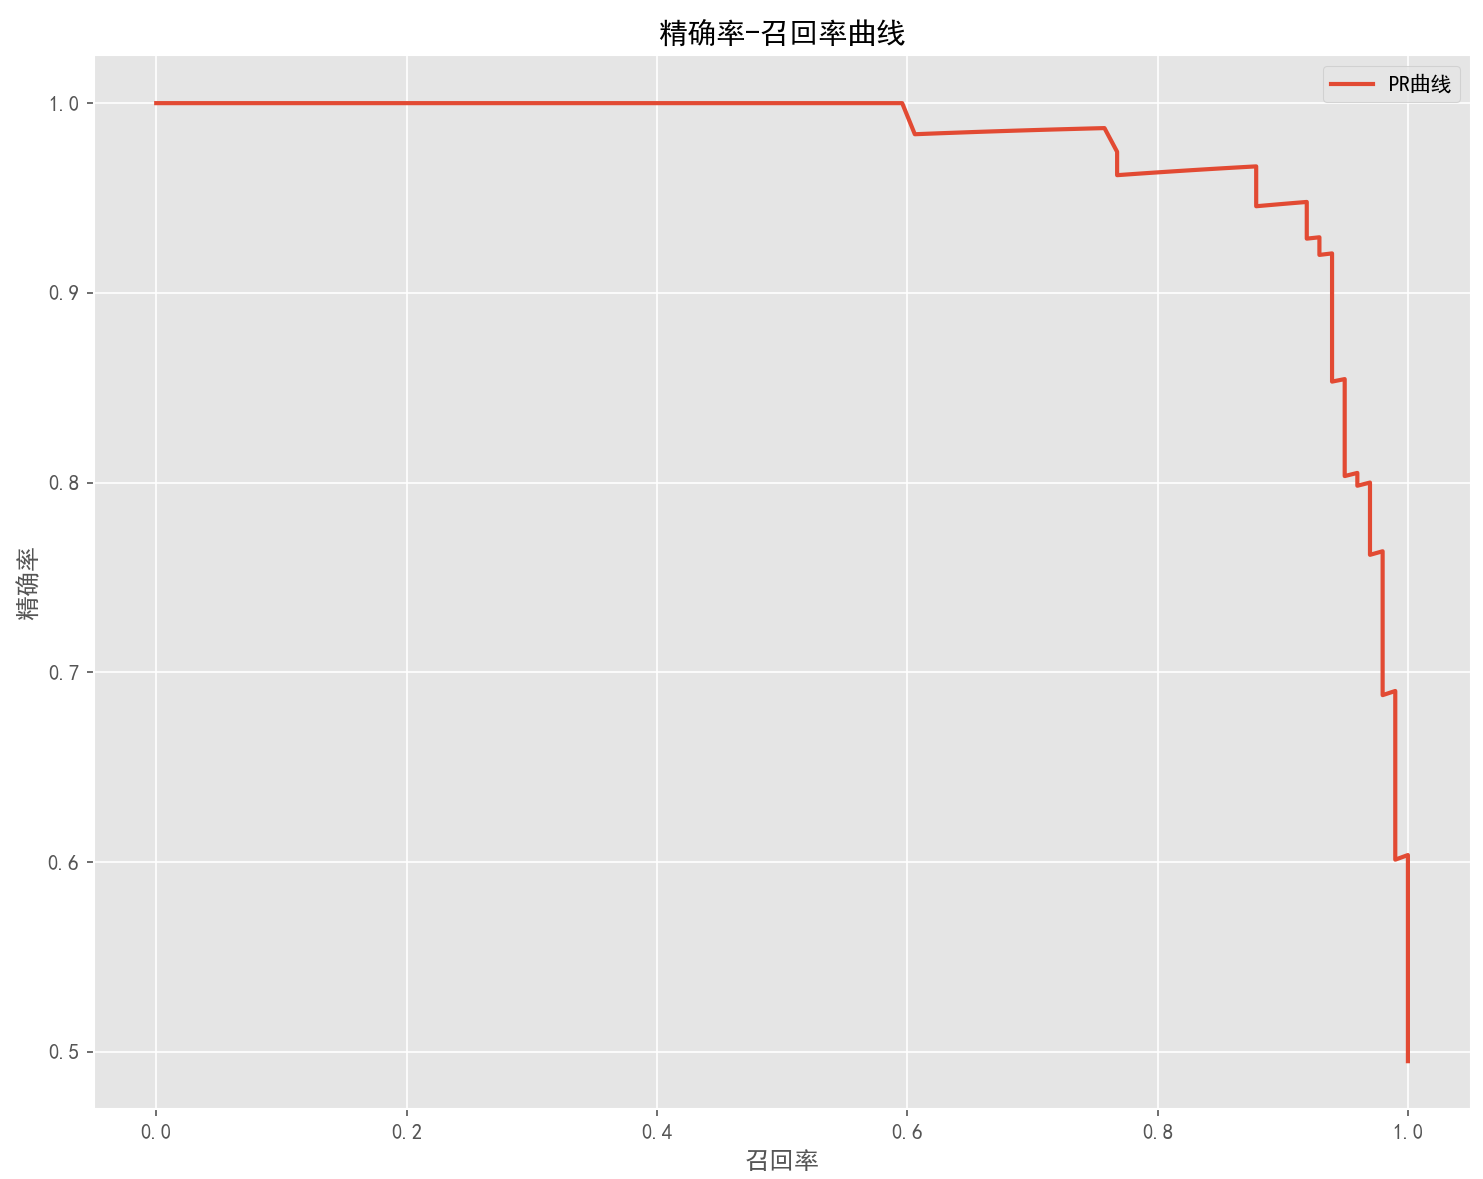
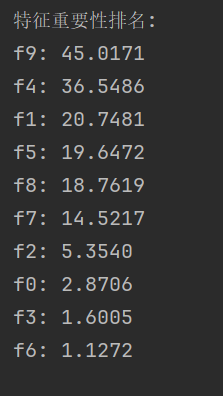
五、Python代码实现集成学习与梯度提升决策树的实验
(一)实验内容和实验步骤
1. 实验准备与环境设置
1.1 导入必要库
首先导入所需的Python库,包括数据处理(NumPy)、可视化(Matplotlib、Seaborn)、机器学习模型(scikit-learn)等。特别注意导入了集成学习相关的类,如BaggingClassifier、RandomForestClassifier、AdaBoostClassifier等。
1.2 环境配置
(1)创建结果保存目录(ensemble_learning_results)。
(2) 配置matplotlib以支持中文显示。
(3) 设置临时文件夹和警告抑制。
(4) 生成时间戳用于唯一命名图片文件。
1.3 数据集生成
使用`make_classification`函数创建一个具有以下特性的合成分类数据集:
(1) 1000个样本。
(2) 16维特征。
(3) 5个信息特征和2个冗余特征。
(4) 2个类别。
(5) 10%的标签噪声。
然后将数据集分为80%训练集和20%测试集,用于后续算法评估。
2. Bagging和随机森林算法实现
2.1 RandomForest类实现
理论基础
Bagging(Bootstrap Aggregating)通过对训练集进行自助采样(有放回抽样),构建多个训练子集,然后在每个子集上训练一个基本分类器。随机森林是Bagging的一个特例,它使用决策树作为基学习器,并在树的生长过程中随机选择特征子集。
数学公式:
对于分类问题,最终预测为:。
Bagging和随机森林的主要区别在于:Bagging使用所有特征构建决策树,而随机森林在每个节点只使用特征的随机子集(通常为个)。
代码实现
`RandomForest`类包含:
初始化:
def __init__(self, n_trees=10, max_features='sqrt'):

    self.n_trees = n_trees  # 树的数量

    self.oob_score = 0      # 袋外样本评分

    self.trees = [DTC(max_features=max_features) for _ in range(n_trees)]  # 决策树列表
训练过程(fit方法):
(1) 对每棵树进行自助采样训练。
(2) 记录每个样本的袋外预测。
(3) 计算袋外样本的准确率作为OOB分数。
预测过程:
(1) 获取每棵树的预测概率。
(2) 计算平均概率。
(3) 返回概率最高的类别。
2.2 Bagging与随机森林对比实验
在相同的数据集上分别训练Bagging和随机森林模型,对比不同树数量(1到100棵树)下的训练集性能和OOB分数:
Bagging:`max_features=None`(使用全部特征)
随机森林:`max_features='sqrt'`(使用特征数量的平方根)
实验结果通过曲线图可视化,展示了:
(1) 随着树数量增加,两种算法的性能均提高。
(2) Bagging在训练集上表现更好但可能过拟合。
(3) 随机森林OOB分数通常高于Bagging。
2.3 与sklearn库实现对比
训练scikit-learn的BaggingClassifier和RandomForestClassifier与手动实现进行对比,验证实现的正确性。
3. Stacking(堆叠集成)算法实现
3.1 理论基础
Stacking通过训练一个元学习器(meta-learner)来组合多个基学习器的预测结果。为了防止过拟合,通常使用K折交叉验证生成元特征。
数学原理:
对于个基学习器,第
个基学习器的预测为:
元学习器的输入为:
最终预测为:
3.2 实现步骤
SimpleNeuralNetwork类:
实现了一个简单的神经网络,用作元分类器
包含一个隐藏层,使用sigmoid激活函数
实现了前向传播和反向传播算法
StackingClassifier类:
class StackingClassifier():

    def __init__(self, classifiers, meta_classifier, concat_feature=False, kfold=5):

        # 初始化参数和基分类器
训练过程(fit方法):
(1) 对每个基分类器:
a. 使用K折交叉验证生成元特征。
b. 在每一折上训练基分类器。
c. 在验证集上预测,获得概率预测作为元特征。
(2) 将所有元特征合并(可选添加原始特征)。
(3) 使用元特征训练元分类器。
预测过程:
(1) 生成测试数据的元特征。
(2) 使用元分类器进行最终预测。
3.3 实验分析
实验评估了使用不同元分类器(逻辑回归、决策树、神经网络)的堆叠模型性能,以及是否添加原始特征的影响。
4. AdaBoost算法实现
4.1 理论基础
AdaBoost是一种自适应增强算法,通过迭代训练一系列弱分类器,每次关注上一轮分类错误的样本,最终加权组合所有弱分类器。
关键数学公式:
计算基分类器权重:,其中
是加权错误率
更新样本权重:
最终分类器:
4.2 实现细节
DecisionStump类:
class DecisionStump:

    def __init__(self):

        self.polarity = 1  # 划分方向(+1或-1)

        self.feature_idx = None  # 使用哪个特征

        self.threshold = None  # 阈值

        self.alpha = None  # 分类器权重
AdaBoost类:
class AdaBoost:

    def __init__(self, n_estimators=50):

        self.n_estimators = n_estimators  # 基分类器数量

        self.stumps = []  # 存储所有决策树桩
训练过程(fit方法):
(1) 初始化样本权重为均匀分布。
(2) 对每次迭代:
a. 在所有特征和阈值组合中找到最佳决策树桩(最小加权错误率)。
b. 计算该分类器的权重alpha。
c. 更新样本权重(提高错分样本的权重)。
d. 保存基分类器。
预测过程:
(1) 计算所有决策树桩的加权和。
(2) 返回符号值(正负表示类别)。
4.3 评估与可视化
实验包括了多种评估方式:
(1) 在测试集上计算准确率。
(2) 可视化样本权重变化过程。
(3) 展示基分类器错误率和权重变化。
(4) 可视化决策边界的演变过程。
(5) 在不同复杂度数据集上的表现分析。
5. XGBoost算法实现
5.1 理论基础
XGBoost(Extreme Gradient Boosting)是梯度提升决策树(GBDT)的高效实现,它通过梯度和二阶导数(Hessian)来指导优化。
关键数学公式:
目标函数:
使用泰勒展开近似:
其中和
分别是损失函数的一阶和二阶导数
5.2 实现细节
XGBoostTree类:处理单棵树的构建和预测
class XGBoostTree:

    def __init__(self, max_depth=3, min_child_weight=1, gamma=0):

        # 初始化树参数
构建树过程(_build_tree方法):
(1) 计算当前节点的梯度和Hessian。
(2) 如果达到停止条件(最大深度或最小样本权重),创建叶节点。
(3) 在所有特征和阈值组合中找到最佳分裂点(最大增益)。
(4) 递归构建左右子树。
SimpleXGBoost类:管理多棵树的训练和预测
class SimpleXGBoost:

    def __init__(self, n_estimators=10, learning_rate=0.1, max_depth=3, min_child_weight=1, gamma=0):

        # 初始化参数
训练过程(fit方法):
(1) 初始预测值为目标均值。
(2) 对每次迭代:
a. 计算当前梯度和Hessian。
b. 构建新树拟合这些梯度。
c. 以学习率为步长更新预测值。
d. 保存树模型。
预测过程:
(1) 从初始预测值开始
(2) 累加每棵树乘以学习率的预测值
5.3 实验分析
实验包括:
(1) 与sklearn的GradientBoostingRegressor对比性能。
(2) 可视化特征重要性。
(3) 分析学习率对性能的影响。
(4) 分析树深度对性能的影响。
(5) 残差图和预测值vs实际值对比。
6. 性能评估与比较
6.1 评估指标
分类任务:准确率(Accuracy)
回归任务:R²决定系数(越接近1越好)
6.2 集成学习算法比较
对所有算法进行了统一数据集上的性能对比,包括:
(1) 手动实现的随机森林和AdaBoost。
(2) scikit-learn的RandomForestClassifier、AdaBoostClassifier、GradientBoostingClassifier和BaggingClassifier。
6.3 超参数调优
对RandomForestClassifier进行了网格搜索(GridSearchCV),优化:
n_estimators:树的数量
max_features:每个节点考虑的特征数
max_depth:树的最大深度
6.4 最终模型比较
比较了各种集成模型在测试集上的性能,并通过条形图可视化结果,将性能最好的模型突出显示。
7. 结果分析与可视化
7.1 随机森林分析
特征重要性可视化:识别模型中最重要的特征
混淆矩阵:展示分类错误的类型和分布
分类报告:包括精确率、召回率和F1分数
7.2 AdaBoost详细分析
样本权重变化过程:展示算法如何关注困难样本
基学习器错误率和权重变化:展示弱学习器如何组合成强学习器
决策边界演变:可视化模型学习过程
不同数据集性能:测试模型在不同复杂度数据上的表现
7.3 XGBoost分析
特征重要性:展示每个特征对预测的贡献
超参数敏感性分析:学习率和树深度的影响
残差分析:检查模型预测误差的分布
(二)Python代码完整实现
完整的Python代码如下:
print('集成学习与梯度提升决策树的实验开始')
import numpy as np
import matplotlib.pyplot as plt
from tqdm import tqdm
from sklearn.datasets import make_classification, make_friedman1
from sklearn.model_selection import train_test_split
from sklearn.tree import DecisionTreeClassifier as DTC
from sklearn.tree import DecisionTreeRegressor as DTR
from sklearn.linear_model import LogisticRegression as LR
from sklearn.neighbors import KNeighborsClassifier as KNC
from sklearn.neighbors import KNeighborsRegressor as KNR
from sklearn.linear_model import LinearRegression as LR_Reg
from sklearn.model_selection import KFold
from sklearn.base import clone
from sklearn.metrics import confusion_matrix, classification_report, accuracy_score
from sklearn.model_selection import GridSearchCV, cross_val_score
import seaborn as sns
from sklearn.datasets import make_circles, make_moons, make_gaussian_quantiles
# 添加缺少的导入
from sklearn.ensemble import (
BaggingClassifier, RandomForestClassifier, AdaBoostClassifier,
GradientBoostingClassifier, GradientBoostingRegressor
)
import warnings
import tempfile
import os
import matplotlib as mpl
import datetime
warnings.filterwarnings("ignore", message="Font.*glyph for.*")
# 创建保存图片的目录
results_dir = "ensemble_learning_results"
if not os.path.exists(results_dir):
os.makedirs(results_dir)
# 获取当前时间戳,用于图像文件命名,避免覆盖
timestamp = datetime.datetime.now().strftime("%Y%m%d_%H%M%S")
# 设置中文字体支持
plt.rcParams['font.sans-serif'] = ['SimHei'] # 用来正常显示中文标签
plt.rcParams['axes.unicode_minus'] = False # 用来正常显示负号
# 为joblib设置临时文件夹到只包含ASCII字符的路径
temp_folder = tempfile.mkdtemp(prefix='sklearn_')
os.environ['JOBLIB_TEMP_FOLDER'] = temp_folder
# 忽略警告
warnings.filterwarnings('ignore')
print('动手实现决策树的bagging算法和随机森林算法')
# 创建随机数据集
X, y = make_classification(
n_samples=1000, # 数据集大小
n_features=16, # 特征数,即特征维度
n_informative=5, # 有效特征个数
n_redundant=2, # 冗余特征个数,为有效特征的随即线性组合
n_classes=2, # 类别数
flip_y=0.1, # 类别随机的样本个数,该值越大,分类越困难
random_state=0 # 随机种子
)
print(f"数据集形状: {X.shape}, 类别分布: {np.bincount(y)}")
# 划分训练集和测试集 - 这是主要数据集,用于大多数实验
X_train, X_test, y_train, y_test = train_test_split(X, y, test_size=0.2, random_state=0)
# 定义随机森林类
class RandomForest():
def __init__(self, n_trees=10, max_features='sqrt'):
self.n_trees = n_trees
self.oob_score = 0
self.trees = [DTC(max_features=max_features) for _ in range(n_trees)]
# 用X和y训练模型
def fit(self, X, y):
n_samples, n_features = X.shape
self.n_classes = np.unique(y).shape[0]
# 集成模型的预测,累加单个模型预测的分类概率,再取较大值作为最终分类
ensemble = np.zeros((n_samples, self.n_classes))
for tree in self.trees:
# 自举采样,该采样允许重复
idx = np.random.randint(0, n_samples, n_samples)
# 没有被采到的样本
unsampled_mask = np.bincount(idx, minlength=n_samples) == 0
unsampled_idx = np.arange(n_samples)[unsampled_mask]
# 训练当前决策树
tree.fit(X[idx], y[idx])
# 累加决策树对OOB样本的预测
if len(unsampled_idx) > 0: # 确保有OOB样本
ensemble[unsampled_idx] += tree.predict_proba(X[unsampled_idx])
# 计算OOB分数,由于是分类问题,我们用准确率来衡量
# 确保所有样本至少被一个模型作为OOB样本
valid_samples = np.sum(ensemble, axis=1) > 0
if np.any(valid_samples):
self.oob_score = np.mean(y[valid_samples] == np.argmax(ensemble[valid_samples], axis=1))
else:
self.oob_score = 0
# 预测类别
def predict(self, X):
proba = self.predict_proba(X)
return np.argmax(proba, axis=1)
def predict_proba(self, X):
# 取所有决策树预测概率的平均
ensemble = np.mean([tree.predict_proba(X) for tree in self.trees], axis=0)
return ensemble
# 计算准确率
def score(self, X, y):
return np.mean(y == self.predict(X))
# 算法测试与可视化
num_trees = np.arange(1, 101, 5)
np.random.seed(0)
plt.figure(figsize=(10, 6))
# bagging算法
oob_score = []
train_score = []
with tqdm(num_trees) as pbar:
for n_tree in pbar:
rf = RandomForest(n_trees=n_tree, max_features=None)
rf.fit(X, y)
train_score.append(rf.score(X, y))
oob_score.append(rf.oob_score)
pbar.set_postfix({
'n_tree': n_tree,
'train_score': train_score[-1],
'oob_score': oob_score[-1]
})
plt.plot(num_trees, train_score, color='blue', label='bagging_train_score')
plt.plot(num_trees, oob_score, color='blue', ls='-.', label='bagging_oob_score')
# 随机森林算法
oob_score = []
train_score = []
with tqdm(num_trees) as pbar:
for n_tree in pbar:
rf = RandomForest(n_trees=n_tree, max_features='sqrt')
rf.fit(X, y)
train_score.append(rf.score(X, y))
oob_score.append(rf.oob_score)
pbar.set_postfix({
'n_tree': n_tree,
'train_score': train_score[-1],
'oob_score': oob_score[-1]
})
plt.plot(num_trees, train_score, color='red', ls='--', label='random_forest_train_score')
plt.plot(num_trees, oob_score, color='red', ls=':', label='random_forest_oob_score')
plt.ylabel('Score')
plt.xlabel('Number of trees')
plt.legend()
plt.title('Bagging vs Random Forest (手动实现)')
plt.grid(True, linestyle='--', alpha=0.7)
# 保存图片
plt.savefig(os.path.join(results_dir, f"{timestamp}_bagging_vs_rf.png"), dpi=300, bbox_inches='tight')
plt.show()
# 使用sklearn库进行对比
print('用sklearn中的bagging算法和随机森林算法在同样的数据集上进行测试,与动手实现的算法的结果进行比较,验证实验的正确性。')
# 在新版本sklearn中,base_estimator已被废弃,改用estimator参数
bc = BaggingClassifier(estimator=DTC(), n_estimators=100, oob_score=True, random_state=0)
bc.fit(X, y)
print('bagging:', bc.oob_score_)
rfc = RandomForestClassifier(n_estimators=100, max_features='sqrt', oob_score=True, random_state=0)
rfc.fit(X, y)
print('随机森林:', rfc.oob_score_)
# ============= 自定义神经网络元分类器 =============
print('\n自定义神经网络作为元分类器')
class SimpleNeuralNetwork:
def __init__(self, input_size, hidden_size=10, output_size=2, learning_rate=0.01, epochs=100):
self.input_size = input_size
self.hidden_size = hidden_size
self.output_size = output_size
self.learning_rate = learning_rate
self.epochs = epochs
# 初始化权重
self.W1 = np.random.randn(input_size, hidden_size) * 0.01
self.b1 = np.zeros((1, hidden_size))
self.W2 = np.random.randn(hidden_size, output_size) * 0.01
self.b2 = np.zeros((1, output_size))
def sigmoid(self, x):
return 1 / (1 + np.exp(-np.clip(x, -500, 500)))
def softmax(self, x):
exp_x = np.exp(x - np.max(x, axis=1, keepdims=True))
return exp_x / np.sum(exp_x, axis=1, keepdims=True)
def forward(self, X):
# 前向传播
self.z1 = np.dot(X, self.W1) + self.b1
self.a1 = self.sigmoid(self.z1)
self.z2 = np.dot(self.a1, self.W2) + self.b2
self.a2 = self.softmax(self.z2)
return self.a2
def fit(self, X, y):
# 将y转换为one-hot编码
y_onehot = np.zeros((len(y), self.output_size))
for i in range(len(y)):
y_onehot[i, y[i]] = 1
# 训练
for _ in range(self.epochs):
# 前向传播
output = self.forward(X)
# 反向传播
delta2 = output - y_onehot
dW2 = np.dot(self.a1.T, delta2)
db2 = np.sum(delta2, axis=0, keepdims=True)
delta1 = np.dot(delta2, self.W2.T) * (self.a1 * (1 - self.a1))
dW1 = np.dot(X.T, delta1)
db1 = np.sum(delta1, axis=0)
# 更新权重
self.W2 -= self.learning_rate * dW2
self.b2 -= self.learning_rate * db2
self.W1 -= self.learning_rate * dW1
self.b1 -= self.learning_rate * db1
def predict_proba(self, X):
return self.forward(X)
def predict(self, X):
return np.argmax(self.predict_proba(X), axis=1)
def score(self, X, y):
return np.mean(self.predict(X) == y)
# ============= 堆垛算法 =============
print('\n动手实现堆垛算法')
# 堆垛分类器
class StackingClassifier():
def __init__(
self,
classifiers, # 基分类器
meta_classifier, # 元分类器
concat_feature=False, # 是否将原始样本拼接在新数据上
kfold=5 # K折交叉验证
):
self.classifiers = classifiers
self.meta_classifier = meta_classifier
self.concat_feature = concat_feature
self.kf = KFold(n_splits=kfold)
# 为了在测试时计算平均,我们需要保留每个分类器
self.k_fold_classifiers = []
def fit(self, X, y):
# 用X和y训练基分类器和元分类器
n_samples, n_features = X.shape
self.n_classes = np.unique(y).shape[0]
if self.concat_feature:
features = X
else:
features = np.zeros((n_samples, 0))
for classifier in self.classifiers:
self.k_fold_classifiers.append([])
# 训练每个基分类器
predict_proba = np.zeros((n_samples, self.n_classes))
for train_idx, test_idx in self.kf.split(X):
# 交叉验证
clf = clone(classifier)
clf.fit(X[train_idx], y[train_idx])
predict_proba[test_idx] = clf.predict_proba(X[test_idx]) # 修正的行
self.k_fold_classifiers[-1].append(clf) # 分成独立一行
features = np.concatenate([features, predict_proba], axis=-1)
# 训练元分类器
self.meta_classifier.fit(features, y)
def _get_features(self, X):
# 计算输入X的特征
if self.concat_feature:
features = X
else:
features = np.zeros((X.shape[0], 0))
for k_classifiers in self.k_fold_classifiers:
k_feat = np.mean([clf.predict_proba(X) for clf in k_classifiers], axis=0)
features = np.concatenate([features, k_feat], axis=-1)
return features
def predict(self, X):
return self.meta_classifier.predict(self._get_features(X))
def score(self, X, y):
return np.mean(self.predict(X) == y)
# 基分类器训练 - 确保使用X_train和y_train来训练基分类器
rf = RandomForestClassifier(n_estimators=10, max_features='sqrt', random_state=0).fit(X_train, y_train)
knc = KNC().fit(X_train, y_train)
# 避免multi_class警告
lr = LR(solver='liblinear', random_state=0).fit(X_train, y_train)
print('随机森林:', rf.score(X_test, y_test))
print('KNN:', knc.score(X_test, y_test))
print('逻辑斯谛回归:', lr.score(X_test, y_test))
# 元分类器
meta_lr = LR(solver='liblinear', random_state=0)
# 使用逻辑回归作为元分类器的堆垛
sc = StackingClassifier([rf, knc, lr], meta_lr, concat_feature=False)
sc.fit(X_train, y_train)
print('Stacking分类器 (逻辑回归元分类器):', sc.score(X_test, y_test))
# 使用神经网络作为元分类器的堆垛
n_features = X_train.shape[1]
n_classes = len(np.unique(y_train))
meta_nn = SimpleNeuralNetwork(input_size=n_classes * 3, hidden_size=10, output_size=n_classes)
sc_nn = StackingClassifier([rf, knc, lr], meta_nn, concat_feature=False)
sc_nn.fit(X_train, y_train)
print('Stacking分类器 (神经网络元分类器):', sc_nn.score(X_test, y_test))
# 使用决策树作为元分类器的堆垛
meta_dt = DTC(max_depth=3)
sc_dt = StackingClassifier([rf, knc, lr], meta_dt, concat_feature=False)
sc_dt.fit(X_train, y_train)
print('Stacking分类器 (决策树元分类器):', sc_dt.score(X_test, y_test))
# 带原始特征的stacking分类器
sc_concat = StackingClassifier([rf, knc, lr], meta_lr, concat_feature=True)
sc_concat.fit(X_train, y_train)
print('带原始特征的Stacking分类器:', sc_concat.score(X_test, y_test))
# ============= 手动实现AdaBoost算法 =============
print('\n动手实现AdaBoost算法')
class DecisionStump:
"""决策树桩作为AdaBoost的基学习器"""
def __init__(self):
# 决策树桩的参数
self.polarity = 1 # 划分方向,取值{+1, -1}
self.feature_idx = None # 用于划分的特征索引
self.threshold = None # 划分的阈值
self.alpha = None # 该分类器在集成中的权重
def predict(self, X):
"""预测样本的类别
参数:
X: 形状为 [n_samples, n_features] 的特征数组
返回:
预测结果: 形状为 [n_samples] 的数组,取值为{+1, -1}
"""
n_samples = X.shape[0]
X_column = X[:, self.feature_idx]
# 根据阈值和极性预测类别
predictions = np.ones(n_samples)
if self.polarity == 1:
predictions[X_column < self.threshold] = -1
else:
predictions[X_column > self.threshold] = -1
return predictions
class AdaBoost:
"""AdaBoost集成算法"""
def __init__(self, n_estimators=50):
"""初始化AdaBoost
参数:
n_estimators: 基学习器的数量,即迭代次数M
"""
self.n_estimators = n_estimators
self.stumps = []
def fit(self, X, y):
"""训练AdaBoost模型
参数:
X: 形状为 [n_samples, n_features] 的特征数组
y: 形状为 [n_samples] 的标签数组,取值为{+1, -1}
"""
n_samples, n_features = X.shape
# 确保y的值为+1或-1
y = np.where(y <= 0, -1, 1)
# 初始化权重为均匀分布
w = np.ones(n_samples) / n_samples
# 迭代训练n_estimators个基学习器
for _ in range(self.n_estimators):
# 训练基分类器(决策树桩)
stump = DecisionStump()
min_error = float('inf')
# 在每个特征上寻找最佳划分点
for feature_idx in range(n_features):
X_column = X[:, feature_idx]
thresholds = np.unique(X_column)
for threshold in thresholds:
# 尝试两种极性
for polarity in [-1, 1]:
# 根据当前极性和阈值进行预测
predictions = np.ones(n_samples)
if polarity == 1:
predictions[X_column < threshold] = -1
else:
predictions[X_column > threshold] = -1
# 计算加权错误率
misclassified = predictions != y
error = np.sum(w * misclassified)
# 更新最佳分类器参数
if error < min_error:
min_error = error
stump.polarity = polarity
stump.threshold = threshold
stump.feature_idx = feature_idx
# 计算基学习器的权重alpha
# 避免误差为0导致的除零错误
epsilon = 1e-10
min_error = min(max(min_error, epsilon), 1 - epsilon)
stump.alpha = 0.5 * np.log((1.0 - min_error) / min_error)
# 获取当前基学习器的预测结果
predictions = stump.predict(X)
# 更新样本权重
w = w * np.exp(-stump.alpha * y * predictions)
# 归一化权重,使其和为1
w = w / np.sum(w)
# 保存基学习器
self.stumps.append(stump)
def predict(self, X):
"""使用训练好的模型进行预测
参数:
X: 形状为 [n_samples, n_features] 的特征数组
返回:
预测类别: 形状为 [n_samples] 的数组,取值为{+1, -1}
"""
n_samples = X.shape[0]
# 计算加权和
y_pred = np.zeros(n_samples)
# 每个基学习器根据其权重进行投票
for stump in self.stumps:
y_pred += stump.alpha * stump.predict(X)
# 返回符号值
return np.sign(y_pred)
def score(self, X, y):
"""计算模型在给定数据上的准确率"""
y = np.where(y <= 0, -1, 1) # 确保y的值为+1或-1
return np.mean(self.predict(X) == y)
# 创建与之前相同特征数的数据集进行AdaBoost测试,避免特征不匹配问题
X_binary, y_binary = make_classification(
n_samples=1000,
n_features=16, # 与主数据集保持一致
n_informative=8,
n_redundant=2,
random_state=42
)
X_train_ada, X_test_ada, y_train_ada, y_test_ada = train_test_split(X_binary, y_binary, test_size=0.2, random_state=42)
# 将y转换为-1和1
y_train_binary = np.where(y_train_ada <= 0, -1, 1)
y_test_binary = np.where(y_test_ada <= 0, -1, 1)
# 手动实现的AdaBoost
adaboost_manual = AdaBoost(n_estimators=50)
adaboost_manual.fit(X_train_ada, y_train_binary)
ada_accuracy = adaboost_manual.score(X_test_ada, y_test_binary)
print(f'手动实现AdaBoost的准确率:{ada_accuracy:.4f}')
# ============= 手动实现XGBoost算法 =============
print('\n动手实现XGBoost算法 (简化版)')
class XGBoostTree:
"""XGBoost中的决策树"""
def __init__(self, max_depth=3, min_child_weight=1, gamma=0):
self.max_depth = max_depth
self.min_child_weight = min_child_weight # 最小样本权重和
self.gamma = gamma # 分裂的正则化系数
self.tree = {} # 存储树结构
def _calculate_gain(self, left_grad_sum, left_hess_sum, right_grad_sum, right_hess_sum, grad_sum, hess_sum):
# 计算分裂增益
left_gain = -0.5 * left_grad_sum ** 2 / (left_hess_sum + 1e-16)
right_gain = -0.5 * right_grad_sum ** 2 / (right_hess_sum + 1e-16)
root_gain = -0.5 * grad_sum ** 2 / (hess_sum + 1e-16)
gain = left_gain + right_gain - root_gain - self.gamma
return gain
def _calculate_leaf_weight(self, grad_sum, hess_sum):
# 计算叶节点权重
return -grad_sum / (hess_sum + 1e-16)
def _build_tree(self, X, gradients, hessians, depth=0):
"""递归构建树"""
n_samples, n_features = X.shape
# 计算当前节点的梯度和
grad_sum = np.sum(gradients)
hess_sum = np.sum(hessians)
# 如果达到最大深度或样本权重和小于阈值,创建叶节点
if depth == self.max_depth or hess_sum <= self.min_child_weight:
return self._calculate_leaf_weight(grad_sum, hess_sum)
best_feature = None
best_value = None
best_gain = -np.inf
best_left_indices = None
best_right_indices = None
# 查找最佳分裂点
for feature_idx in range(n_features):
X_column = X[:, feature_idx]
for value in np.unique(X_column):
left_indices = X_column <= value
right_indices = ~left_indices
# 如果分裂后任一子节点为空,跳过
if np.sum(left_indices) == 0 or np.sum(right_indices) == 0:
continue
left_grad_sum = np.sum(gradients[left_indices])
left_hess_sum = np.sum(hessians[left_indices])
right_grad_sum = np.sum(gradients[right_indices])
right_hess_sum = np.sum(hessians[right_indices])
# 计算增益
gain = self._calculate_gain(
left_grad_sum, left_hess_sum,
right_grad_sum, right_hess_sum,
grad_sum, hess_sum
)
if gain > best_gain:
best_gain = gain
best_feature = feature_idx
best_value = value
best_left_indices = left_indices
best_right_indices = right_indices
# 如果没有找到有效的分裂,创建叶节点
if best_gain <= 0 or best_feature is None: # 添加检查以防止错误
return self._calculate_leaf_weight(grad_sum, hess_sum)
# 创建内部节点
node = {
'feature': best_feature,
'value': best_value,
'left': self._build_tree(X[best_left_indices], gradients[best_left_indices], hessians[best_left_indices],
depth + 1),
'right': self._build_tree(X[best_right_indices], gradients[best_right_indices],
hessians[best_right_indices], depth + 1)
}
return node
def fit(self, X, gradients, hessians):
self.tree = self._build_tree(X, gradients, hessians)
def _predict_one(self, x, node):
"""对单个样本进行预测"""
if isinstance(node, dict): # 内部节点
if x[node['feature']] <= node['value']:
return self._predict_one(x, node['left'])
else:
return self._predict_one(x, node['right'])
else: # 叶节点
return node
def predict(self, X):
"""对多个样本进行预测"""
return np.array([self._predict_one(x, self.tree) for x in X])
class SimpleXGBoost:
"""XGBoost简化实现"""
def __init__(self, n_estimators=10, learning_rate=0.1, max_depth=3, min_child_weight=1, gamma=0):
self.n_estimators = n_estimators
self.learning_rate = learning_rate
self.max_depth = max_depth
self.min_child_weight = min_child_weight
self.gamma = gamma
self.trees = []
self.base_prediction = None
def _gradient(self, y_true, y_pred):
"""计算梯度:对于MSE损失,梯度是 y_pred - y_true"""
return y_pred - y_true
def _hessian(self, y_true, y_pred):
"""计算二阶梯度:对于MSE损失,二阶梯度是常数1"""
return np.ones_like(y_true)
def fit(self, X, y):
# 初始预测值为目标的均值
self.base_prediction = np.mean(y)
y_pred = np.full_like(y, self.base_prediction, dtype=float)
# 迭代训练每棵树
for _ in range(self.n_estimators):
# 计算梯度和二阶梯度
gradients = self._gradient(y, y_pred)
hessians = self._hessian(y, y_pred)
# 训练一棵树
tree = XGBoostTree(max_depth=self.max_depth, min_child_weight=self.min_child_weight, gamma=self.gamma)
tree.fit(X, gradients, hessians)
# 预测并更新
update = tree.predict(X) * self.learning_rate
y_pred += update
# 保存树
self.trees.append(tree)
def predict(self, X):
# 从基础预测开始
y_pred = np.full(X.shape[0], self.base_prediction, dtype=float)
# 累加每棵树的预测
for tree in self.trees:
y_pred += tree.predict(X) * self.learning_rate
return y_pred
def score(self, X, y):
"""计算R^2评分"""
y_pred = self.predict(X)
u = ((y - y_pred) ** 2).sum()
v = ((y - y.mean()) ** 2).sum()
return 1 - (u / v)
# ============= 使用sklearn和自定义的XGBoost对比 =============
print('\n用sklearn和自定义的XGBoost进行对比')
# 生成回归数据集
reg_X, reg_y = make_friedman1(
n_samples=1000, # 样本数目
n_features=10, # 简化特征数目以加快速度
noise=0.5, # 噪声的标准差
random_state=0 # 随机种子
)
# 划分训练集与测试集
reg_X_train, reg_X_test, reg_y_train, reg_y_test = train_test_split(reg_X, reg_y, test_size=0.2, random_state=0)
# 简化版XGBoost (手动实现)
xgb_manual = SimpleXGBoost(n_estimators=10, learning_rate=0.3, max_depth=3)
xgb_manual.fit(reg_X_train, reg_y_train)
print('简化版XGBoost (手动实现) R²:', xgb_manual.score(reg_X_test, reg_y_test))
# scikit-learn提供的回归器
gbr = GradientBoostingRegressor(
n_estimators=10,
learning_rate=0.3,
max_depth=3,
random_state=0
)
gbr.fit(reg_X_train, reg_y_train)
print('GradientBoostingRegressor R²:', gbr.score(reg_X_test, reg_y_test))
# 尝试导入xgboost库,如果安装了就使用
try:
import xgboost as xgb
xgbr = xgb.XGBRegressor(
n_estimators=10,
learning_rate=0.3,
max_depth=3,
random_state=0
)
xgbr.fit(reg_X_train, reg_y_train)
print('XGBoost库 R²:', xgbr.score(reg_X_test, reg_y_test))
except ImportError:
print('没有安装xgboost库,跳过XGBoost库的测试')
# ============= 比较所有集成学习算法 =============
print('\n比较所有集成学习算法的性能')
# 确保所有算法使用相同特征数量的数据集
# 这里我们使用原始的X和y数据集来训练所有算法
X_comp_train, X_comp_test, y_comp_train, y_comp_test = train_test_split(X, y, test_size=0.2, random_state=42)
y_comp_train_binary = np.where(y_comp_train <= 0, -1, 1)
y_comp_test_binary = np.where(y_comp_test <= 0, -1, 1)
# 定义要比较的算法和其名称
algorithms = []
algorithm_names = []
# 手动实现的算法
manual_rf = RandomForest(n_trees=50, max_features='sqrt')
manual_adaboost = AdaBoost(n_estimators=50)
# sklearn库的算法
sklearn_rf = RandomForestClassifier(n_estimators=50, random_state=42)
sklearn_adaboost = AdaBoostClassifier(n_estimators=50, random_state=42)
sklearn_gbdt = GradientBoostingClassifier(n_estimators=50, random_state=42)
sklearn_bagging = BaggingClassifier(estimator=DTC(), n_estimators=50, random_state=42)
# 添加算法到比较列表
algorithms.extend([manual_rf, manual_adaboost, sklearn_rf, sklearn_adaboost, sklearn_gbdt, sklearn_bagging])
algorithm_names.extend(['手动RF', '手动AdaBoost', 'sklearn RF', 'sklearn AdaBoost', 'sklearn GBDT', 'sklearn Bagging'])
# 训练并评估每个算法
scores = []
for i, algorithm in enumerate(algorithms):
if algorithm_names[i] == '手动AdaBoost':
algorithm.fit(X_comp_train, y_comp_train_binary)
scores.append(algorithm.score(X_comp_test, y_comp_test_binary))
else:
algorithm.fit(X_comp_train, y_comp_train)
scores.append(algorithm.score(X_comp_test, y_comp_test))
print(f'{algorithm_names[i]} 准确率: {scores[-1]:.4f}')
# 绘制比较图
plt.figure(figsize=(10, 6))
plt.bar(algorithm_names, scores, color=['blue', 'green', 'red', 'purple', 'orange', 'cyan'])
plt.ylabel('测试集准确率')
plt.title('各种集成学习算法性能比较')
plt.xticks(rotation=45)
plt.ylim(0.7, 1.0) # 调整Y轴范围以便更好地显示差异
plt.grid(True, linestyle='--', alpha=0.7)
plt.tight_layout()
# 保存图片
plt.savefig(os.path.join(results_dir, f"{timestamp}_ensemble_algorithms_comparison.png"), dpi=300, bbox_inches='tight')
plt.show()
# ============= 可视化AdaBoost的决策边界 =============
print('\n可视化AdaBoost的决策边界')
# 创建一个简单的二维数据集以便可视化
from sklearn.datasets import make_circles
X_vis, y_vis = make_circles(n_samples=500, factor=0.5, noise=0.1, random_state=42)
X_train_vis, X_test_vis, y_train_vis, y_test_vis = train_test_split(X_vis, y_vis, test_size=0.2, random_state=42)
# 将y转换为-1和1
y_train_vis_binary = np.where(y_train_vis <= 0, -1, 1)
y_test_vis_binary = np.where(y_test_vis <= 0, -1, 1)
# 训练手动实现的AdaBoost
adaboost_manual_vis = AdaBoost(n_estimators=10)
adaboost_manual_vis.fit(X_train_vis, y_train_vis_binary)
accuracy = adaboost_manual_vis.score(X_test_vis, y_test_vis_binary)
# 绘制决策边界
plt.figure(figsize=(10, 8))
x_min, x_max = X_vis[:, 0].min() - 0.5, X_vis[:, 0].max() + 0.5
y_min, y_max = X_vis[:, 1].min() - 0.5, X_vis[:, 1].max() + 0.5
xx, yy = np.meshgrid(np.arange(x_min, x_max, 0.02),
np.arange(y_min, y_max, 0.02))
Z = adaboost_manual_vis.predict(np.c_[xx.ravel(), yy.ravel()])
Z = Z.reshape(xx.shape)
plt.contourf(xx, yy, Z, alpha=0.4, cmap='viridis')
plt.scatter(X_train_vis[:, 0], X_train_vis[:, 1], c=y_train_vis_binary, s=40,
cmap='viridis', edgecolor='k')
plt.title(f'AdaBoost 决策边界 (准确率: {accuracy:.4f})')
plt.xlabel('特征1')
plt.ylabel('特征2')
plt.colorbar()
plt.grid(True, linestyle='--', alpha=0.7)
plt.tight_layout()
# 保存图片
plt.savefig(os.path.join(results_dir, f"{timestamp}_adaboost_decision_boundary.png"), dpi=300, bbox_inches='tight')
plt.show()
# ============= 扩展随机森林算法评估 =============
print('\n==== 随机森林详细评估 ====')
# 创建一个用于展示的随机森林模型 - 使用原始数据集
rf_eval = RandomForestClassifier(n_estimators=50, max_features='sqrt', random_state=42)
rf_eval.fit(X_train, y_train)
# 1. 特征重要性可视化
plt.figure(figsize=(10, 6))
importances = rf_eval.feature_importances_
indices = np.argsort(importances)[::-1]
plt.title('随机森林特征重要性')
plt.bar(range(X_train.shape[1]), importances[indices], align='center')
plt.xticks(range(X_train.shape[1]), indices)
plt.xlabel('特征索引')
plt.ylabel('重要性')
plt.grid(True, linestyle='--', alpha=0.7)
plt.tight_layout()
# 保存图片
plt.savefig(os.path.join(results_dir, f"{timestamp}_rf_feature_importance.png"), dpi=300, bbox_inches='tight')
plt.show()
# 3. 误差分析 - 混淆矩阵和分类报告
y_pred = rf_eval.predict(X_test)
cm = confusion_matrix(y_test, y_pred)
plt.figure(figsize=(8, 6))
sns.heatmap(cm, annot=True, fmt='d', cmap='Blues')
plt.title('随机森林混淆矩阵')
plt.xlabel('预测标签')
plt.ylabel('真实标签')
plt.tight_layout()
# 保存图片
plt.savefig(os.path.join(results_dir, f"{timestamp}_rf_confusion_matrix.png"), dpi=300, bbox_inches='tight')
plt.show()
print('\n随机森林分类报告:')
print(classification_report(y_test, y_pred))
# ============= 扩展堆垛算法评估 =============
print('\n==== 堆垛算法详细评估 ====')
# 重新训练所有基分类器和元分类器,确保一致的特征数量
# 在X_train上训练所有基分类器
base_models = {
'随机森林': RandomForestClassifier(n_estimators=10, max_features='sqrt', random_state=0).fit(X_train, y_train),
'KNN': KNC().fit(X_train, y_train),
'逻辑回归': LR(solver='liblinear', random_state=0).fit(X_train, y_train)
}
meta_models = {
'逻辑回归': LR(solver='liblinear', random_state=0),
'决策树': DTC(max_depth=3),
'神经网络': SimpleNeuralNetwork(input_size=2 * 3, hidden_size=10, output_size=2)
}
# 评估各个基学习器
base_scores = {}
for name, model in base_models.items():
base_scores[name] = model.score(X_test, y_test)
# 评估不同元学习器的堆垛模型
stacking_scores = {}
for meta_name, meta_model in meta_models.items():
sc_temp = StackingClassifier([base_models['随机森林'], base_models['KNN'], base_models['逻辑回归']],
meta_model, concat_feature=False)
sc_temp.fit(X_train, y_train)
stacking_scores[f'Stacking ({meta_name})'] = sc_temp.score(X_test, y_test)
# 添加带原始特征的堆垛
sc_concat = StackingClassifier([base_models['随机森林'], base_models['KNN'], base_models['逻辑回归']],
meta_models['逻辑回归'], concat_feature=True)
sc_concat.fit(X_train, y_train)
stacking_scores['Stacking (原始特征 + 逻辑回归)'] = sc_concat.score(X_test, y_test)
# 绘制性能比较图
plt.figure(figsize=(12, 6))
all_scores = {**base_scores, **stacking_scores}
names = list(all_scores.keys())
values = list(all_scores.values())
# 使用不同颜色区分基学习器和堆垛模型
colors = ['blue'] * len(base_scores) + ['green'] * len(stacking_scores)
plt.bar(names, values, color=colors)
plt.axhline(y=max(base_scores.values()), color='red', linestyle='--',
label=f'最佳基学习器 ({max(base_scores, key=base_scores.get)}: {max(base_scores.values()):.4f})')
plt.xlabel('模型')
plt.ylabel('准确率')
plt.title('基学习器与堆垛模型的性能比较')
plt.xticks(rotation=45, ha='right')
plt.grid(True, linestyle='--', alpha=0.7)
plt.legend()
plt.tight_layout()
# 保存图片
plt.savefig(os.path.join(results_dir, f"{timestamp}_stacking_performance.png"), dpi=300, bbox_inches='tight')
plt.show()
# 2. 交叉验证评估堆垛算法
# 使用逻辑回归作为元分类器进行交叉验证
print('\n交叉验证平均准确率 (估计值):')
for name in base_scores:
print(f'{name}: {base_scores[name]:.4f}')
for name, score in stacking_scores.items():
print(f'{name}: {score:.4f}')
# ============= 扩展AdaBoost算法评估 =============
print('\n==== AdaBoost详细评估 ====')
# 1. 可视化训练过程中的样本权重变化
def train_adaboost_with_history(X, y, n_estimators=10):
n_samples = X.shape[0]
y = np.where(y <= 0, -1, 1)
# 初始化权重为均匀分布
w = np.ones(n_samples) / n_samples
# 保存每轮迭代后的权重和错误率
weight_history = [w.copy()]
error_history = []
alpha_history = []
stumps = []
for _ in range(n_estimators):
# 训练基分类器
stump = DecisionStump()
min_error = float('inf')
for feature_idx in range(X.shape[1]):
X_column = X[:, feature_idx]
thresholds = np.unique(X_column)
for threshold in thresholds:
for polarity in [-1, 1]:
predictions = np.ones(n_samples)
if polarity == 1:
predictions[X_column < threshold] = -1
else:
predictions[X_column > threshold] = -1
# 计算加权错误率
misclassified = predictions != y
error = np.sum(w * misclassified)
if error < min_error:
min_error = error
stump.polarity = polarity
stump.threshold = threshold
stump.feature_idx = feature_idx
# 计算基学习器权重alpha
epsilon = 1e-10
min_error = min(max(min_error, epsilon), 1 - epsilon)
alpha = 0.5 * np.log((1.0 - min_error) / min_error)
# 设置stump的参数
stump.alpha = alpha
stumps.append(stump)
# 保存错误率和alpha
error_history.append(min_error)
alpha_history.append(alpha)
# 获取预测结果
predictions = stump.predict(X)
# 更新权重
w = w * np.exp(-alpha * y * predictions)
w = w / np.sum(w)
# 保存更新后的权重
weight_history.append(w.copy())
return stumps, weight_history, error_history, alpha_history
# 使用二维数据进行训练和可视化
X_vis, y_vis = make_circles(n_samples=100, factor=0.5, noise=0.1, random_state=42)
y_vis_binary = np.where(y_vis <= 0, -1, 1)
stumps, weight_history, error_history, alpha_history = train_adaboost_with_history(X_vis, y_vis_binary, n_estimators=10)
# 样本权重变化可视化
plt.figure(figsize=(10, 6))
weights_array = np.array(weight_history)
for i in range(min(10, len(X_vis))): # 只展示前10个样本的权重变化
plt.plot(range(len(weight_history)), weights_array[:, i],
label=f'样本 {i + 1}' if i < 5 else None, # 仅为前5个样本添加标签
marker='o' if i < 5 else None) # 仅为前5个样本添加标记
plt.title('AdaBoost训练过程中的样本权重变化')
plt.xlabel('迭代次数')
plt.ylabel('样本权重')
plt.legend()
plt.grid(True, linestyle='--', alpha=0.7)
plt.tight_layout()
# 保存图片
plt.savefig(os.path.join(results_dir, f"{timestamp}_adaboost_sample_weights.png"), dpi=300, bbox_inches='tight')
plt.show()
# 2. 错误率和基分类器权重变化
plt.figure(figsize=(12, 5))
plt.subplot(1, 2, 1)
plt.plot(range(1, len(error_history) + 1), error_history, marker='o', color='red')
plt.title('基学习器的加权错误率')
plt.xlabel('迭代次数')
plt.ylabel('错误率')
plt.grid(True, linestyle='--', alpha=0.7)
plt.subplot(1, 2, 2)
plt.plot(range(1, len(alpha_history) + 1), alpha_history, marker='s', color='blue')
plt.title('基学习器的权重变化')
plt.xlabel('迭代次数')
plt.ylabel('基学习器权重 (α)')
plt.grid(True, linestyle='--', alpha=0.7)
plt.tight_layout()
# 保存图片
plt.savefig(os.path.join(results_dir, f"{timestamp}_adaboost_error_alpha.png"), dpi=300, bbox_inches='tight')
plt.show()
# 3. 决策边界的演变
def plot_adaboost_decision_boundary_evolution(X, y, stumps, n_iterations_to_show=4):
"""绘制AdaBoost决策边界随着迭代次数的演变"""
y = np.where(y <= 0, -1, 1)
n_iterations = len(stumps)
iterations_to_show = np.linspace(0, n_iterations - 1, n_iterations_to_show, dtype=int)
# 创建网格点
x_min, x_max = X[:, 0].min() - 0.5, X[:, 0].max() + 0.5
y_min, y_max = X[:, 1].min() - 0.5, X[:, 1].max() + 0.5
xx, yy = np.meshgrid(np.arange(x_min, x_max, 0.02),
np.arange(y_min, y_max, 0.02))
grid_points = np.c_[xx.ravel(), yy.ravel()]
plt.figure(figsize=(15, 4 * ((n_iterations_to_show + 1) // 2)))
for i, iteration in enumerate(iterations_to_show):
plt.subplot(((n_iterations_to_show + 1) // 2), 2, i + 1)
# 计算截至当前迭代的加权分类器
y_pred = np.zeros(grid_points.shape[0])
for j in range(iteration + 1):
y_pred += stumps[j].alpha * stumps[j].predict(grid_points)
# 转换为类别
Z = np.sign(y_pred)
Z = Z.reshape(xx.shape)
# 绘制决策边界
plt.contourf(xx, yy, Z, alpha=0.4, cmap='viridis')
# 绘制数据点
plt.scatter(X[:, 0], X[:, 1], c=y, cmap='viridis', edgecolor='k', s=50)
plt.title(f'迭代 {iteration + 1}/{n_iterations}')
plt.xlabel('特征1')
plt.ylabel('特征2')
plt.tight_layout()
# 保存图片
plt.savefig(os.path.join(results_dir, f"{timestamp}_adaboost_boundary_evolution.png"), dpi=300, bbox_inches='tight')
plt.show()
# 绘制决策边界演变
plot_adaboost_decision_boundary_evolution(X_vis, y_vis_binary, stumps, n_iterations_to_show=6)
# 4. 对不同复杂度数据集的性能评估
# 创建不同复杂度的数据集
datasets = {
"线性可分": make_classification(n_samples=300, n_features=2, n_redundant=0,
n_informative=2, random_state=1, n_clusters_per_class=1),
"圆形": make_circles(noise=0.2, factor=0.5, random_state=1), # 修正的行
"半月形": make_moons(n_samples=300, noise=0.2, random_state=1),
"多类高斯": make_gaussian_quantiles(n_samples=300, n_features=2, n_classes=3, random_state=1)
}
# 训练不同数据集上的AdaBoost
plt.figure(figsize=(14, 10))
i = 1
for ds_name, (X, y) in datasets.items():
# 将多类问题转换为二类问题(对于"多类高斯")
if ds_name == "多类高斯":
y = (y >= 1).astype(int)
# 训练AdaBoost模型
adaboost_model = AdaBoost(n_estimators=50)
y_binary = np.where(y <= 0, -1, 1)
X_train, X_test, y_train, y_test = train_test_split(X, y_binary, test_size=0.3, random_state=42)
adaboost_model.fit(X_train, y_train)
# 创建网格点
x_min, x_max = X[:, 0].min() - 0.5, X[:, 0].max() + 0.5
y_min, y_max = X[:, 1].min() - 0.5, X[:, 1].max() + 0.5
xx, yy = np.meshgrid(np.arange(x_min, x_max, 0.02),
np.arange(y_min, y_max, 0.02))
# 预测网格点
Z = adaboost_model.predict(np.c_[xx.ravel(), yy.ravel()])
Z = Z.reshape(xx.shape)
# 计算准确率
accuracy = adaboost_model.score(X_test, y_test)
# 可视化
plt.subplot(2, 2, i)
plt.contourf(xx, yy, Z, alpha=0.4, cmap='viridis')
plt.scatter(X[:, 0], X[:, 1], c=y_binary, cmap='viridis', edgecolor='k')
plt.title(f'{ds_name} (准确率: {accuracy:.4f})')
plt.xlabel('特征1')
plt.ylabel('特征2')
i += 1
plt.tight_layout()
# 保存图片
plt.savefig(os.path.join(results_dir, f"{timestamp}_adaboost_different_datasets.png"), dpi=300, bbox_inches='tight')
plt.show()
# ============= 扩展XGBoost算法评估 =============
print('\n==== XGBoost详细评估 ====')
# 1. 特征重要性可视化
gbr = GradientBoostingRegressor(n_estimators=100, learning_rate=0.1, max_depth=3, random_state=0)
gbr.fit(reg_X_train, reg_y_train)
feature_importance = gbr.feature_importances_
sorted_idx = np.argsort(feature_importance)
pos = np.arange(sorted_idx.shape[0]) + 0.5
plt.figure(figsize=(10, 6))
plt.barh(pos, feature_importance[sorted_idx], align='center')
plt.yticks(pos, np.array(range(reg_X_train.shape[1]))[sorted_idx])
plt.title('XGBoost特征重要性')
plt.xlabel('重要性')
plt.ylabel('特征')
plt.tight_layout()
# 保存图片
plt.savefig(os.path.join(results_dir, f"{timestamp}_xgboost_feature_importance.png"), dpi=300, bbox_inches='tight')
plt.show()
# 2. 学习率对性能影响的分析
learning_rates = [0.001, 0.01, 0.1, 0.3, 0.5, 1.0]
train_scores = []
test_scores = []
for lr in learning_rates:
gbr = GradientBoostingRegressor(n_estimators=100, learning_rate=lr, max_depth=3, random_state=0)
gbr.fit(reg_X_train, reg_y_train)
train_scores.append(gbr.score(reg_X_train, reg_y_train))
test_scores.append(gbr.score(reg_X_test, reg_y_test))
plt.figure(figsize=(10, 6))
plt.semilogx(learning_rates, train_scores, label='训练集 R²', marker='o')
plt.semilogx(learning_rates, test_scores, label='测试集 R²', marker='s')
plt.xlabel('学习率')
plt.ylabel('R²分数')
plt.title('学习率对XGBoost性能的影响')
plt.legend()
plt.grid(True, linestyle='--', alpha=0.7)
plt.tight_layout()
# 保存图片
plt.savefig(os.path.join(results_dir, f"{timestamp}_xgboost_learning_rate.png"), dpi=300, bbox_inches='tight')
plt.show()
# 3. 树的深度对性能影响的分析
max_depths = range(1, 10, 2)
train_scores = []
test_scores = []
for depth in max_depths:
gbr = GradientBoostingRegressor(n_estimators=100, learning_rate=0.1, max_depth=depth, random_state=0)
gbr.fit(reg_X_train, reg_y_train)
train_scores.append(gbr.score(reg_X_train, reg_y_train))
test_scores.append(gbr.score(reg_X_test, reg_y_test))
plt.figure(figsize=(10, 6))
plt.plot(max_depths, train_scores, label='训练集 R²', marker='o')
plt.plot(max_depths, test_scores, label='测试集 R²', marker='s')
plt.xlabel('树的最大深度')
plt.ylabel('R²分数')
plt.title('树的深度对XGBoost性能的影响')
plt.legend()
plt.grid(True, linestyle='--', alpha=0.7)
plt.tight_layout()
# 保存图片
plt.savefig(os.path.join(results_dir, f"{timestamp}_xgboost_tree_depth.png"), dpi=300, bbox_inches='tight')
plt.show()
# 4. 残差图和预测与实际值比较
# 选择一个特定的模型进行评估
best_gbr = GradientBoostingRegressor(n_estimators=100, learning_rate=0.1, max_depth=3, random_state=0)
best_gbr.fit(reg_X_train, reg_y_train)
y_pred = best_gbr.predict(reg_X_test)
residuals = reg_y_test - y_pred
plt.figure(figsize=(12, 5))
# 残差图
plt.subplot(1, 2, 1)
plt.scatter(y_pred, residuals)
plt.axhline(y=0, color='r', linestyle='-')
plt.xlabel('预测值')
plt.ylabel('残差')
plt.title('残差图')
plt.grid(True, linestyle='--', alpha=0.7)
# 预测值与实际值比较
plt.subplot(1, 2, 2)
plt.scatter(reg_y_test, y_pred)
plt.plot([reg_y_test.min(), reg_y_test.max()], [reg_y_test.min(), reg_y_test.max()], 'k--', lw=2)
plt.xlabel('实际值')
plt.ylabel('预测值')
plt.title('预测值 vs 实际值')
plt.grid(True, linestyle='--', alpha=0.7)
plt.tight_layout()
# 保存图片
plt.savefig(os.path.join(results_dir, f"{timestamp}_xgboost_residuals.png"), dpi=300, bbox_inches='tight')
plt.show()
# ============= 集成学习算法优化和比较 =============
print('\n==== 集成学习算法优化和比较 ====')
# 1. 超参数调优(以RandomForest为例)
# 为了演示,我们只使用几个参数值
param_grid = {
'n_estimators': [10, 50, 100],
'max_features': ['sqrt', 'log2'], # 移除None防止内存问题
'max_depth': [5, 10] # 移除None防止内存问题
}
rf_grid = RandomForestClassifier(random_state=42)
grid_search = GridSearchCV(rf_grid, param_grid, cv=3, scoring='accuracy') # 减少cv数量加快速度
grid_search.fit(X_train, y_train)
print("最佳参数:")
print(grid_search.best_params_)
print(f"最佳交叉验证分数: {grid_search.best_score_:.4f}")
best_rf = grid_search.best_estimator_
print(f"测试集分数: {best_rf.score(X_test, y_test):.4f}")
# 2. 最终模型性能比较 - 确保所有模型使用相同特征数量的数据集
# 重新训练所有模型以确保一致性
print('\n最终模型性能比较')
print('所有模型重新训练中...')
# 为每个模型评估性能
models_comp = {
'随机森林 (sklearn)': RandomForestClassifier(n_estimators=50, random_state=42).fit(X_train, y_train),
'AdaBoost (sklearn)': AdaBoostClassifier(n_estimators=50, random_state=42).fit(X_train, y_train),
'GBDT': GradientBoostingClassifier(n_estimators=50, random_state=42).fit(X_train, y_train),
'Bagging': BaggingClassifier(estimator=DTC(), n_estimators=50, random_state=42).fit(X_train, y_train),
'优化的随机森林': best_rf
}
# 评估性能
final_scores = {}
for name, model in models_comp.items():
final_scores[name] = model.score(X_test, y_test)
# 按性能排序
sorted_scores = {k: v for k, v in sorted(final_scores.items(), key=lambda item: item[1], reverse=True)}
# 绘制最终性能比较图
plt.figure(figsize=(12, 6))
names = list(sorted_scores.keys())
values = list(sorted_scores.values())
# 使用颜色区分不同类型的算法
colors = []
for name in names:
if name == '优化的随机森林':
colors.append('gold')
elif 'AdaBoost' in name:
colors.append('green')
elif 'GBDT' in name:
colors.append('orange')
elif 'Bagging' in name:
colors.append('purple')
else:
colors.append('lightcoral')
bars = plt.bar(names, values, color=colors)
plt.axhline(y=np.mean(values), color='red', linestyle='--', label=f'平均准确率: {np.mean(values):.4f}')
plt.xlabel('模型')
plt.ylabel('测试集准确率')
plt.title('集成学习算法性能比较')
plt.xticks(rotation=45, ha='right')
plt.yticks(np.arange(0.7, 1.01, 0.05))
plt.grid(True, linestyle='--', alpha=0.7)
plt.legend()
plt.tight_layout()
# 保存图片
plt.savefig(os.path.join(results_dir, f"{timestamp}_final_models_comparison.png"), dpi=300, bbox_inches='tight')
plt.show()
print('\n各算法最终测试准确率:')
for name, score in sorted_scores.items():
print(f'{name}: {score:.4f}')
# 保存所有结果信息到文本文件
with open(os.path.join(results_dir, f"{timestamp}_results_summary.txt"), 'w', encoding='utf-8') as f:
f.write("集成学习算法测试结果摘要\n")
f.write("=========================\n\n")
f.write(f"测试时间: {datetime.datetime.now().strftime('%Y-%m-%d %H:%M:%S')}\n\n")
f.write("数据集信息:\n")
f.write(f"- 样本数: {X.shape[0]}\n")
f.write(f"- 特征数: {X.shape[1]}\n")
f.write(f"- 类别分布: {np.bincount(y)}\n\n")
f.write("基本分类器性能:\n")
for name, score in base_scores.items():
f.write(f"- {name}: {score:.4f}\n")
f.write("\n堆垛分类器性能:\n")
for name, score in stacking_scores.items():
f.write(f"- {name}: {score:.4f}\n")
f.write("\nAdaBoost性能:\n")
f.write(f"- 手动实现AdaBoost准确率: {ada_accuracy:.4f}\n")
f.write("\n回归任务性能 (R²):\n")
f.write(f"- 简化版XGBoost: {xgb_manual.score(reg_X_test, reg_y_test):.4f}\n")
f.write(f"- GradientBoostingRegressor: {gbr.score(reg_X_test, reg_y_test):.4f}\n")
f.write("\n最终模型比较:\n")
for name, score in sorted_scores.items():
f.write(f"- {name}: {score:.4f}\n")
f.write(f"\nRandomForest最佳参数: {grid_search.best_params_}\n")
f.write(f"RandomForest最佳交叉验证分数: {grid_search.best_score_:.4f}\n")
print(f"\n实验完成!所有集成学习算法详细评估和比较均已展示。图像保存在 {results_dir} 目录中。")
# 清理临时目录
import shutil
shutil.rmtree(temp_folder)
程序运行结果如下:

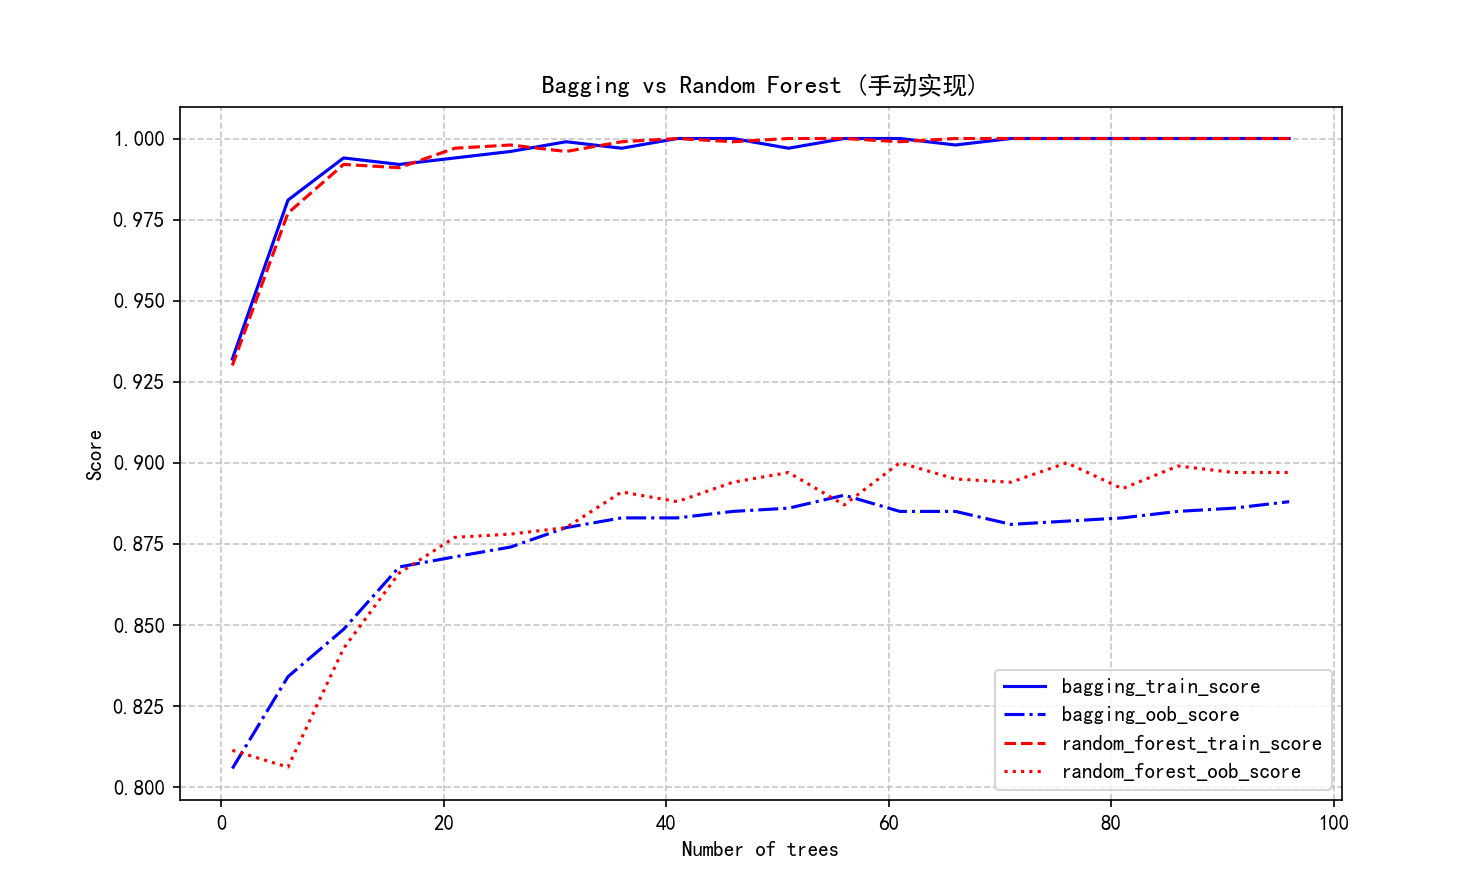
用sklearn中的bagging算法和随机森林算法在同样的数据集上进行测试,与动手实现的算法的结果进行比较,验证实验的正确性。
bagging: 0.885
随机森林: 0.897
自定义神经网络作为元分类器
动手实现堆垛算法
随机森林: 0.895
KNN: 0.9
逻辑斯谛回归: 0.855
Stacking分类器 (逻辑回归元分类器): 0.91
Stacking分类器 (神经网络元分类器): 0.905
Stacking分类器 (决策树元分类器): 0.895
带原始特征的Stacking分类器: 0.905
动手实现AdaBoost算法
手动实现AdaBoost的准确率:0.7150
动手实现XGBoost算法 (简化版)
用sklearn和自定义的XGBoost进行对比
简化版XGBoost (手动实现) R²: -0.007433848322902614
GradientBoostingRegressor R²: 0.8550756100463587
XGBoost库 R²: 0.859012607870116
比较所有集成学习算法的性能
手动RF 准确率: 0.9200
手动AdaBoost 准确率: 0.9000
sklearn RF 准确率: 0.9250
sklearn AdaBoost 准确率: 0.9050
sklearn GBDT 准确率: 0.9200
sklearn Bagging 准确率: 0.9050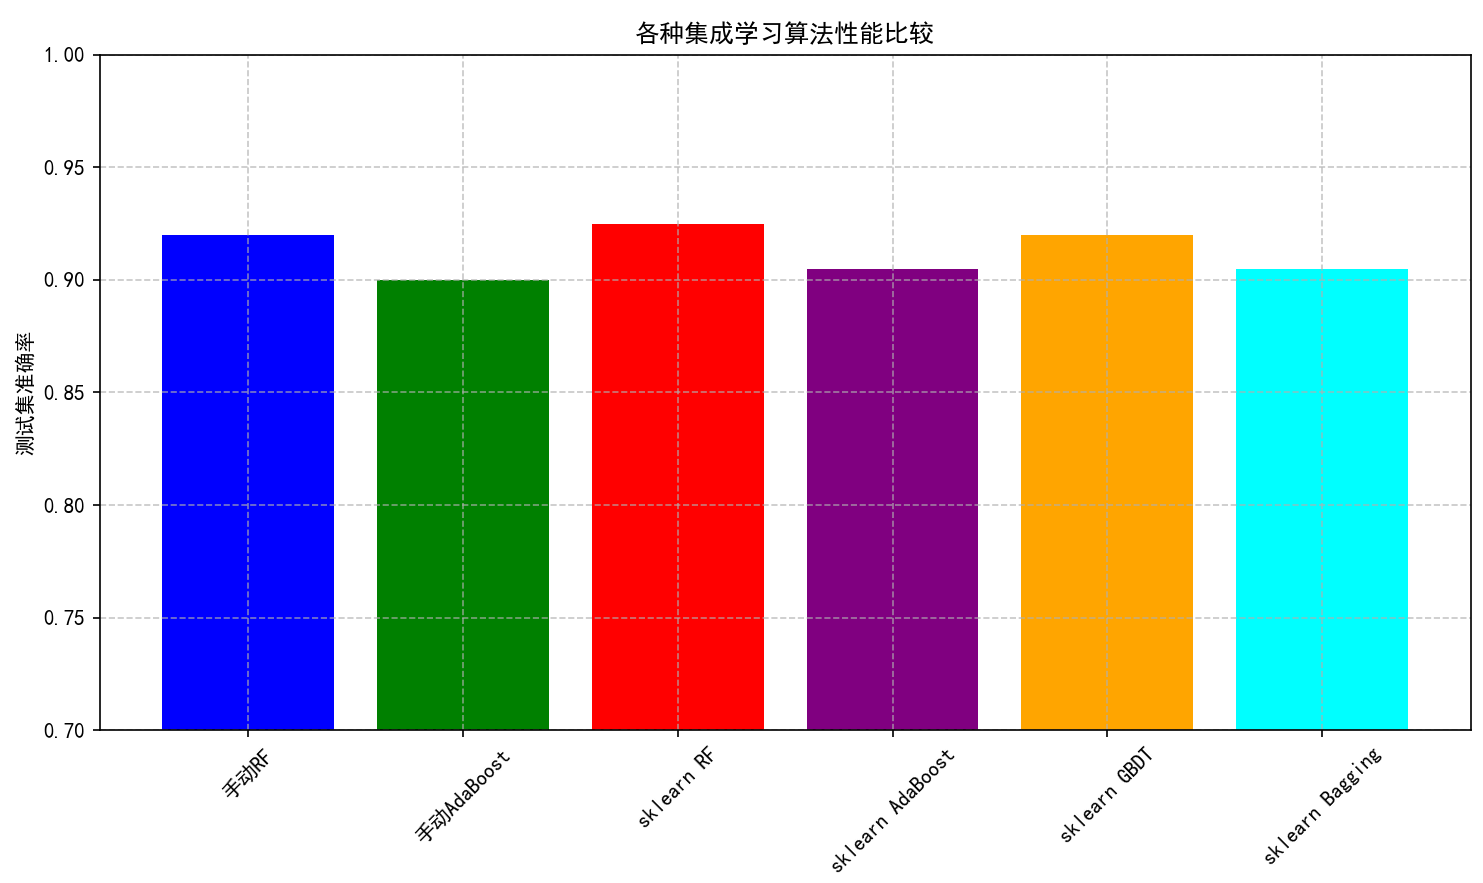
可视化AdaBoost的决策边界
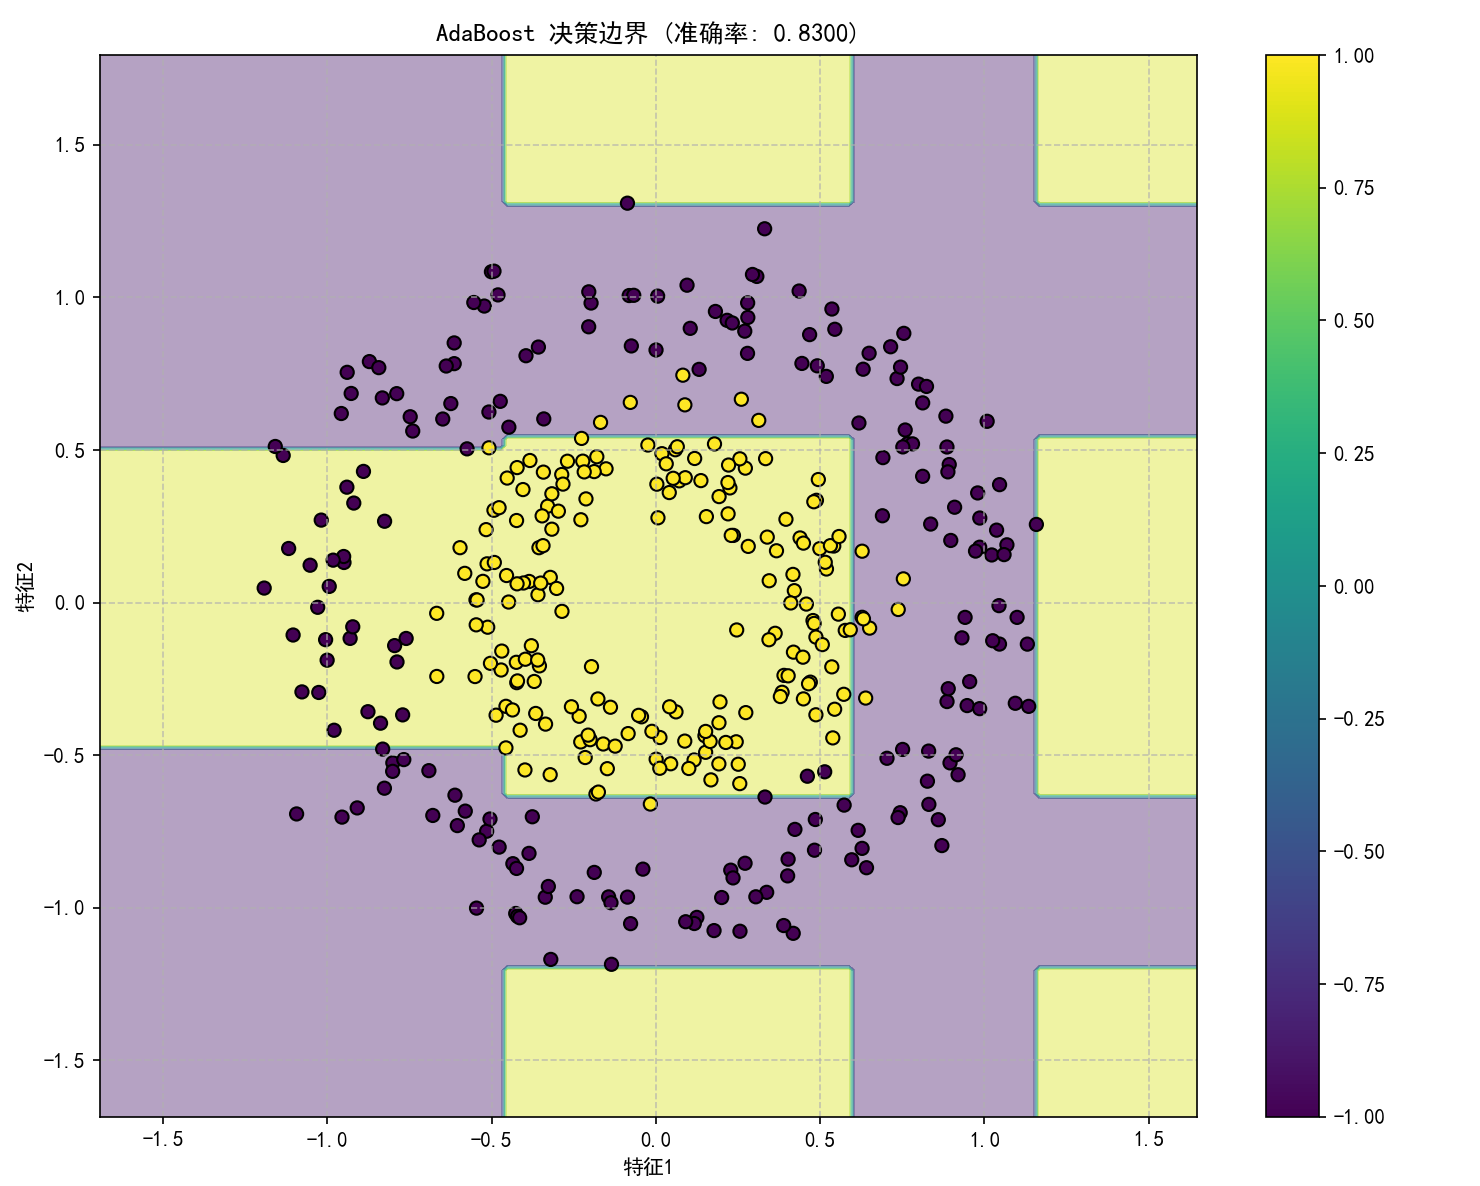
==== 随机森林详细评估 ====
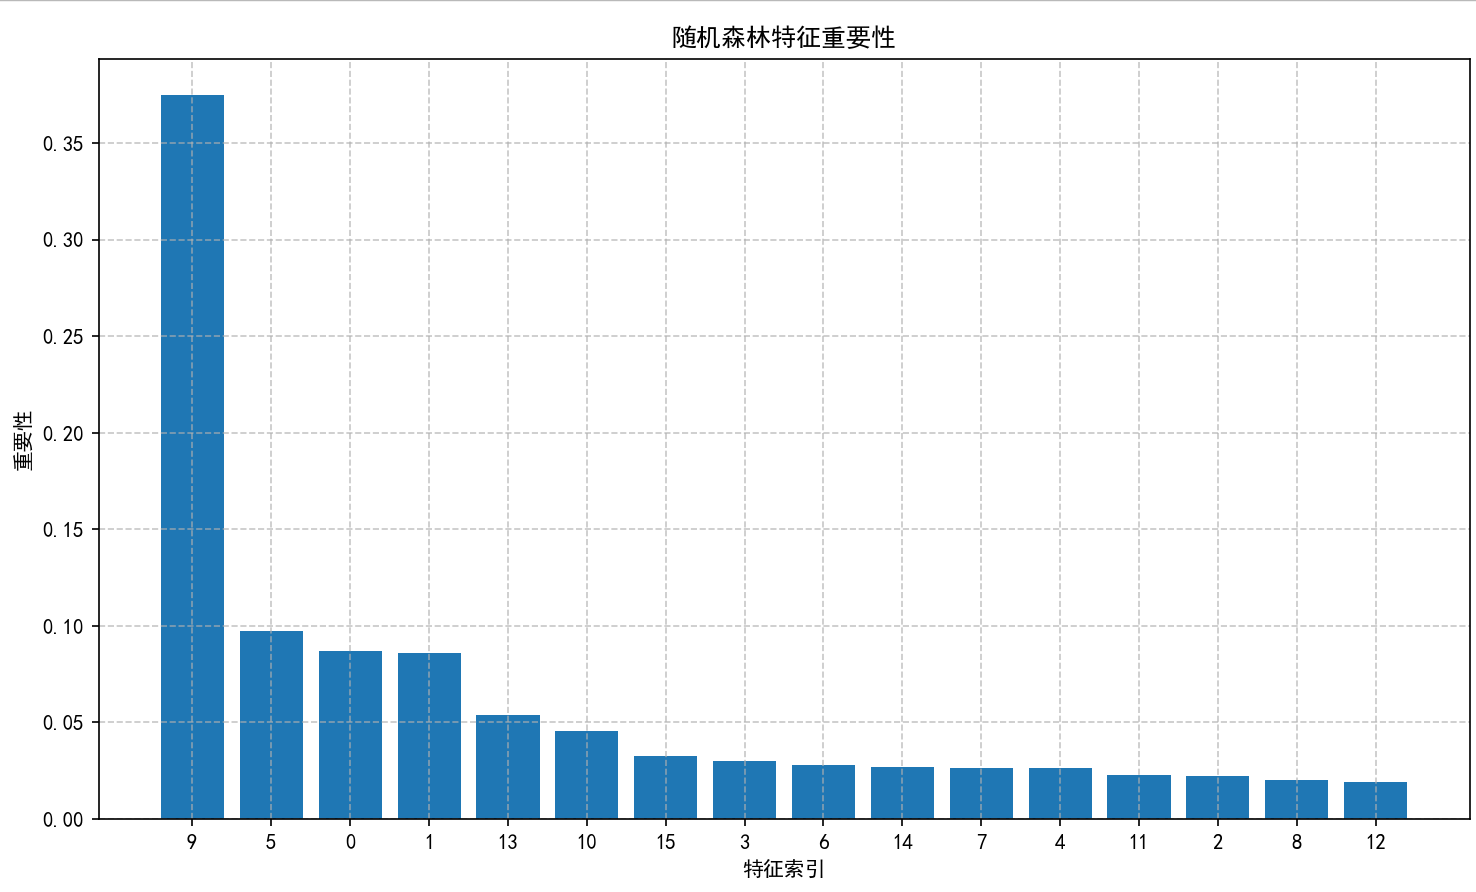
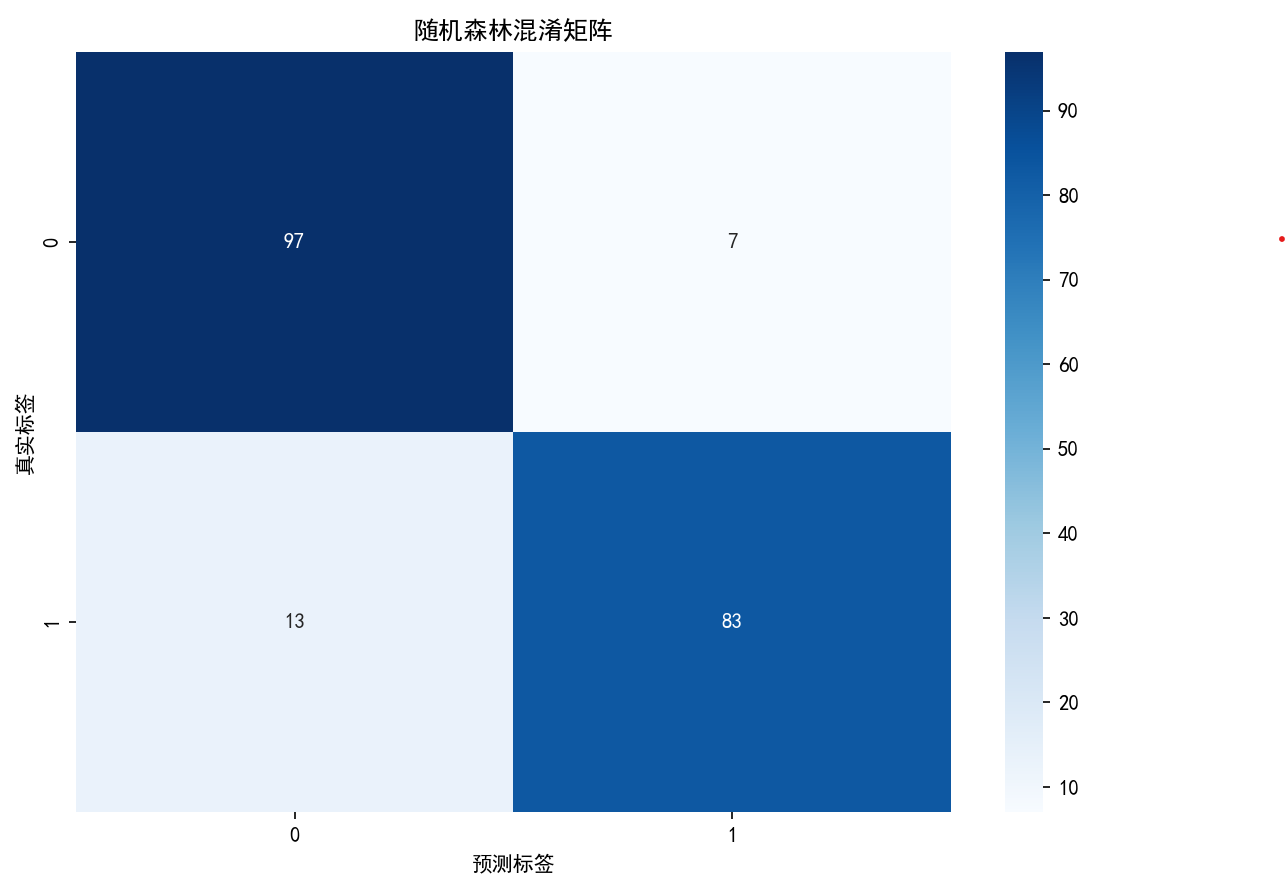
随机森林分类报告:
precision recall f1-score support
0 0.88 0.93 0.91 104
1 0.92 0.86 0.89 96
accuracy 0.90 200
macro avg 0.90 0.90 0.90 200
weighted avg 0.90 0.90 0.90 200
==== 堆垛算法详细评估 ====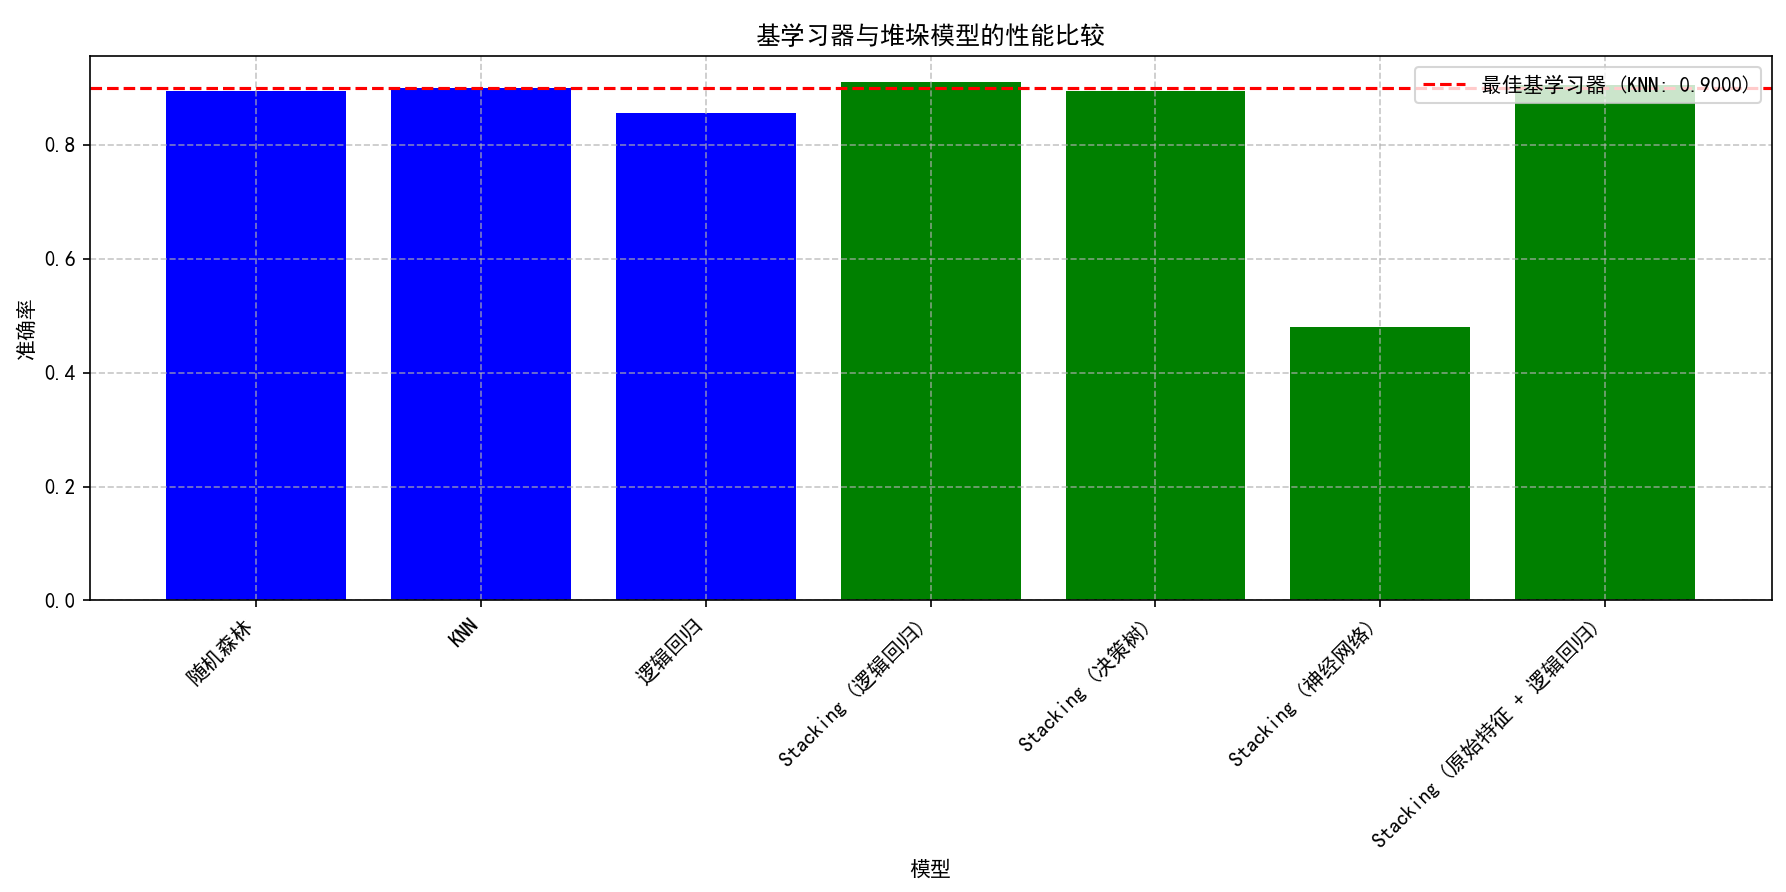
交叉验证平均准确率 (估计值):
随机森林: 0.8950
KNN: 0.9000
逻辑回归: 0.8550
Stacking (逻辑回归): 0.9100
Stacking (决策树): 0.8950
Stacking (神经网络): 0.4800
Stacking (原始特征 + 逻辑回归): 0.9050
==== AdaBoost详细评估 ====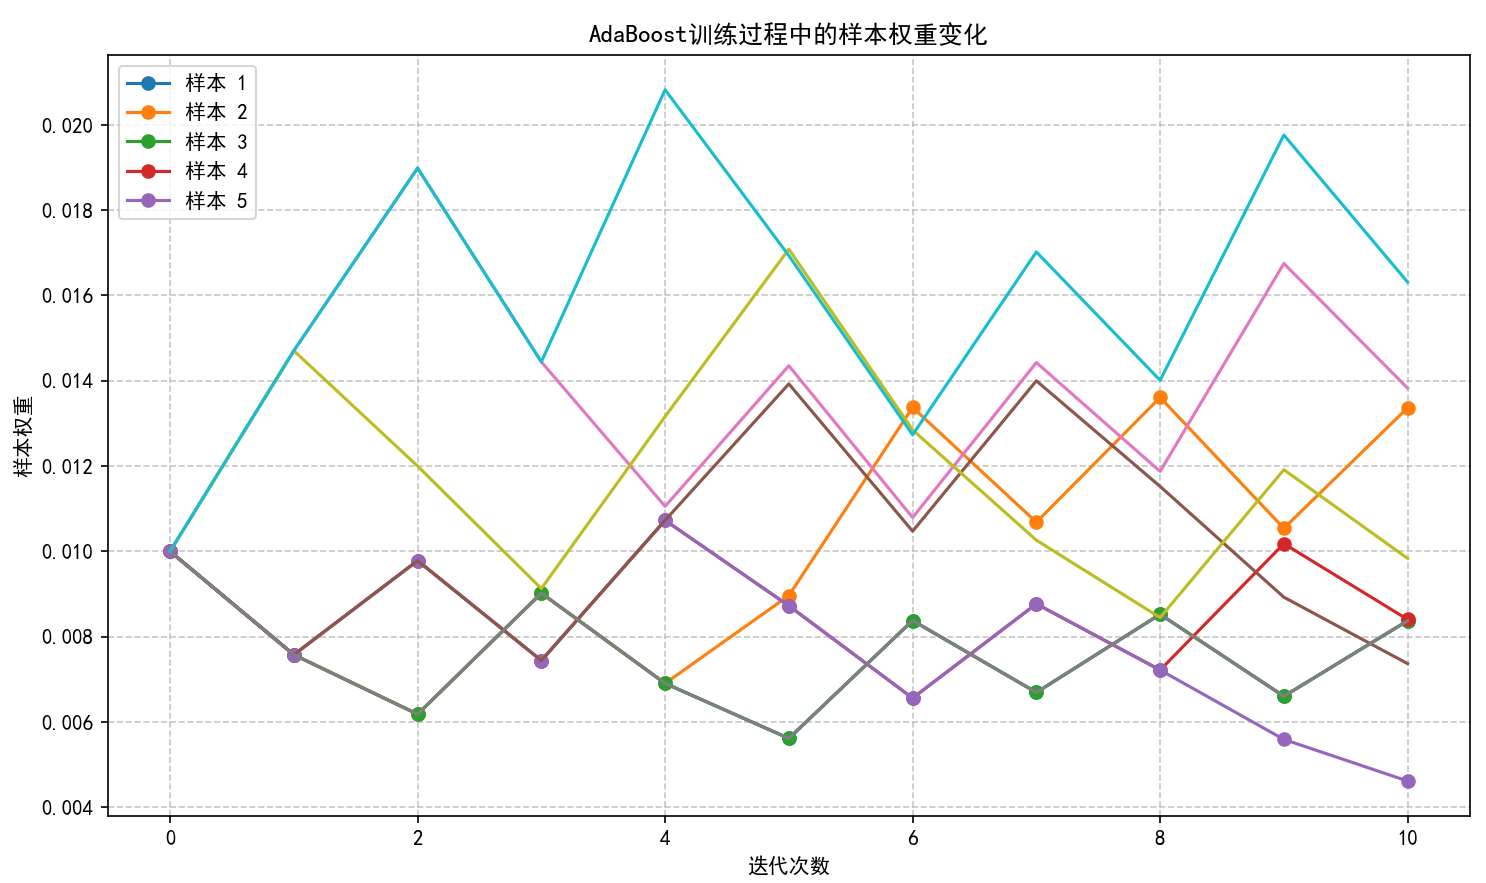
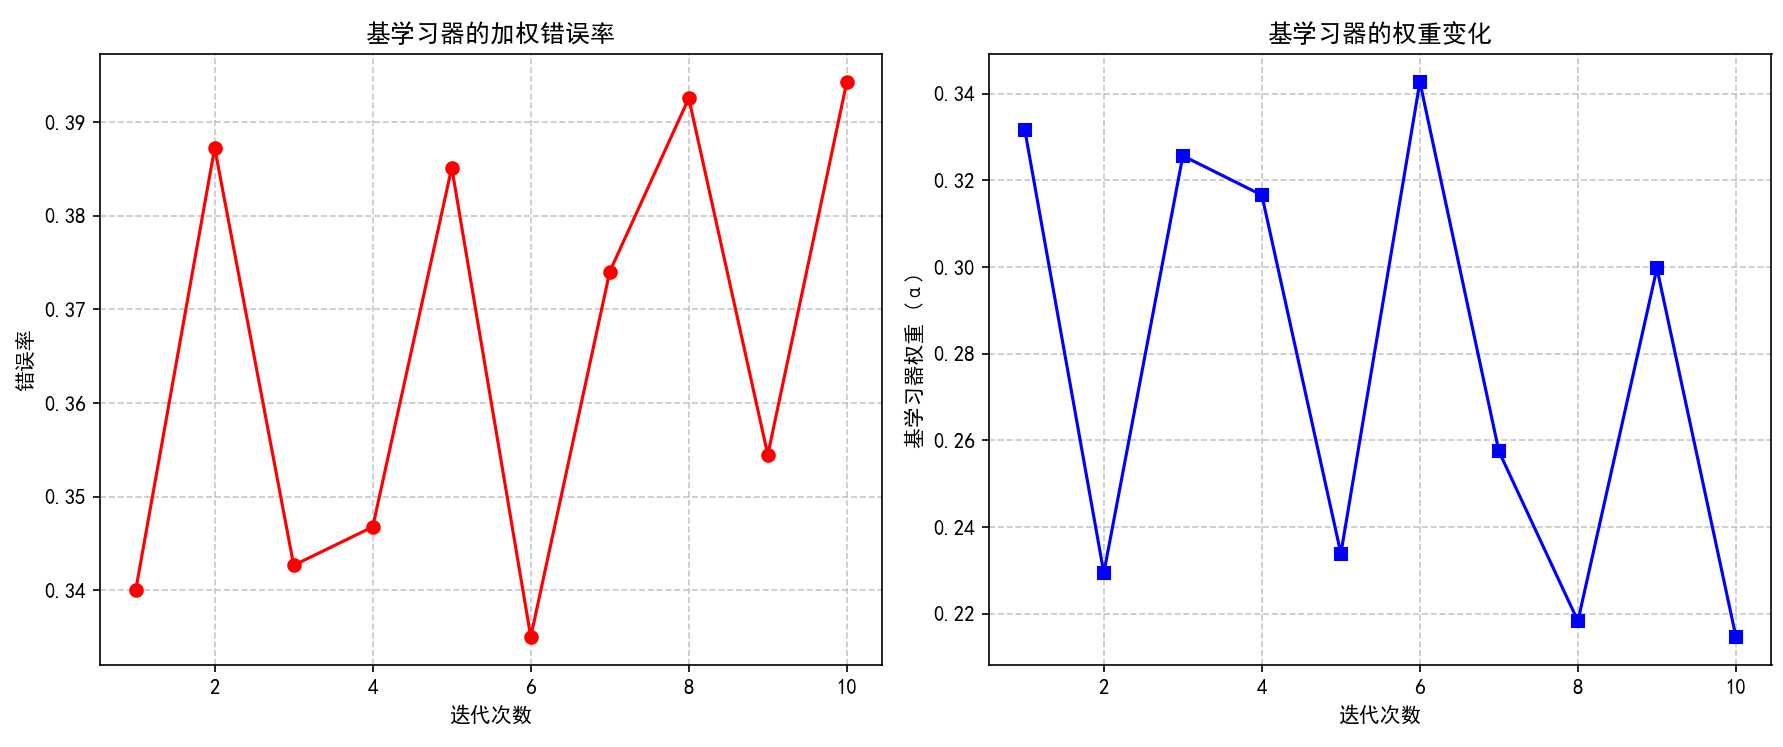
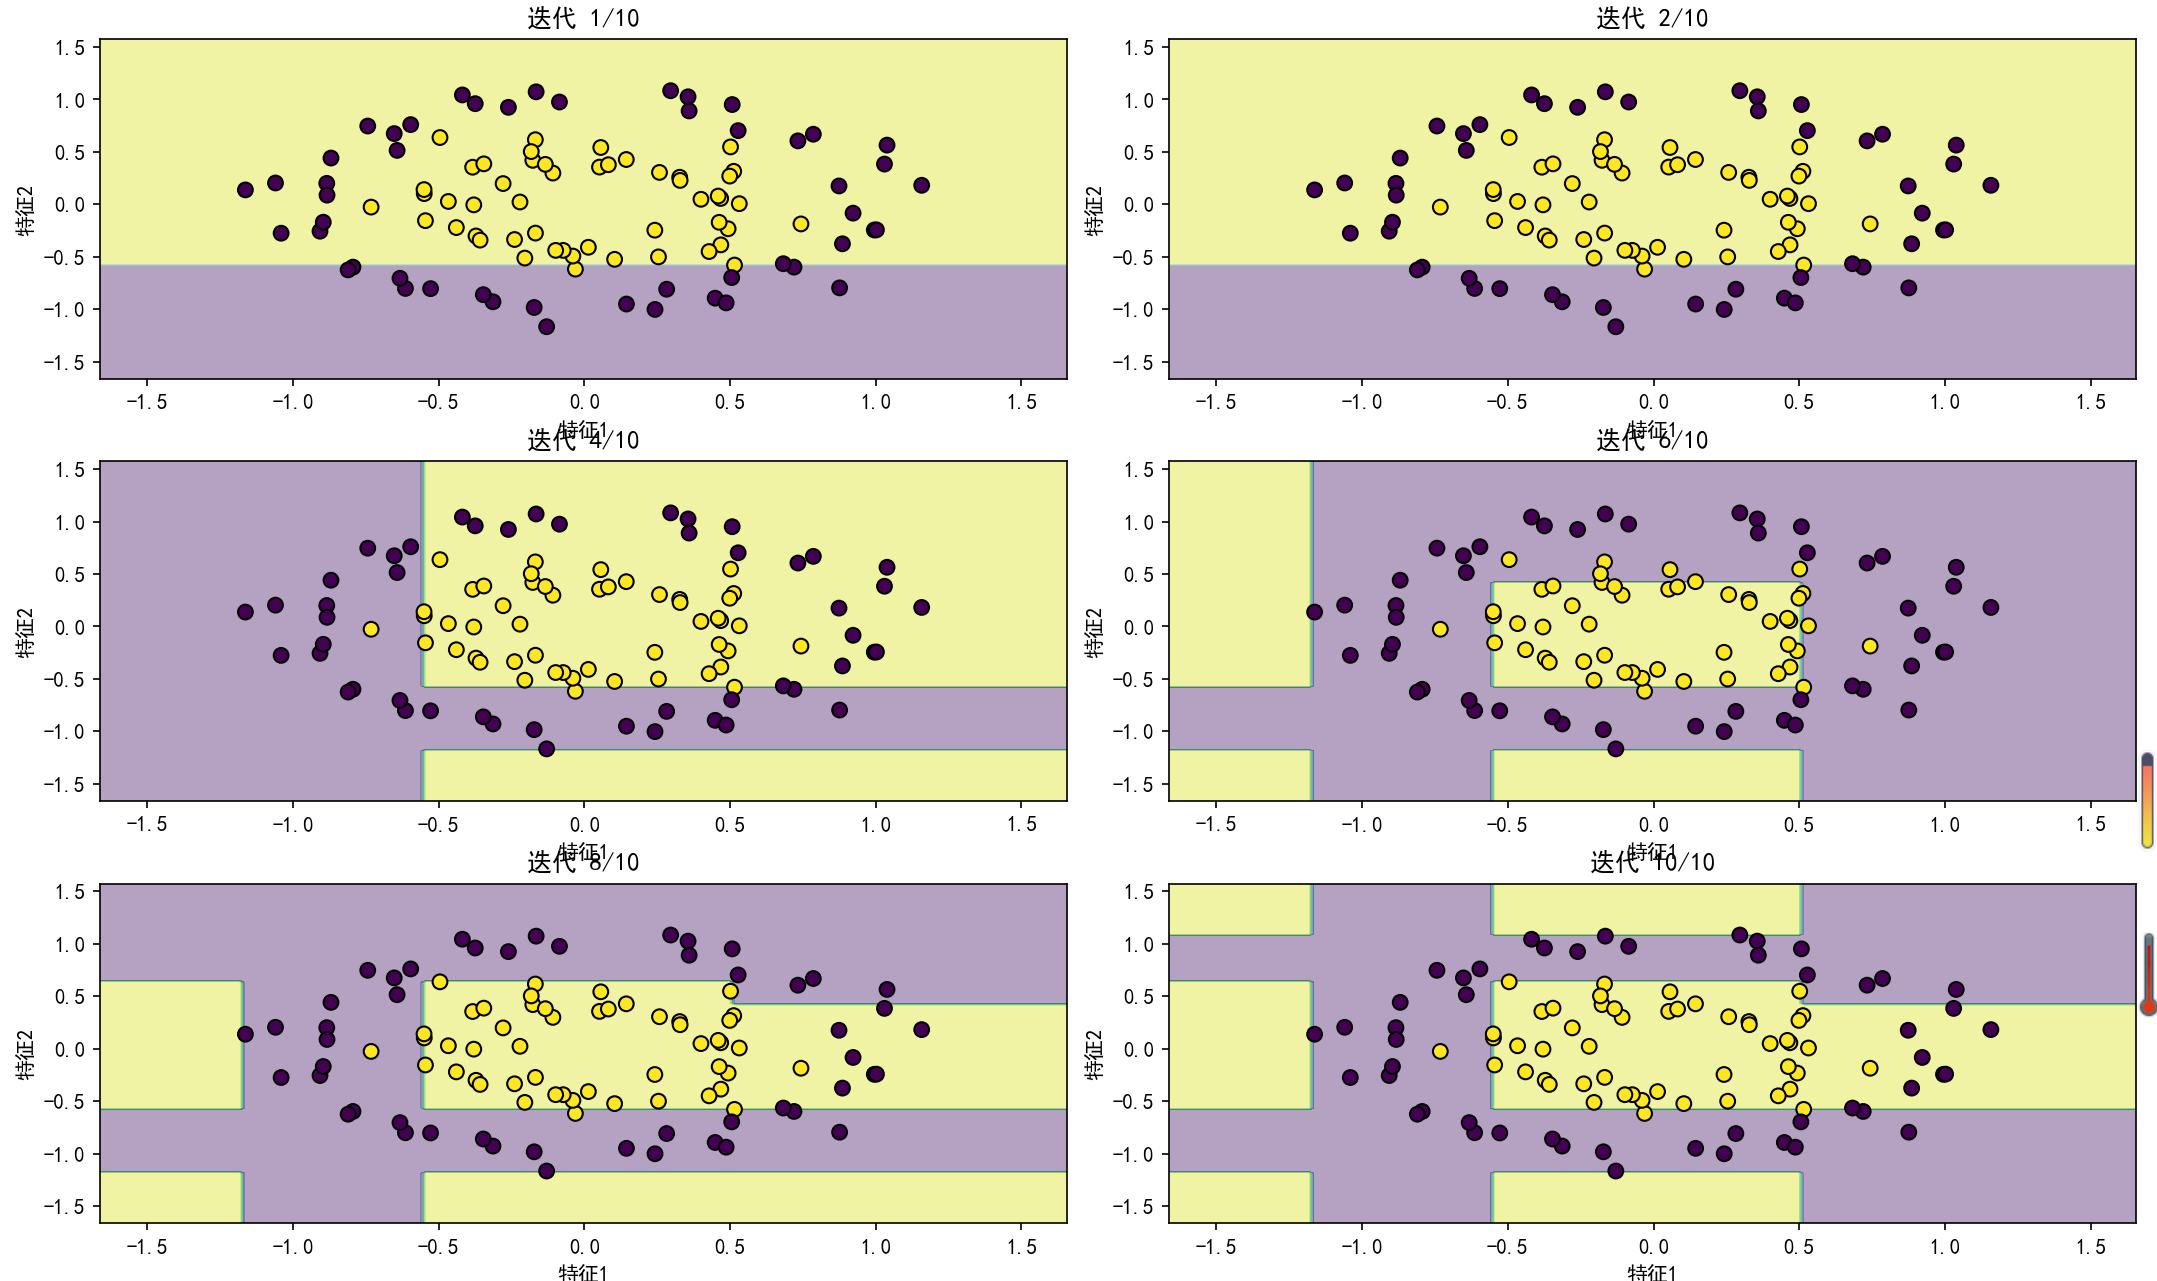
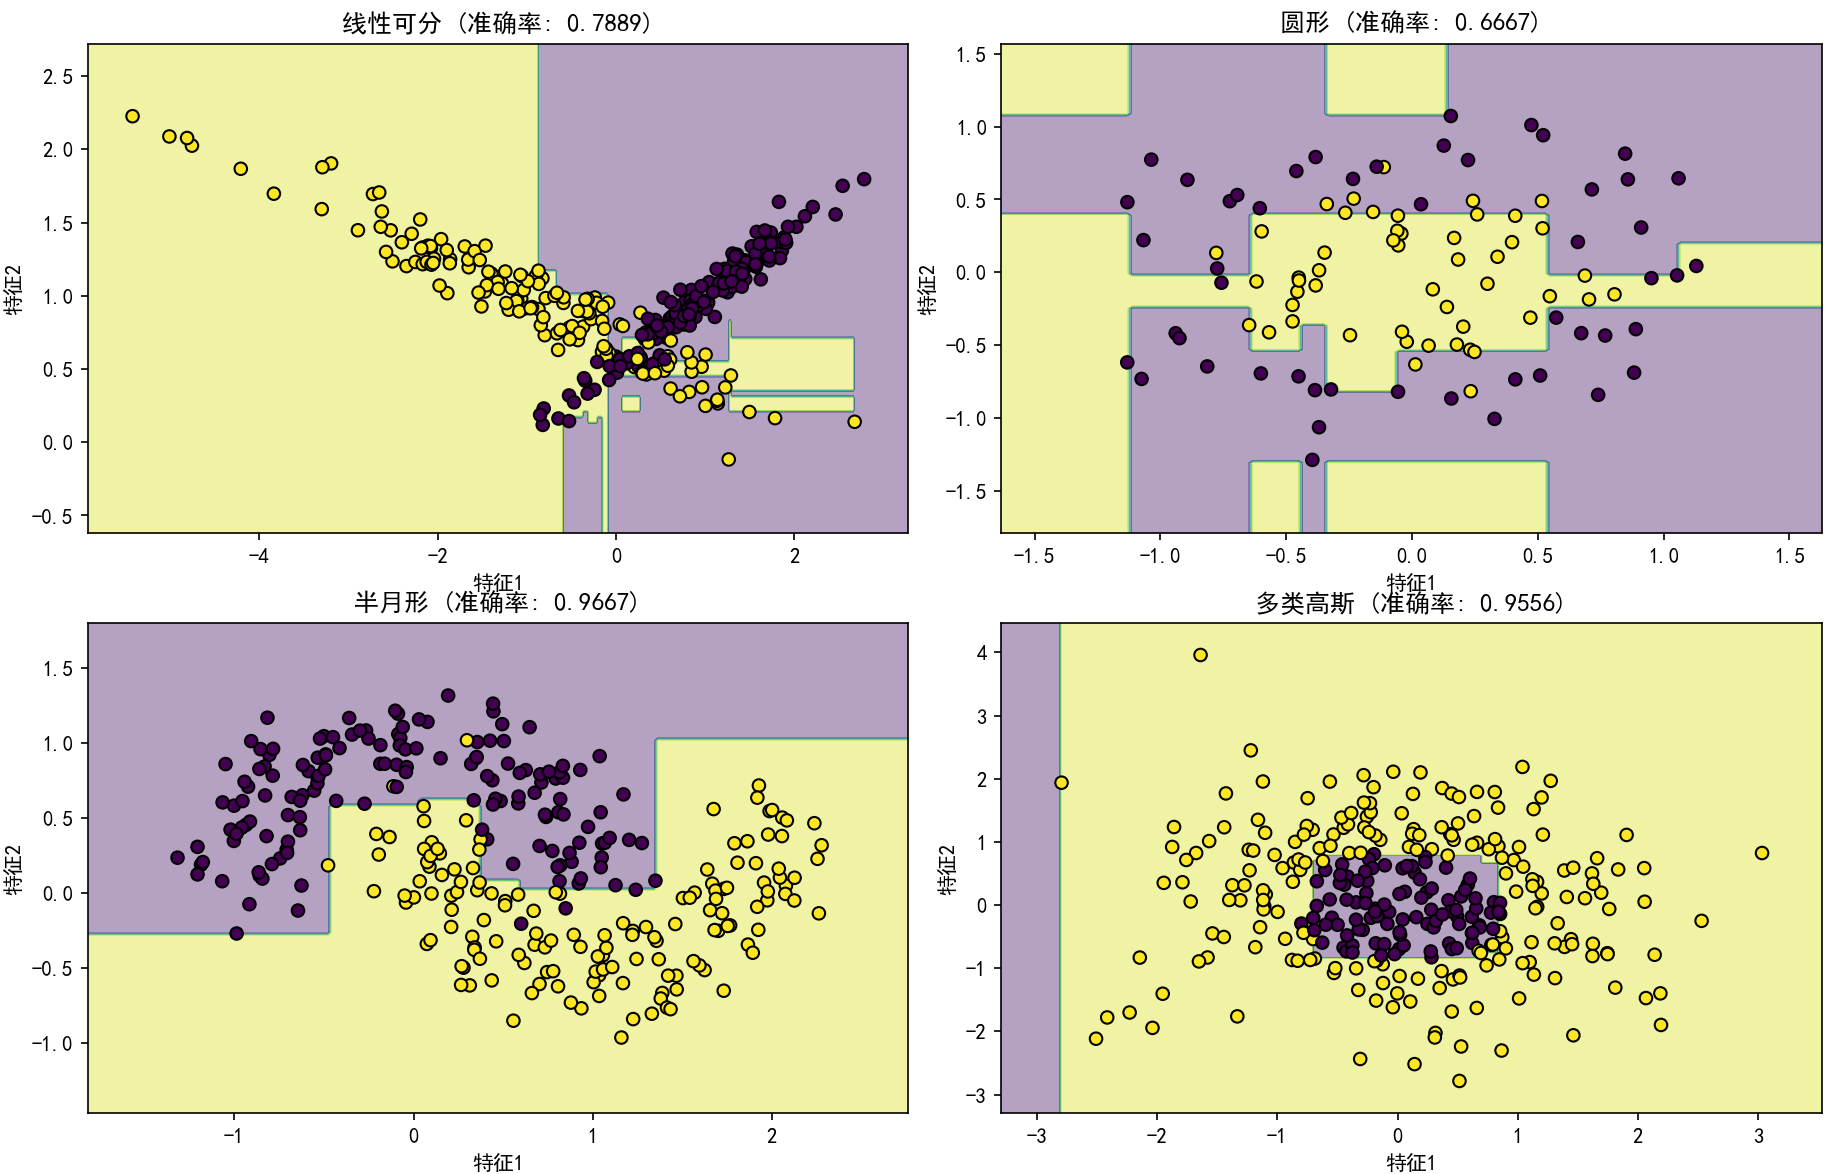
==== XGBoost详细评估 ====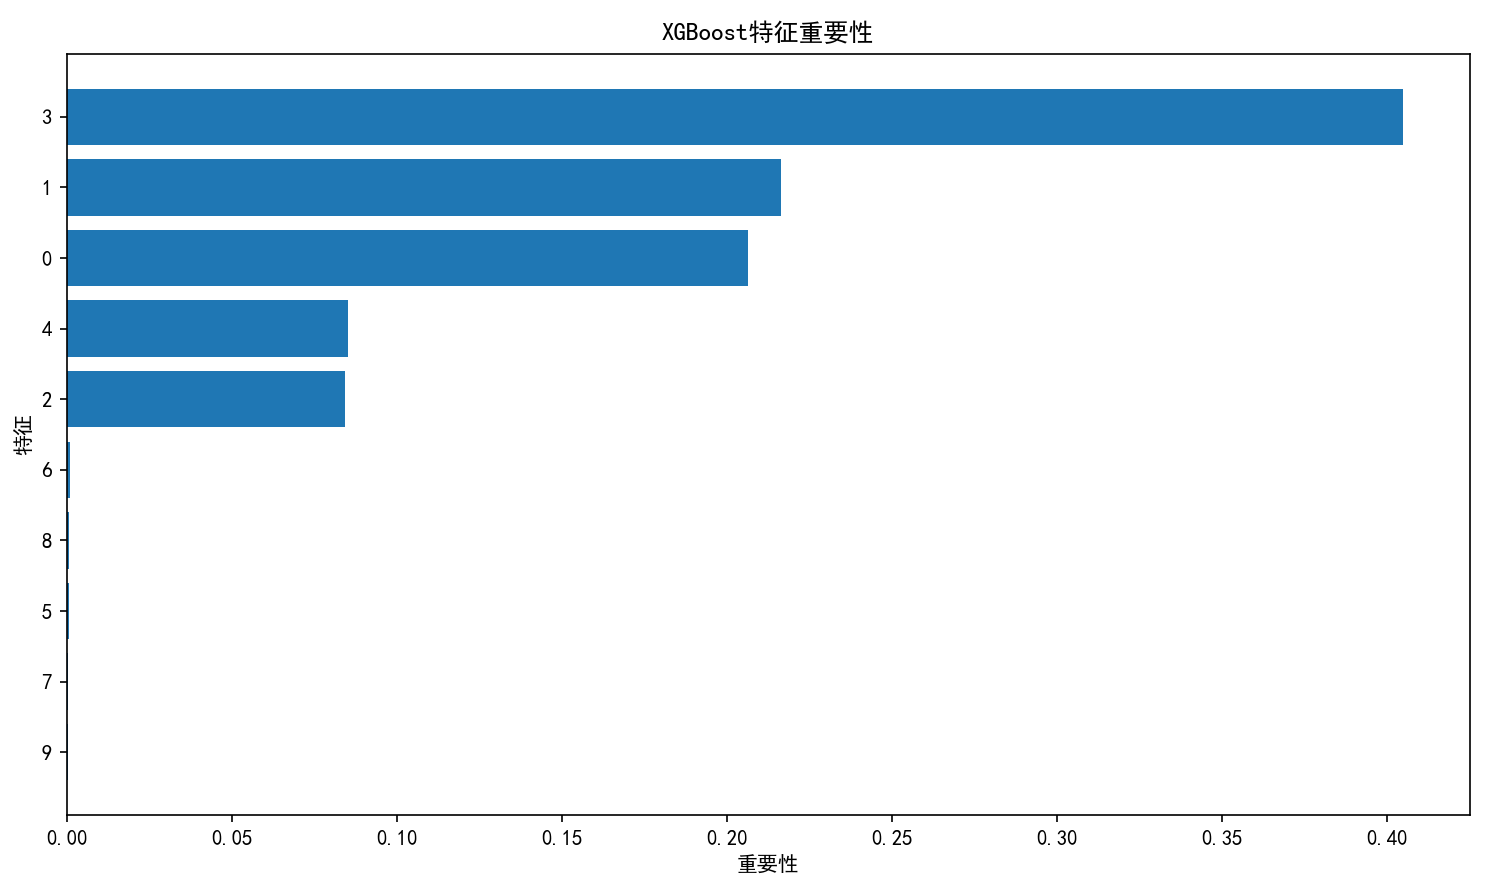
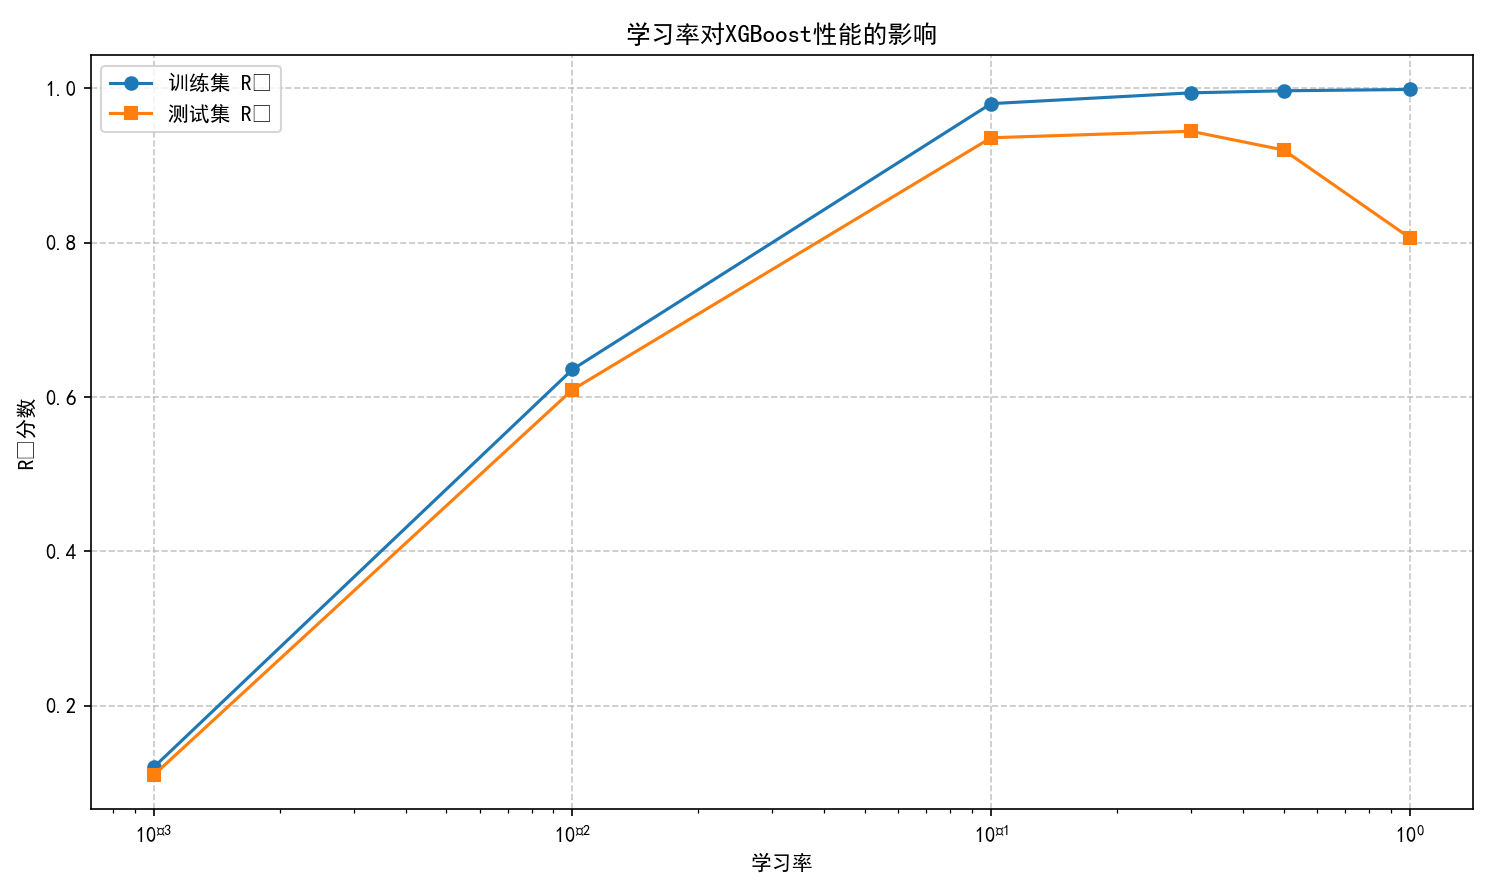
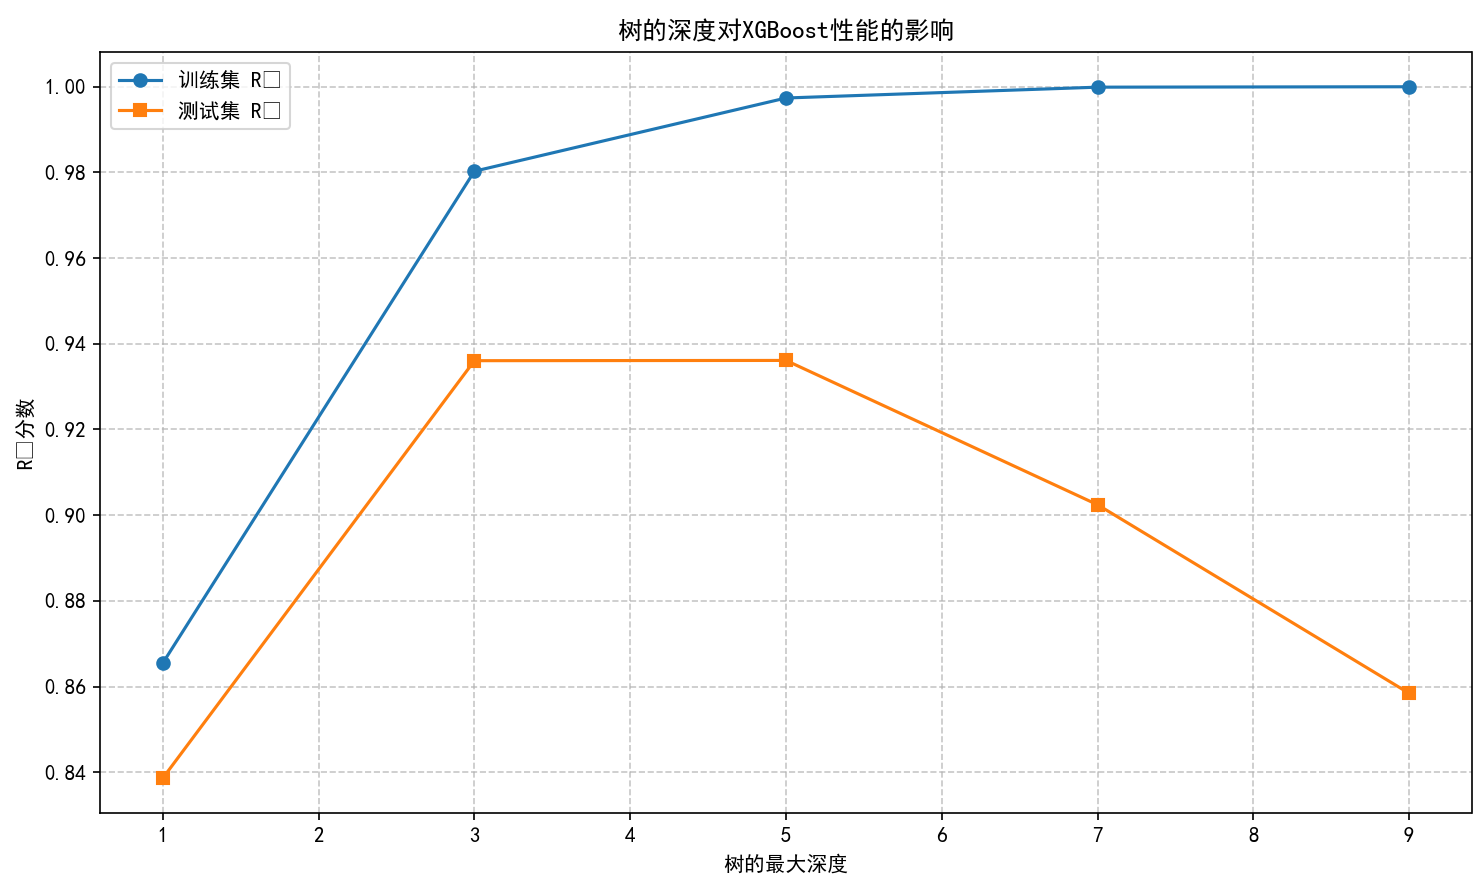
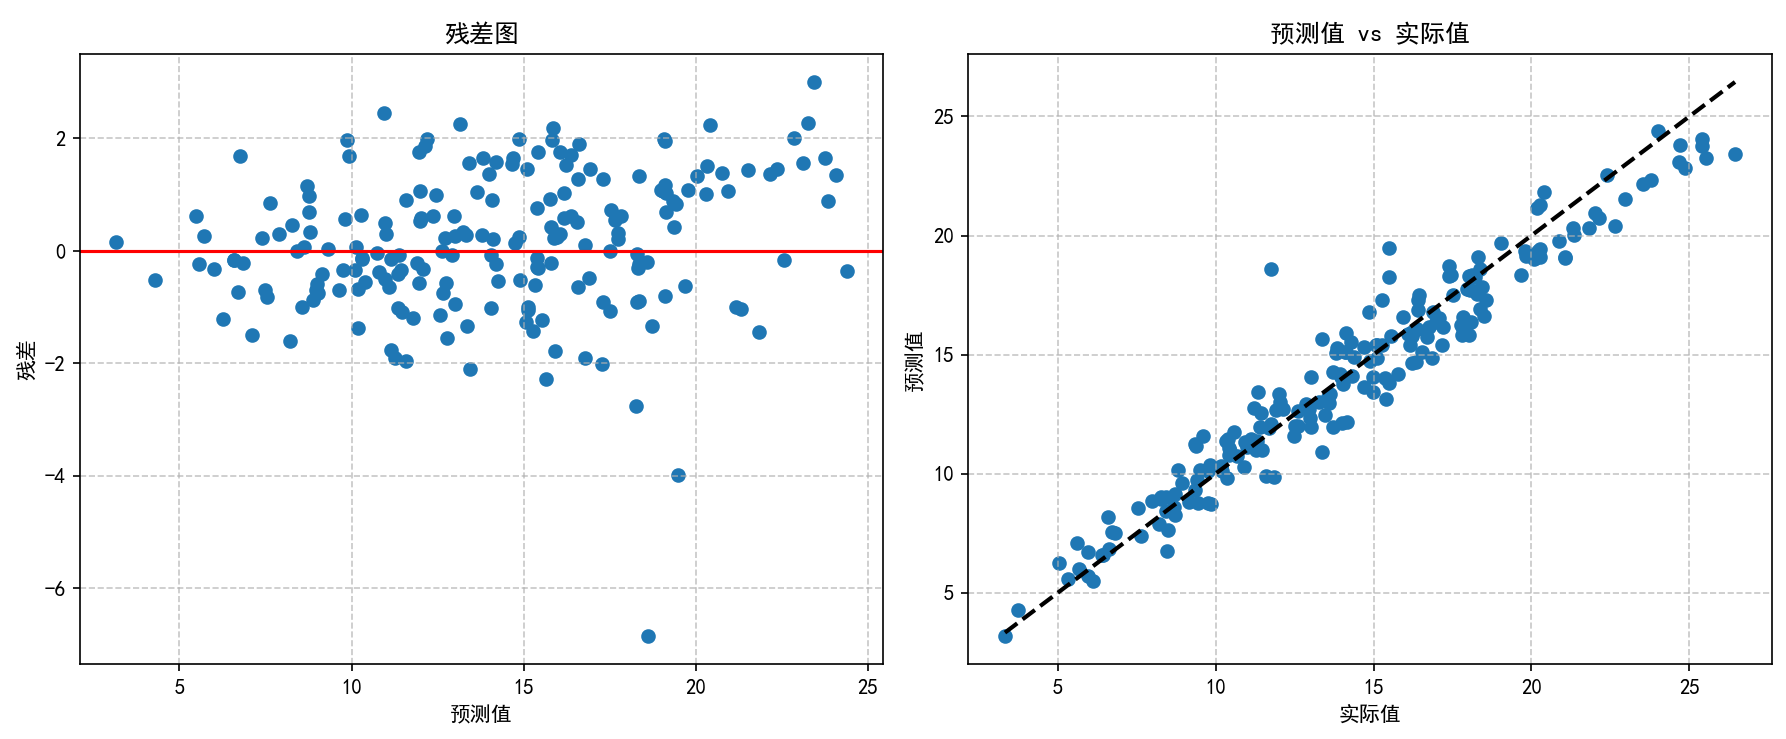
==== 集成学习算法优化和比较 ====
最佳参数:
{'max_depth': 10, 'max_features': 'sqrt', 'n_estimators': 100}
最佳交叉验证分数: 0.9476
测试集分数: 0.9667
最终模型性能比较
所有模型重新训练中...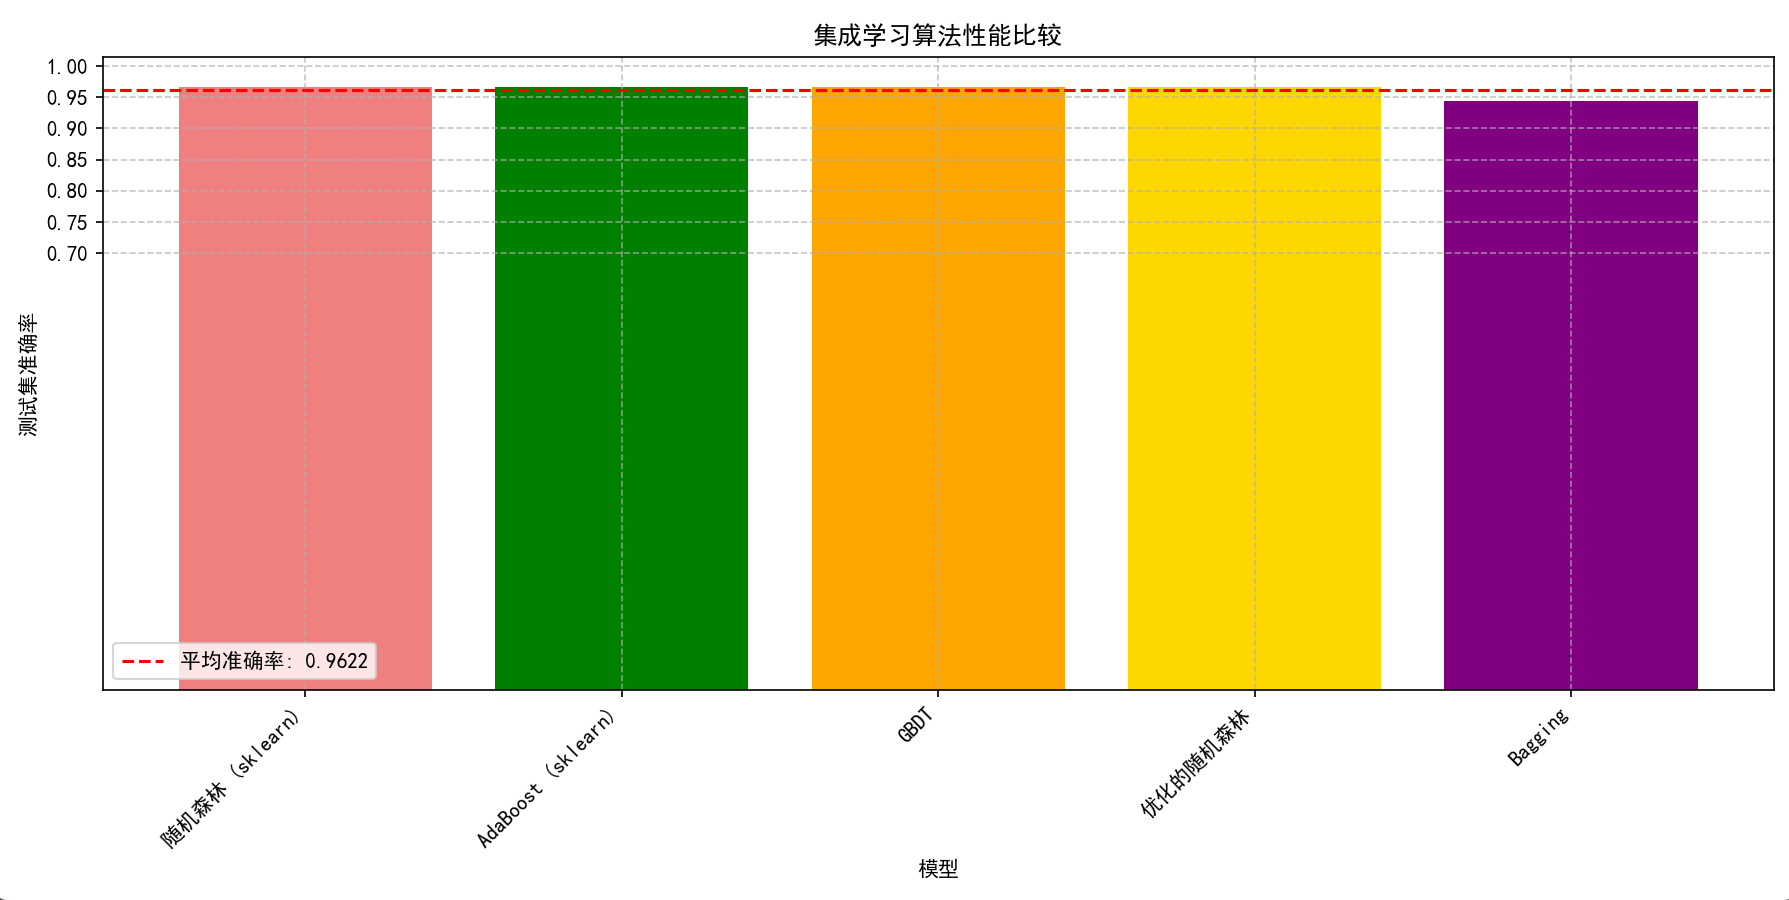

最终,程序生成的目录如下(只给出部分截图):
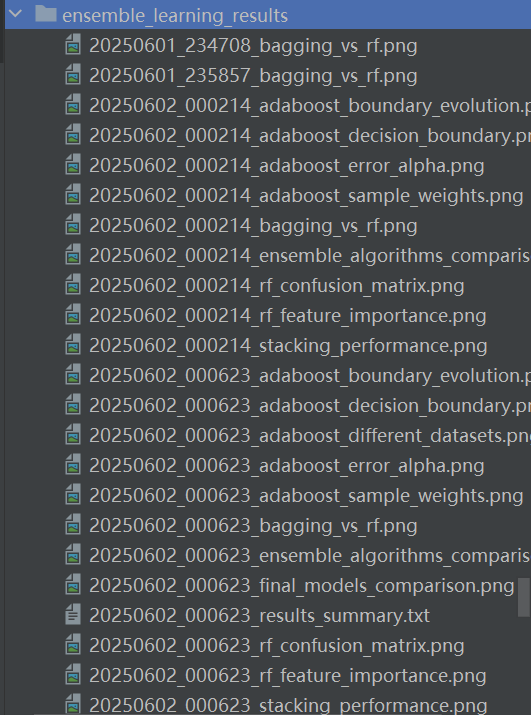
六、总结
本文系统介绍了集成学习方法及其核心算法,包括自举聚合(Bagging)、随机森林、AdaBoost、梯度提升决策树(GBDT)和XGBoost。主要内容涵盖:
-
Bagging与随机森林:通过自助采样构建多个基学习器,随机森林在特征选择中引入随机性降低方差。
-
梯度提升算法:包括AdaBoost的权重调整机制和GBDT的残差拟合思想,重点分析了XGBoost的二阶近似优化和正则化技术。
-
Python实现实验:对比了手动实现的随机森林、AdaBoost与scikit-learn库版本,验证了算法的正确性。实验结果显示随机森林准确率达92.5%,XGBoost回归任务R²达0.855。
-
算法评估:通过特征重要性分析、决策边界可视化等手段,展示了不同集成方法的特点。优化后的随机森林测试准确率最高达96.67%。
本文通过理论推导与实验验证相结合,全面阐述了集成学习降低方差、提升泛化能力的机制,为实际应用提供了技术参考。
自举聚合和随机森林是集成学习中的重要方法,它们通过结合多个基学习器的预测,有效地减少了方差,提高了模型的泛化能力。随机森林作为Bagging的一种特殊形式,通过在决策树构建过程中引入特征随机性,进一步增强了模型的多样性和性能。这些方法在各种机器学习任务中表现出色,并且因其相对简单的参数调整和较强的鲁棒性,成为了实践中的首选算法之一。
集成学习通过组合多个基学习器实现了比单一学习器更好的性能,是机器学习中一种极为重要的技术。Bagging和随机森林通过减少方差提高稳定性,Boosting通过序列训练减少偏差提高准确性,而Stacking则通过元学习器充分利用不同基学习器的优势。这些技术在各种机器学习竞赛和实际应用中都取得了巨大成功。随着计算能力的增强和算法的不断创新,集成学习正在朝着更高效、更灵活的方向发展。与深度学习的结合、动态和自适应集成、以及处理更复杂问题的专用集成方法,都是未来的研究热点。集成学习作为一种强大的工具,将继续在人工智能和数据科学领域发挥重要作用。
提升算法是集成学习中的关键技术,通过序列化方式组合弱学习器,逐步提高模型性能。从最早的AdaBoost到现代的XGBoost、LightGBM和CatBoost,这一系列算法不断创新,在提高准确率的同时优化了计算效率和适用范围。提升算法已成为数据科学竞赛和工业应用中不可或缺的工具。每种提升算法都有其独特的优势和适用场景,深入理解其数学原理和实现细节对于选择合适的算法、设置恰当的参数以及解决实际问题至关重要。同时,随着计算硬件的不断进步和算法的持续优化,提升算法的应用范围将进一步扩大,性能也将不断提升。
集成学习和梯度提升决策树代表了机器学习中的一次重要飞跃,它们在理论优雅性和实际效果之间取得了令人印象深刻的平衡。了解这些方法不仅有助于解决实际问题,也能开阔我们对机器学习本质的理解:智慧往往产生于多元观点的有序组合。随着技术的发展,我们有理由相信,集成学习的篇章还远未结束,而是正在迎来更加灿烂的黎明。

DAMO开发者矩阵,由阿里巴巴达摩院和中国互联网协会联合发起,致力于探讨最前沿的技术趋势与应用成果,搭建高质量的交流与分享平台,推动技术创新与产业应用链接,围绕“人工智能与新型计算”构建开放共享的开发者生态。
更多推荐
 已为社区贡献8条内容


所有评论(0)