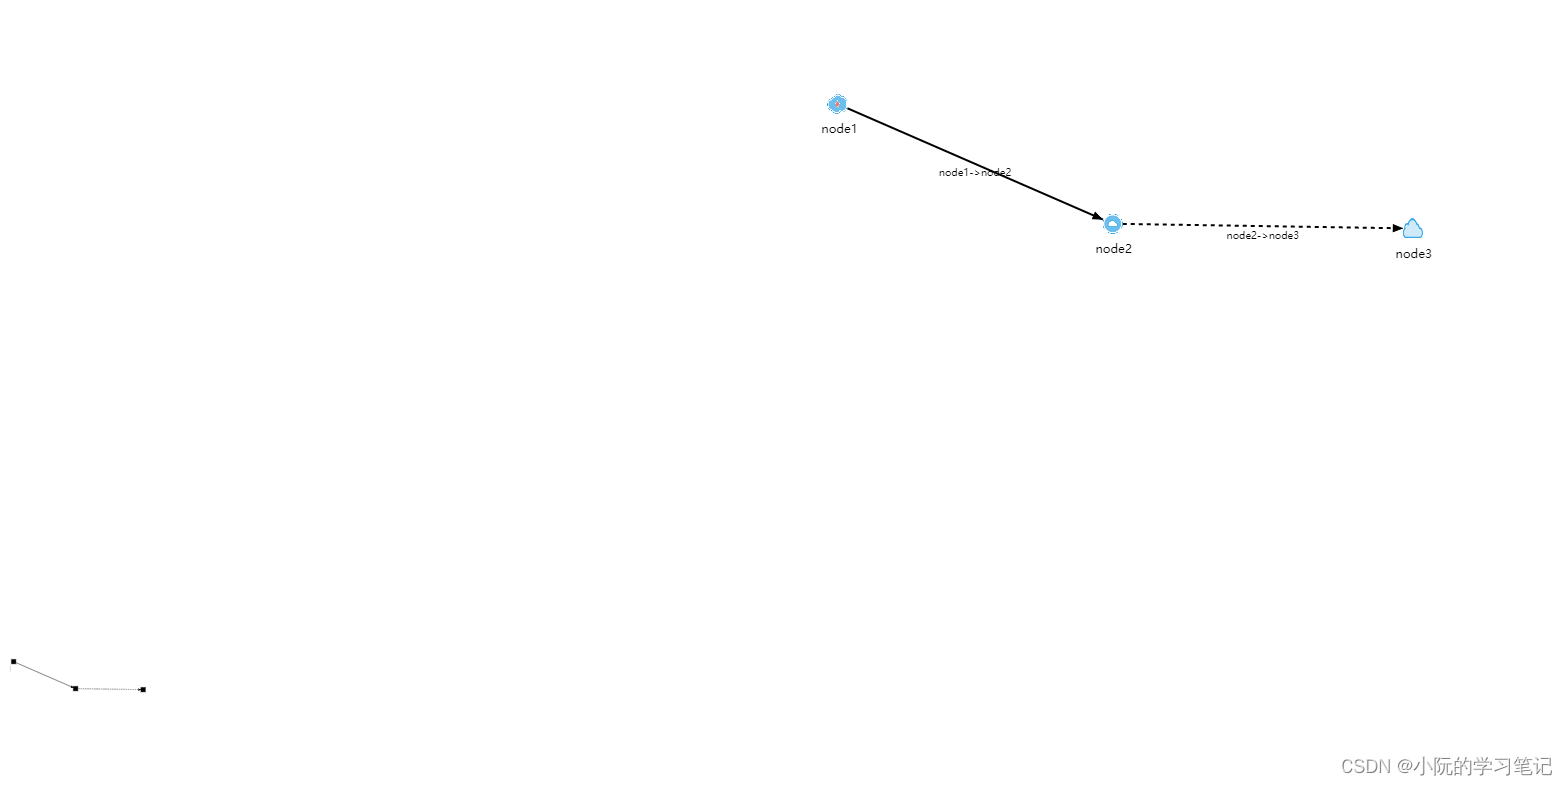
antv-g6实现拓扑图可视化展示,动态修改数据
antv g6 拓扑图可视化 动态数据修改 自定义节点边 动画
·
实现的功能
- 动态修改数据(包括添加和删除),打开vuedevtools试试看吧
- 自定义节点和边(完全自定义,未继承默认)
- 边动画
- 拖拽
- minimap
- hover信息展示
可以根据自己的需求进行扩展
比如:高亮、节点折叠隐藏、图例、视图聚焦等。我试过都能实现
预览地址
仓库地址
一些代码实现,详细请看源码
- 初始化Graph
      this.graph = new G6.Graph({
        container: container,
        width,
        height,
        plugins: [minimap],//插件
        defaultNode: {//默认节点配置,我使用的是自定义的节点
          type: "machine",
          size: this.config.node.size,
          labelCfg: {//label
            style: {
              fill: this.config.node.textColor,
              fontSize: this.config.node.fontSize,
            },
          },
        },
        defaultEdge: {//默认边配置
          type: "line-growth",
          labelCfg: {//label
            refY: -10,
            style: {
              fontSize: this.config.edge.fontSize,
              fill: this.config.edge.stroke,
            },
          },
          style: {
            lineWidth: this.config.edge.lineWidth,
            stroke: this.config.edge.stroke,
            endArrow: {//箭头
              path: G6.Arrow.triangle(8, 10, 0),
              fill: this.config.edge.stroke,
            },
          },
        },
        // 布局配置,力导图
        layout: {
          type: "force",
          alpha: 1,
          preventOverlap: true,
          linkDistance: 300,
          nodeStrenth: -1000,
          onTick: () => {},
          onLayoutEnd: () => {},
        },
        // 模式,拖拽、提示框、缩放等
        modes: {
          default: [
            {
              type: "drag-canvas",
              enableOptimize: true, //拖拽隐藏keyshape外的元素
            },
            {
              type: "zoom-canvas",
              enableOptimize: true,
            },
            {
              type: "tooltip", //提示框
              formatText(model) {
                const text = `
                <div class="tooltips">
                  <p>${model.label}</p>
                </div>
                `;
                return text;
              },
            },
          ],
        },
      });
- minimap 初始化,放到plugin就行了
    initMinimap() {
      return new G6.Minimap({
        size: [160, 160],
        className: "minimap",
        type: "delegate", //渲染成本:default>keyShape>delegate
        delegateStyle: {
          fill: this.config.edge.stroke,
          stroke: this.config.edge.stroke,
        },
      });
    },
- 完全自定义的节点。动态更新节点,当初找了很久,但是没有找到完全自定义的,就自己摸索写了,官网也没有。
    renderNode() {
      let _this = this;
      G6.registerNode("machine", {
        // 画节点
        draw(cfg, group) {
          const shape = group.addShape("image", {
            attrs: _this.nodeAttrsSetting("image", cfg),
            name: "img",
            draggable: true, //不设置将无法拖拽
          });
          group.addShape("text", {
            attrs: _this.nodeAttrsSetting("text", cfg),
            name: "title",
            draggable: true, //不设置将无法拖拽
          });
          // 返回的shape将作为keyShape
          return shape;
        },
        // 添加动画
        afterDraw(cfg, group) {
          const img = group.findAllByName("img");
          const text = group.findAllByName("title");
          if (cfg.status === 0 && img[0]) {
            _this.nodeAnimation(img[0], text[0]);
          }
        },
        // 更新操作,基本上等于重画一次
        update(cfg, node) {
          const group = node.getContainer();
          const shapeNodeImage = group.getChildren()[0];
          const shapeNodeText = group.getChildren()[1];
          if (cfg.status === 0) {
            if (!shapeNodeImage.cfg.animating) {
              _this.nodeAnimation(shapeNodeImage, shapeNodeText);
            }
          } else {
            shapeNodeImage.stopAnimate();
            shapeNodeText.stopAnimate();
          }

          // 更新写在最后
          shapeNodeImage.attr(_this.nodeAttrsSetting("image", cfg));
          shapeNodeText.attr(_this.nodeAttrsSetting("text", cfg));
        },
        // 剩下的什么 setState 可以根据自己的需求来
      });
    },
- 完全自定义边。动态添加(根据数据变化)动画效果和停止动画效果
    renderEdge() {
      let _this = this;
      G6.registerEdge("line-growth", {
        // 画边
        draw(cfg, group) {
          const shape = group.addShape("path", {
            attrs: _this.edgeAttrsSetting("path", cfg),
            name: "path-shape",
          });
          if (cfg.label) {
            group.addShape("text", {
              attrs: _this.edgeAttrsSetting("text", cfg),
              name: "text-shape",
            });
          }
          return shape;
        },
        // 添加动画
        afterDraw(cfg, group) {
          const shape = group.getChildren()[0]; //path
          if (cfg.status === 0) {
            _this.edgeDashAnimation(shape);
          }
        },
        // 更新
        update(cfg, edge) {
          const group = edge.getContainer();
          const shapeEdgePath = group.getChildren()[0];
          const shapeEdgeText = group.getChildren()[1];
          if (cfg.status === 0) {
            if (!shapeEdgePath.cfg.animating) {
              _this.edgeDashAnimation(shapeEdgePath);
            }
          } else {
            shapeEdgePath.stopAnimate();
            shapeEdgePath.attr("lineDash", null);
          }

          // 更新写在最后
          shapeEdgePath.attr(_this.edgeAttrsSetting("path", cfg));
          shapeEdgeText.attr(_this.edgeAttrsSetting("text", cfg));
        },
      });
    },
自定义节点和边,最重要的就是update,但是官网很少有示例。
- 拖拽实现,官网例子很多
    initDrag() {
      this.graph.on("node:dragstart", (e) => {
        this.graph.layout();
        refreshDragedNodePosition(e);
      });
      this.graph.on("node:drag", (e) => {
        const forceLayout = this.graph.get("layoutController").layoutMethods[0];
        forceLayout.execute();
        refreshDragedNodePosition(e);
      });
      this.graph.on("node:dragend", (e) => {
        e.item.get("model").fx = null;
        e.item.get("model").fy = null;
      });
      function refreshDragedNodePosition(e) {
        const model = e.item.get("model");
        model.fx = e.x;
        model.fy = e.y;
      }
    },
新增功能,添加节点和边构成拓扑图(固定位置)
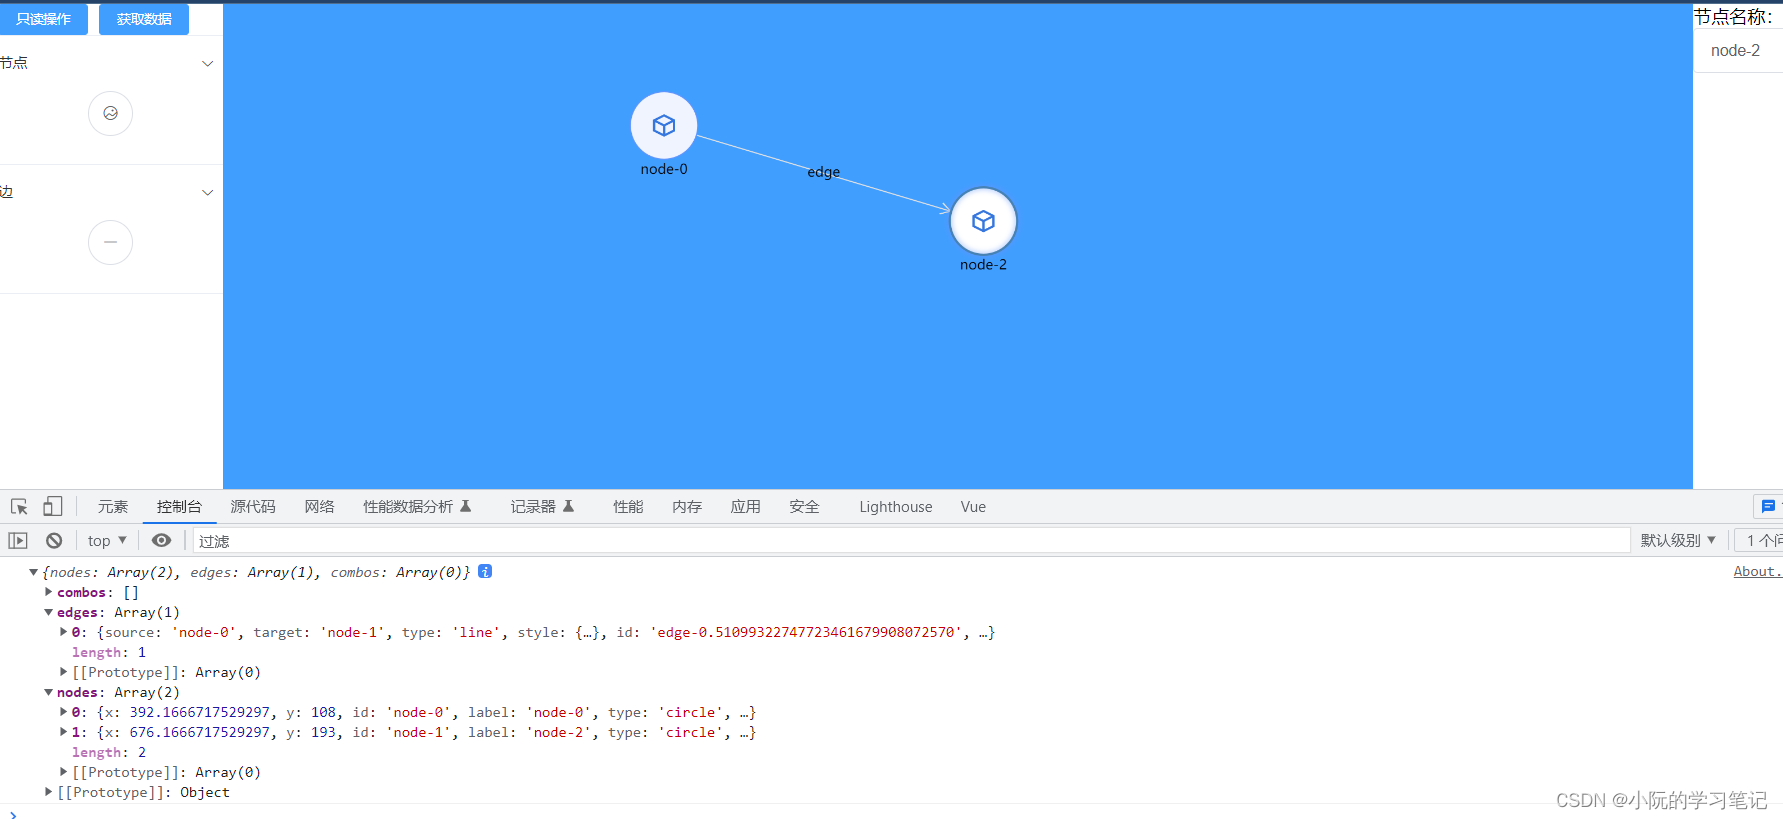
- 新增节点和边
- 更改节点和边的数据
- 获取当前拓扑图的数据
D3实现拓扑图可视化

DAMO开发者矩阵,由阿里巴巴达摩院和中国互联网协会联合发起,致力于探讨最前沿的技术趋势与应用成果,搭建高质量的交流与分享平台,推动技术创新与产业应用链接,围绕“人工智能与新型计算”构建开放共享的开发者生态。
更多推荐


 7
7 0
0- 0


 已为社区贡献2条内容

所有评论(0)