入门OpenTelemetry——日志数据采集与导出
Logging。
日志数据收集方案
目前日志自动埋点支持主要有:
- .NET、Java、Python SDK 开始支持正式的日志记录,控制台打印的日志均可自动采集。
- JavaScript / go 等暂时需用
span.addEvent()或通过标准输出间接采集。
日志的采集方式一般是:
- ✅ 使用 OTel SDK +
LoggingAPI(手动埋点日志) - ✅ 使用日志框架(如 logback)将日志转为 OTLP logs
- ✅ 使用 Fluent Bit / Filebeat 收集 stdout → 发送到 OTLP Receiver
日志导出(kafka)
部署 kafka
部署 kafka 具体可参考文档:https://www.cuiliangblog.cn/detail/section/190398674
配置 Collector
配置 collector 导出 日志数据到 kafka 中。
apiVersion: opentelemetry.io/v1beta1
kind: OpenTelemetryCollector
# 元数据定义部分
metadata:
  name: center        # Collector 的名称为 center
  namespace: opentelemetry
# 具体的配置内容
spec:
  replicas: 1           # 设置副本数量为1
  config:               # 定义 Collector 配置
    receivers:          # 接收器,用于接收遥测数据(如 trace、metrics、logs)
      otlp:             # 配置 OTLP(OpenTelemetry Protocol)接收器
        protocols:      # 启用哪些协议来接收数据
          grpc:
            endpoint: 0.0.0.0:4317      # 启用 gRPC 协议
          http:
            endpoint: 0.0.0.0:4318      # 启用 HTTP 协议

    processors:         # 处理器,用于处理收集到的数据
      batch: {}         # 批处理器,用于将数据分批发送,提高效率

    exporters:          # 导出器,用于将处理后的数据发送到后端系统
      debug: {}         # 使用 debug 导出器,将数据打印到终端(通常用于测试或调试)
      otlp:               # 数据发送到tempo的grpc端口
        endpoint: "jaeger:4317"
        tls: # 跳过证书验证
          insecure: true
      prometheus:
        endpoint: "0.0.0.0:9464" # prometheus指标暴露端口
      kafka:
        protocol_version: 2.0.0
        brokers:
          - my-cluster-kafka-brokers.kafka.svc:9092  # Kafka 的地址
        topic: otel-logs
        encoding: otlp_json  # 日志通常用 json 格式

    service:            # 服务配置部分
      telemetry:
        logs:
          level: "debug"              # 设置 Collector 自身日志等级为 debug(方便观察日志)
      pipelines:        # 定义处理管道
        traces:         # 定义 trace 类型的管道
          receivers: [otlp]                      # 接收器为 OTLP
          processors: [batch]                    # 使用批处理器
          exporters: [otlp]                      # 将数据导出到OTLP
        metrics:        # 定义 metrics 类型的管道
          receivers: [otlp]                      # 接收器为 OTLP
          processors: [batch]                    # 使用批处理器
          exporters: [prometheus]                # 将数据导出到prometheus
        logs:
          receivers: [otlp]                      # 接收器为 OTLP
          processors: [batch]                    # 使用批处理器
          exporters: [kafka,debug]               # 将数据导出到kafka
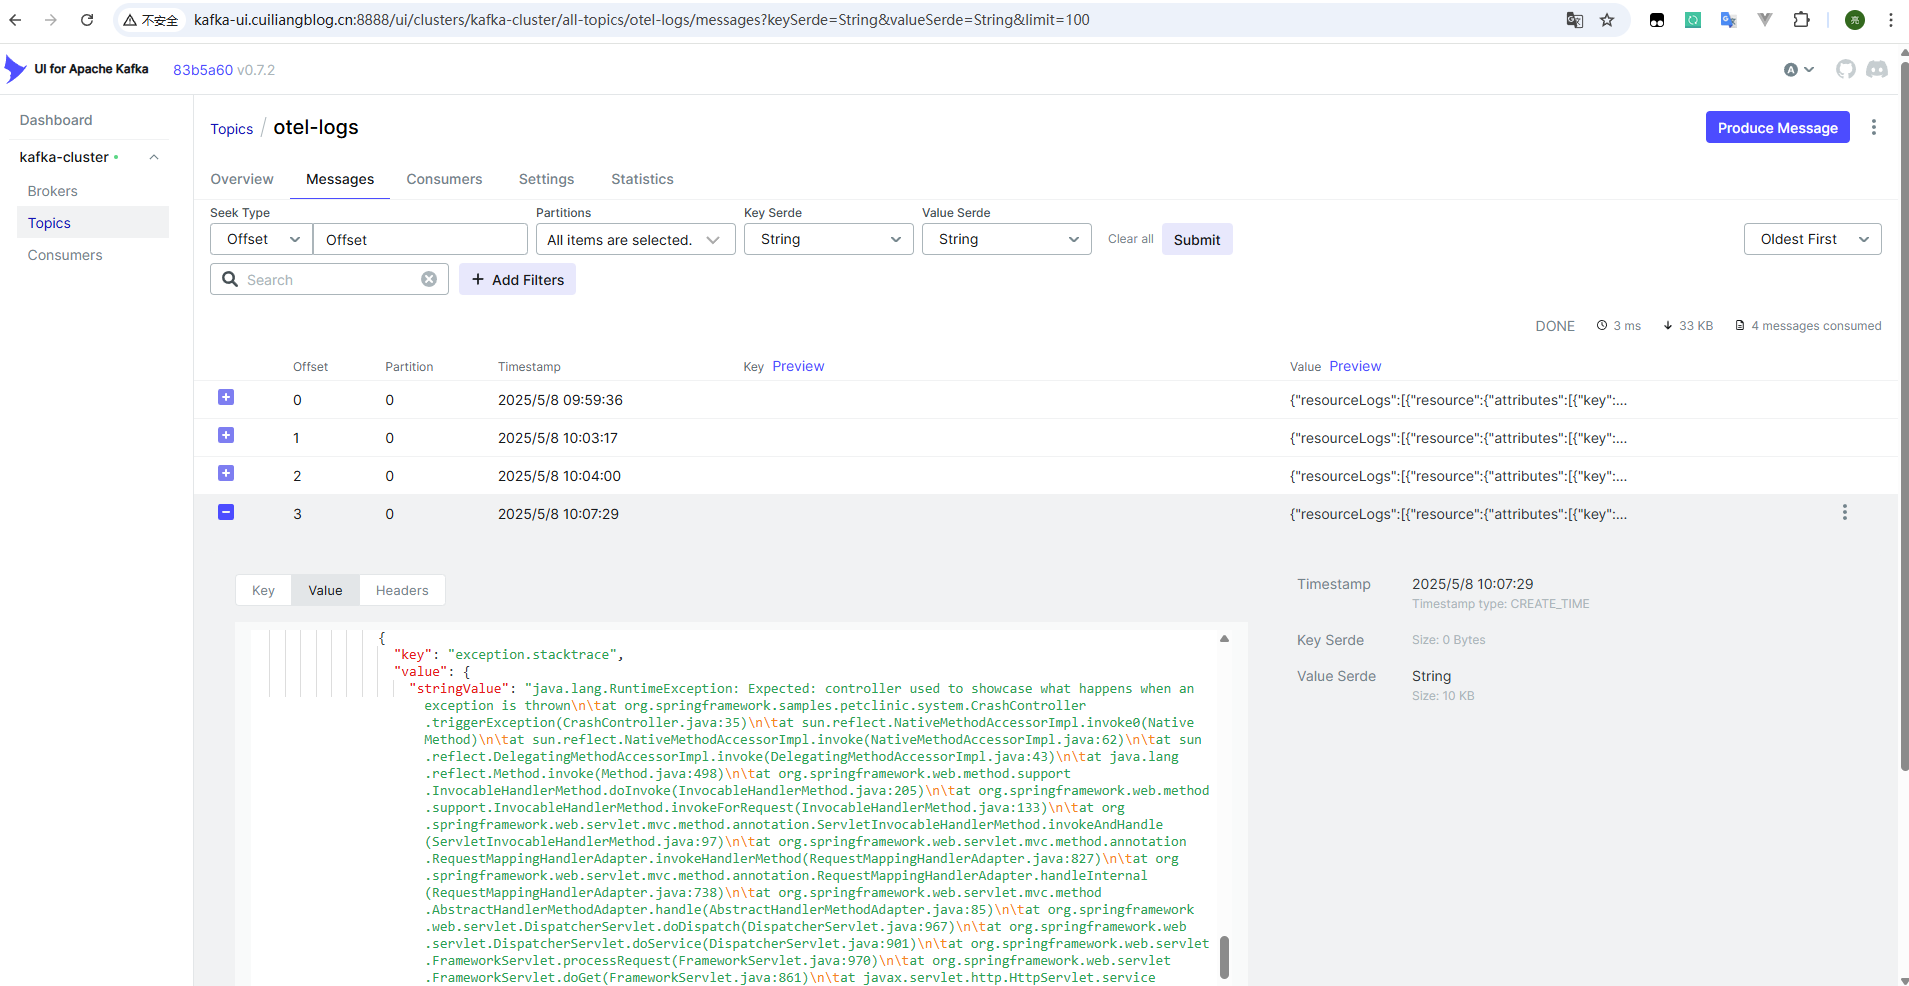
查看日志数据
登录 kafka-ui,查看 otel-logs 主题下的日志数据,内容如下:
日志导出(elasticsearch)
部署 elasticsearch
具体可参考文档:https://www.cuiliangblog.cn/detail/section/15189467
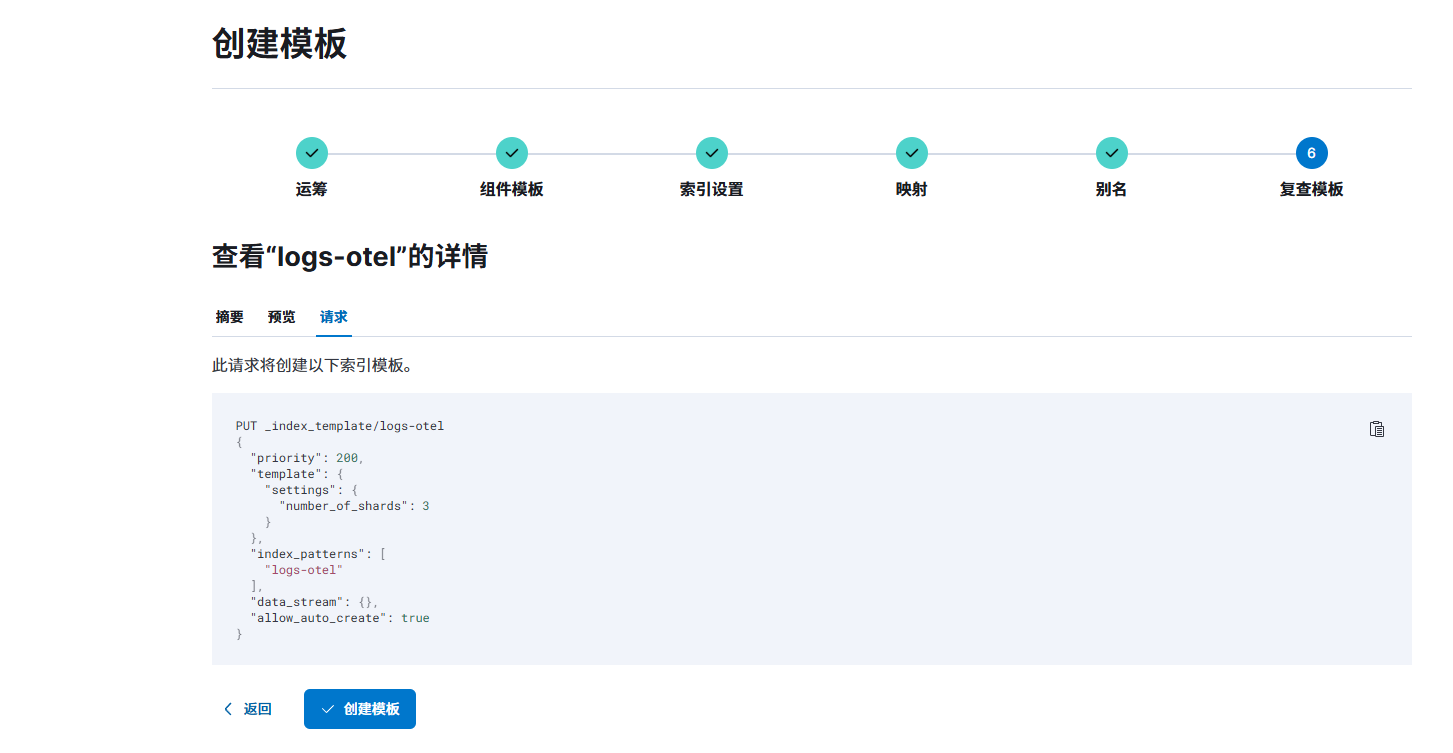
创建数据流模板
配置 Collector
apiVersion: opentelemetry.io/v1beta1
kind: OpenTelemetryCollector
# 元数据定义部分
metadata:
  name: center        # Collector 的名称为 center
  namespace: opentelemetry
# 具体的配置内容
spec:
  replicas: 1           # 设置副本数量为1
  # image: otel/opentelemetry-collector-contrib:latest  # 使用支持 elasticsearch 的镜像
  image: harbor.cuiliangblog.cn/otel/opentelemetry-collector-contrib:latest
  config:               # 定义 Collector 配置
    receivers:          # 接收器,用于接收遥测数据(如 trace、metrics、logs)
      otlp:             # 配置 OTLP(OpenTelemetry Protocol)接收器
        protocols:      # 启用哪些协议来接收数据
          grpc: {}      # 启用 gRPC 协议
          http: {}      # 启用 HTTP 协议

    processors:         # 处理器,用于处理收集到的数据
      batch: {}         # 批处理器,用于将数据分批发送,提高效率

    exporters:          # 导出器,用于将处理后的数据发送到后端系统
      debug: {}         # 使用 debug 导出器,将数据打印到终端(通常用于测试或调试)
      otlp:               # 数据发送到tempo的grpc端口
        endpoint: "jaeger:4317"
        tls: # 跳过证书验证
          insecure: true
      prometheus:
        endpoint: "0.0.0.0:9464" # prometheus指标暴露端口
      elasticsearch:
        endpoints: ["https://elasticsearch-es-http.elk.svc:9200"]
        logs_index: "logs-otel"
        tls:
          insecure_skip_verify: true  # 如果使用自签名证书,临时关闭验证(建议生产环境配置CA)
        user: "admin"
        password: "123.com"

    service:            # 服务配置部分
      telemetry:
        logs:
          level: "debug"              # 设置 Collector 自身日志等级为 debug(方便观察日志)
      pipelines:        # 定义处理管道
        traces:         # 定义 trace 类型的管道
          receivers: [otlp]                      # 接收器为 OTLP
          processors: [batch]                    # 使用批处理器
          exporters: [otlp]                      # 将数据导出到OTLP
        metrics:        # 定义 metrics 类型的管道
          receivers: [otlp]                      # 接收器为 OTLP
          processors: [batch]                    # 使用批处理器
          exporters: [prometheus]          # 将数据导出到prometheus
        logs:
          receivers: [otlp]
          processors: [batch]                    # 使用批处理器
          exporters: [elasticsearch,debug]
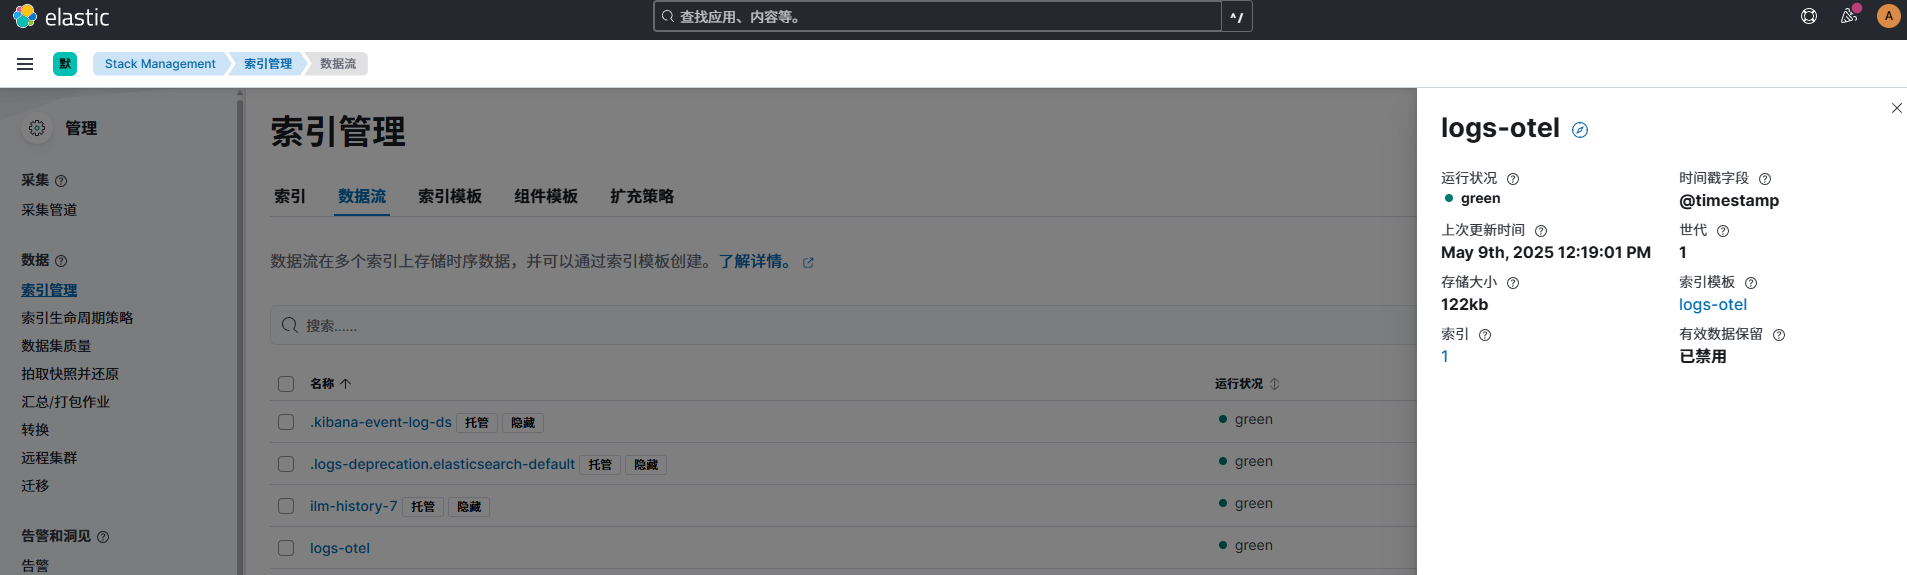
查看日志数据
日志导出(loki)
部署 loki
具体可参考文档:https://www.cuiliangblog.cn/detail/section/219069254
配置 Collector
在 loki3.0 之前的版本,使用lokiexporter导出,具体可参考文档:https://github.com/open-telemetry/opentelemetry-collector-contrib/tree/main/exporter/lokiexporter
但是 3.0 后的版本已弃用 lokiExporter,需要使用 otlphttp 导出,具体可参考文档:https://grafana.com/docs/loki/latest/send-data/otel/
apiVersion: opentelemetry.io/v1beta1
kind: OpenTelemetryCollector
# 元数据定义部分
metadata:
  name: center        # Collector 的名称为 center
  namespace: opentelemetry
# 具体的配置内容
spec:
  replicas: 1           # 设置副本数量为1
  image: otel/opentelemetry-collector-contrib:latest  # 使用支持 elasticsearch 的镜像
  imagePullPolicy: IfNotPresent  # 镜像拉取策略为如果不存在则拉取
  # image: harbor.cuiliangblog.cn/otel/opentelemetry-collector-contrib:latest
  config:               # 定义 Collector 配置
    receivers:          # 接收器,用于接收遥测数据(如 trace、metrics、logs)
      otlp:             # 配置 OTLP(OpenTelemetry Protocol)接收器
        protocols:      # 启用哪些协议来接收数据
          grpc:
            endpoint: 0.0.0.0:4317      # 启用 gRPC 协议
          http:
            endpoint: 0.0.0.0:4318      # 启用 HTTP 协议
    processors:         # 处理器,用于处理收集到的数据
      batch: {}         # 批处理器,用于将数据分批发送,提高效率

    exporters:          # 导出器,用于将处理后的数据发送到后端系统
      debug: {}         # 使用 debug 导出器,将数据打印到终端(通常用于测试或调试)
      otlp:               # 数据发送到tempo的grpc端口
        endpoint: "tempo:4317"
        tls: # 跳过证书验证
          insecure: true
      prometheus:
        endpoint: "0.0.0.0:9464" # prometheus指标暴露端口
      otlphttp:
        endpoint: http://loki.loki.svc:3100/otlp

    service:            # 服务配置部分
      telemetry:
        logs:
          level: "debug"              # 设置 Collector 自身日志等级为 debug(方便观察日志)
      pipelines:        # 定义处理管道
        traces:         # 定义 trace 类型的管道
          receivers: [otlp]                      # 接收器为 OTLP
          processors: [batch]                    # 使用批处理器
          exporters: [otlp]                      # 将数据导出到OTLP
        metrics:        # 定义 metrics 类型的管道
          receivers: [otlp]                      # 接收器为 OTLP
          processors: [batch]                    # 使用批处理器
          exporters: [prometheus]          # 将数据导出到prometheus
        logs:
          receivers: [otlp]
          processors: [batch]                    # 使用批处理器
          exporters: [otlphttp, debug]
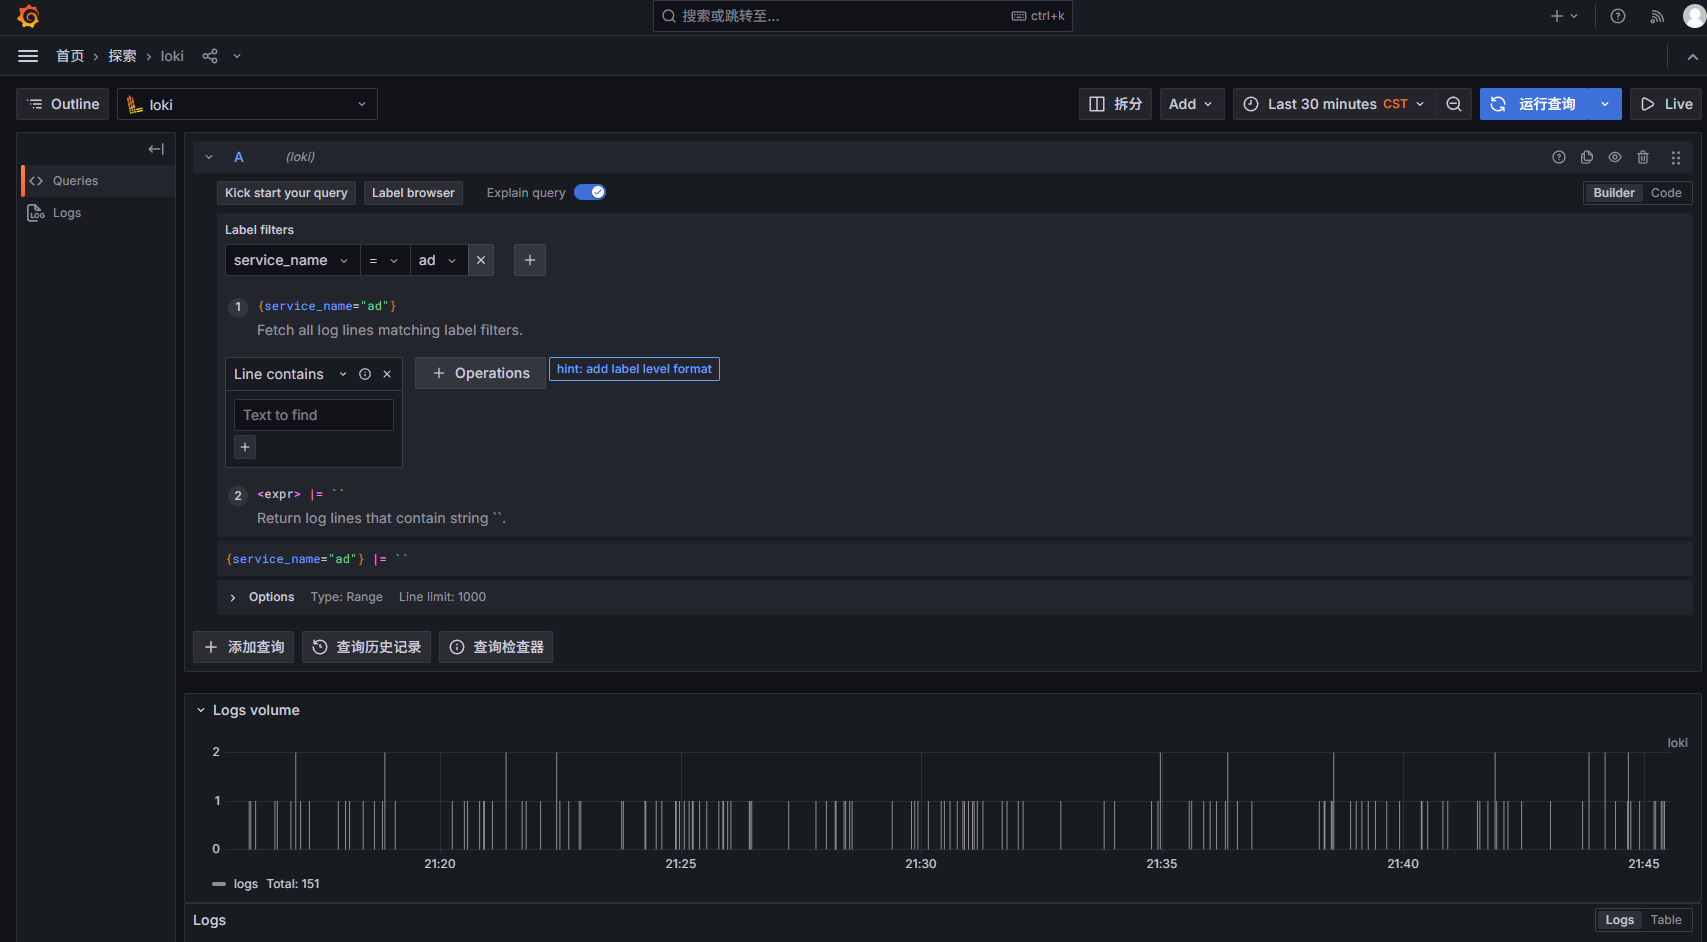
查看日志数据
登录 grafana 查看日志数据
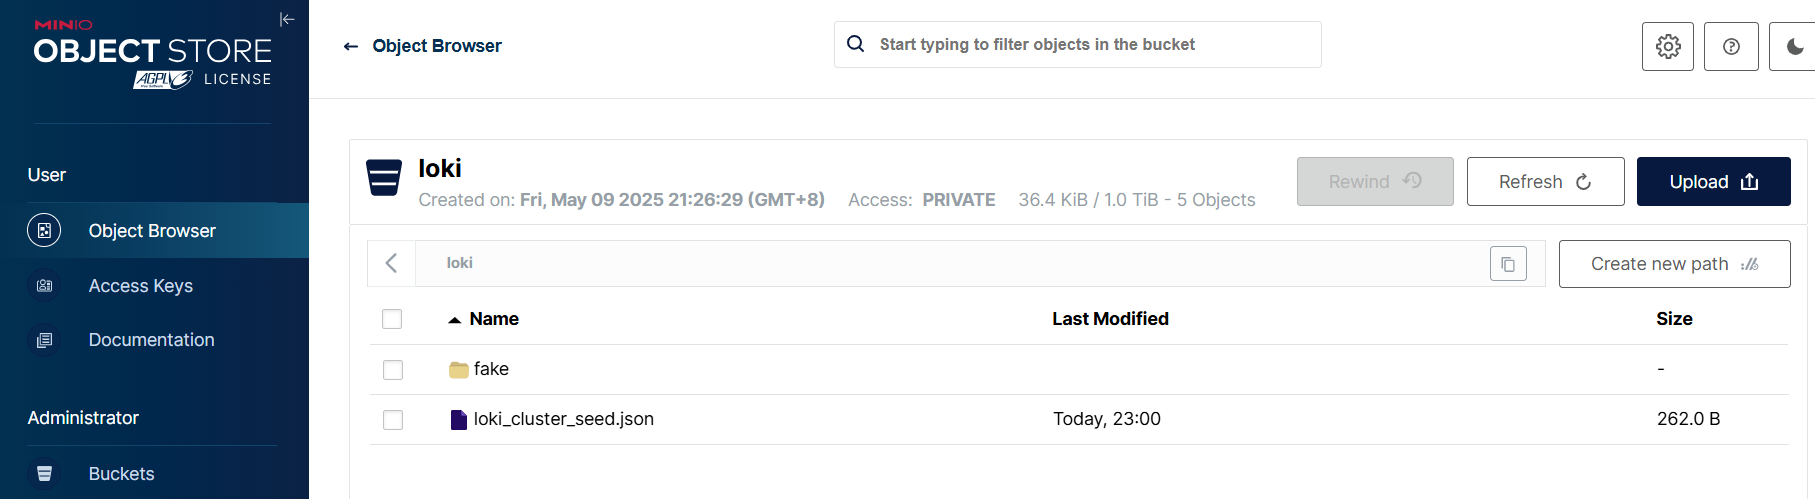
minio 查看对象存储资源
查看更多
崔亮的博客-专注devops自动化运维,传播优秀it运维技术文章。更多原创运维开发相关文章,欢迎访问https://www.cuiliangblog.cn
或关注公众号《崔亮的博客》

DAMO开发者矩阵,由阿里巴巴达摩院和中国互联网协会联合发起,致力于探讨最前沿的技术趋势与应用成果,搭建高质量的交流与分享平台,推动技术创新与产业应用链接,围绕“人工智能与新型计算”构建开放共享的开发者生态。
更多推荐


 23
23 0
0- 0


 已为社区贡献1条内容

所有评论(0)