数据分析实例(股票分析实例)
·
import numpy as np
import pandas as pd
import matplotlib.pyplot as plt
%matplotlib inline
使用pandas的内建函数DataReader从雅虎财经网站读取股价数据
import tushare as ts
pingan = ts.get_k_data('601318',start='2011-01-01')
pingan.head()
| date | open | close | high | low | volume | code | |
|---|---|---|---|---|---|---|---|
| 0 | 2011-01-04 | 24.984 | 25.011 | 25.314 | 24.830 | 245626.0 | 601318 |
| 1 | 2011-01-05 | 24.870 | 24.110 | 24.962 | 24.083 | 427554.0 | 601318 |
| 2 | 2011-01-06 | 24.145 | 23.112 | 24.145 | 22.611 | 947078.0 | 601318 |
| 3 | 2011-01-07 | 23.279 | 23.297 | 23.842 | 22.765 | 659013.0 | 601318 |
| 4 | 2011-01-10 | 23.248 | 22.866 | 23.688 | 22.809 | 282919.0 | 601318 |
pingan.tail()
| date | open | close | high | low | volume | code | |
|---|---|---|---|---|---|---|---|
| 1999 | 2019-04-03 | 78.48 | 79.86 | 80.15 | 78.37 | 760219.0 | 601318 |
| 2000 | 2019-04-04 | 80.08 | 80.20 | 80.96 | 79.25 | 795626.0 | 601318 |
| 2001 | 2019-04-08 | 80.70 | 80.59 | 82.25 | 80.02 | 916122.0 | 601318 |
| 2002 | 2019-04-09 | 80.40 | 81.10 | 82.00 | 80.37 | 601737.0 | 601318 |
| 2003 | 2019-04-10 | 80.80 | 82.03 | 82.11 | 79.66 | 783620.0 | 601318 |
pingan['date'] = pd.to_datetime(pingan.date)
pingan.set_index('date',inplace = True)
pingan.index
DatetimeIndex(['2011-01-04', '2011-01-05', '2011-01-06', '2011-01-07',
               '2011-01-10', '2011-01-11', '2011-01-12', '2011-01-13',
               '2011-01-14', '2011-01-17',
               ...
               '2019-03-27', '2019-03-28', '2019-03-29', '2019-04-01',
               '2019-04-02', '2019-04-03', '2019-04-04', '2019-04-08',
               '2019-04-09', '2019-04-10'],
              dtype='datetime64[ns]', name='date', length=2004, freq=None)
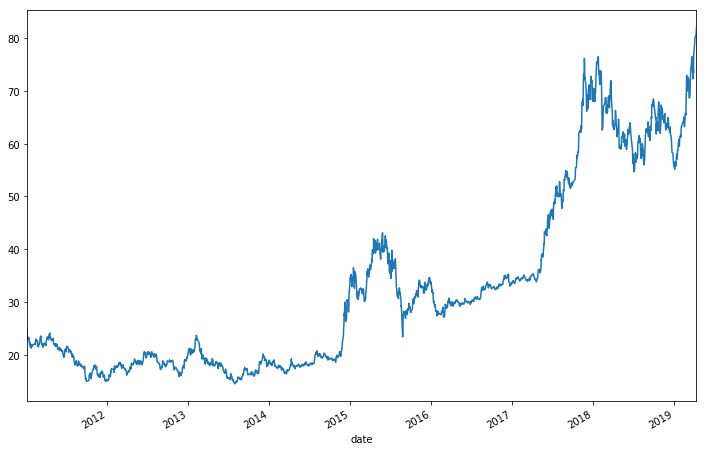
pingan['close'].plot(figsize=(12,8))
<matplotlib.axes._subplots.AxesSubplot at 0x2360fa68e10>
g_yue = pingan['close'].resample('M').ohlc()
g_yue
| open | high | low | close | |
|---|---|---|---|---|
| date | ||||
| 2011-01-31 | 25.011 | 25.011 | 21.249 | 21.842 |
| 2011-02-28 | 21.952 | 22.980 | 21.477 | 21.868 |
| 2011-03-31 | 22.084 | 23.512 | 21.433 | 21.736 |
| 2011-04-30 | 22.514 | 24.123 | 22.514 | 22.954 |
| 2011-05-31 | 23.103 | 23.103 | 20.972 | 21.407 |
| 2011-06-30 | 21.310 | 21.310 | 19.495 | 21.213 |
| 2011-07-31 | 21.156 | 21.609 | 19.534 | 19.724 |
| 2011-08-31 | 19.906 | 19.906 | 17.867 | 18.053 |
| 2011-09-30 | 18.231 | 18.294 | 14.935 | 14.935 |
| 2011-10-31 | 15.082 | 17.226 | 15.082 | 17.208 |
| 2011-11-30 | 17.449 | 18.036 | 15.687 | 15.687 |
| 2011-12-31 | 16.541 | 16.901 | 14.935 | 15.322 |
| 2012-01-31 | 15.082 | 17.395 | 15.060 | 17.057 |
| 2012-02-29 | 16.643 | 18.556 | 16.643 | 18.160 |
| 2012-03-31 | 18.040 | 18.352 | 16.123 | 16.274 |
| 2012-04-30 | 16.799 | 18.405 | 16.750 | 18.111 |
| 2012-05-31 | 18.761 | 19.166 | 18.085 | 18.636 |
| 2012-06-30 | 18.761 | 20.518 | 18.094 | 20.349 |
| 2012-07-31 | 20.509 | 20.572 | 19.493 | 19.793 |
| 2012-08-31 | 20.227 | 20.227 | 17.193 | 17.381 |
| 2012-09-30 | 17.829 | 18.833 | 17.560 | 18.833 |
| 2012-10-31 | 18.613 | 19.018 | 17.091 | 17.423 |
| 2012-11-30 | 17.661 | 17.661 | 15.865 | 16.382 |
| 2012-12-31 | 16.449 | 20.338 | 16.449 | 20.338 |
| 2013-01-31 | 21.155 | 21.653 | 19.952 | 21.653 |
| 2013-02-28 | 22.799 | 23.701 | 20.194 | 21.137 |
| 2013-03-31 | 20.634 | 20.634 | 18.245 | 18.757 |
| 2013-04-30 | 18.407 | 19.265 | 17.877 | 17.877 |
| 2013-05-31 | 17.976 | 18.717 | 17.374 | 17.920 |
| 2013-06-30 | 17.929 | 17.929 | 15.558 | 15.726 |
| ... | ... | ... | ... | ... |
| 2016-11-30 | 33.393 | 35.031 | 32.964 | 34.602 |
| 2016-12-31 | 34.688 | 35.269 | 33.012 | 33.745 |
| 2017-01-31 | 33.983 | 34.774 | 33.536 | 34.774 |
| 2017-02-28 | 33.926 | 35.069 | 33.926 | 34.507 |
| 2017-03-31 | 34.440 | 35.250 | 33.907 | 35.250 |
| 2017-04-30 | 35.336 | 36.155 | 33.821 | 36.155 |
| 2017-05-31 | 36.107 | 43.327 | 35.488 | 42.927 |
| 2017-06-30 | 43.784 | 47.584 | 42.546 | 47.251 |
| 2017-07-31 | 46.613 | 52.003 | 45.641 | 50.087 |
| 2017-08-31 | 52.812 | 54.940 | 47.738 | 53.948 |
| 2017-09-30 | 54.083 | 54.685 | 51.567 | 52.616 |
| 2017-10-31 | 53.199 | 62.525 | 53.199 | 62.525 |
| 2017-11-30 | 62.292 | 76.203 | 62.185 | 67.926 |
| 2017-12-31 | 66.158 | 72.774 | 66.158 | 67.985 |
| 2018-01-31 | 70.520 | 76.514 | 68.014 | 72.939 |
| 2018-02-28 | 73.328 | 73.843 | 62.593 | 65.828 |
| 2018-03-31 | 66.965 | 71.977 | 63.448 | 63.448 |
| 2018-04-30 | 62.816 | 66.304 | 59.154 | 59.154 |
| 2018-05-31 | 59.591 | 62.272 | 58.921 | 60.358 |
| 2018-06-30 | 59.882 | 63.990 | 56.267 | 58.000 |
| 2018-07-31 | 54.673 | 61.545 | 54.673 | 60.990 |
| 2018-08-31 | 59.109 | 62.842 | 56.020 | 62.357 |
| 2018-09-30 | 62.109 | 68.500 | 60.600 | 68.500 |
| 2018-10-31 | 64.780 | 67.930 | 61.850 | 63.630 |
| 2018-11-30 | 64.300 | 67.350 | 62.640 | 63.490 |
| 2018-12-31 | 64.990 | 64.990 | 56.100 | 56.100 |
| 2019-01-31 | 55.180 | 62.980 | 55.180 | 62.980 |
| 2019-02-28 | 63.210 | 73.000 | 63.210 | 70.010 |
| 2019-03-31 | 72.390 | 77.100 | 68.700 | 77.100 |
| 2019-04-30 | 78.600 | 82.030 | 78.600 | 82.030 |
100 rows × 4 columns
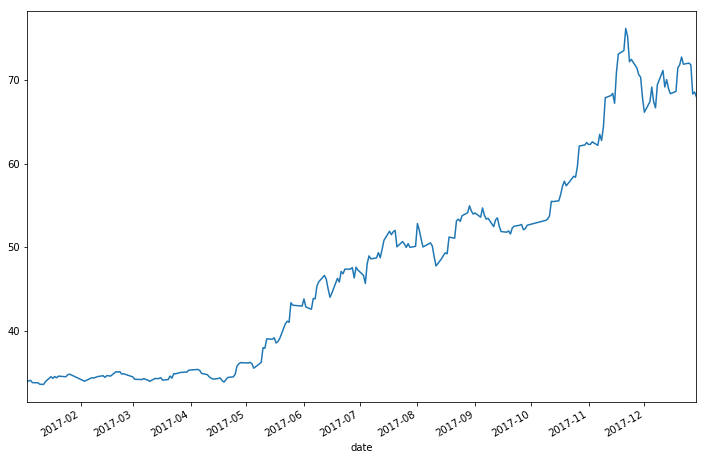
pingan['close'].loc['2017'].plot(figsize=(12,8))
<matplotlib.axes._subplots.AxesSubplot at 0x23612ba5e10>
shouyi = (pingan['close'][-1] - pingan['close'][0])/pingan['close'][0]
shouyi
2.2797569069609374
y_num = pingan.index[-1].year - pingan.index[0].year
y_num
8
shouyi**(1/y_num)
1.1085009445718548
pingan['close'].to_period('A')
date
2011    25.011
2011    24.110
2011    23.112
2011    23.297
2011    22.866
2011    22.905
2011    23.288
2011    23.283
2011    22.844
2011    21.908
2011    21.974
2011    22.273
2011    21.438
2011    21.714
2011    21.249
2011    21.315
2011    21.504
2011    21.943
2011    21.710
2011    21.842
2011    21.952
2011    21.930
2011    22.224
2011    21.961
2011    22.980
2011    22.695
2011    22.629
2011    22.528
2011    22.492
2011    22.659
         ...
2019    69.980
2019    70.010
2019    72.390
2019    72.580
2019    72.070
2019    72.160
2019    70.290
2019    68.700
2019    68.790
2019    69.250
2019    71.540
2019    72.800
2019    73.850
2019    75.000
2019    75.350
2019    76.550
2019    75.800
2019    74.720
2019    72.290
2019    72.690
2019    74.220
2019    73.400
2019    77.100
2019    78.600
2019    78.960
2019    79.860
2019    80.200
2019    80.590
2019    81.100
2019    82.030
Freq: A-DEC, Name: close, Length: 2004, dtype: float64
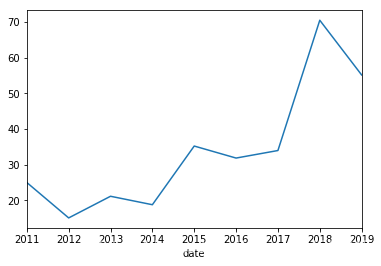
pingan['close'].to_period('A').groupby(level = 0).first().plot()
<matplotlib.axes._subplots.AxesSubplot at 0x23612bdc748>
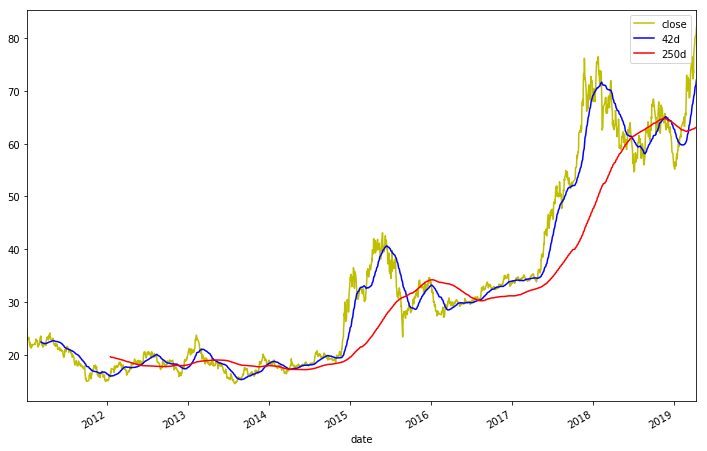
pingan['42d'] = pingan['close'].rolling(window=42).mean()
pingan['250d'] = pingan['close'].rolling(window=250).mean()
pingan[['close','42d','250d']].plot(figsize=(12,8),color = ['y','b','r'])
<matplotlib.axes._subplots.AxesSubplot at 0x2360fa38550>
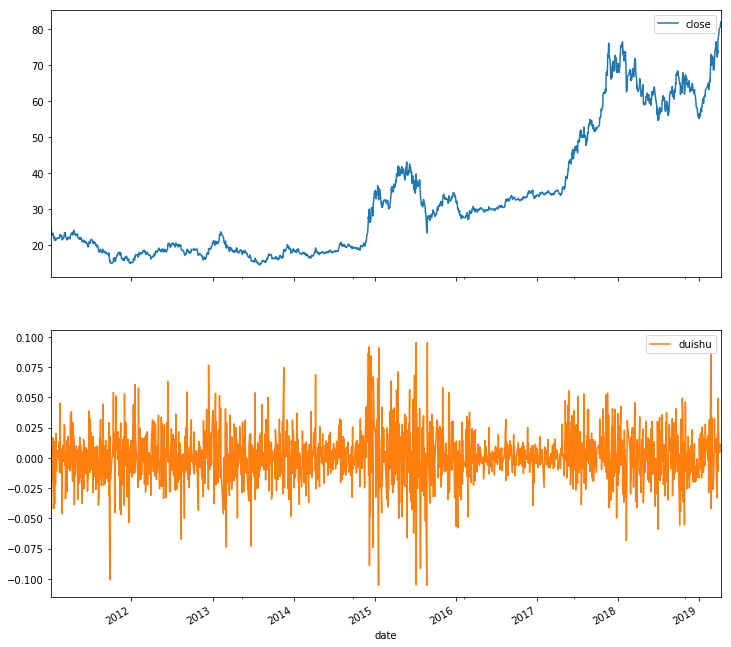
pingan['duishu'] = np.log(pingan['close']/pingan['close'].shift(1)) #shifting 指的是沿着时间轴将数据前移或后移。
pingan[['close','duishu']].plot(subplots = True,figsize=(12,12))
array([<matplotlib.axes._subplots.AxesSubplot object at 0x0000023612FB0CF8>,
       <matplotlib.axes._subplots.AxesSubplot object at 0x000002361301E978>],
      dtype=object)

DAMO开发者矩阵,由阿里巴巴达摩院和中国互联网协会联合发起,致力于探讨最前沿的技术趋势与应用成果,搭建高质量的交流与分享平台,推动技术创新与产业应用链接,围绕“人工智能与新型计算”构建开放共享的开发者生态。
更多推荐

 4
4 0
0- 0


 已为社区贡献18条内容

所有评论(0)