【Python机器学习系列】开发Streamlit应用程序并部署机器学习模型(案例+源码)
这是我的第357篇原创文章。
一、引言
近年来,随着机器学习和人工智能技术的迅猛发展,越来越多的研究者选择将他们的模型以应用程序(App)的形式进行部署,从而使审稿人和其他研究者可以通过简单的界面,输入相关数据来验证模型的性能和应用价值。
Streamlit 是一个用于机器学习、数据可视化的 Python 框架,它能几行代码就构建出一个精美的在线 app 应用。
Sreamlit Cloud 提供了一个简单的界面来托管 Streamlit 应用程序。本节旨在探讨如何基于机器学习的诊断模型,使用 Streamlit 构建心脏病风险预测应用程序,加载前文代码训练最好的XGBoost 模型,接受用户输入的多种健康指标,通过模型预测用户是否存在患心脏病的风险,并给出相应的建议,此外,还使用 SHAP力图可视化来解释模型的预测结果。
以下是使用Streamlit创建一个简单应用的步骤:
-
安装Streamlit:可以使用pip命令来安装Streamlit库。
-
创建一个Python脚本:在Python脚本中导入Streamlit库,并使用Streamlit提供的API来编写应用程序逻辑。
-
运行应用程序:在终端或命令行中运行你的Python脚本,Streamlit会自动启动一个本地Web服务器,并展示你的应用。
-
进行交互与可视化:通过Web浏览器打开展示的URL,与你的应用进行交互,并查看数据可视化和交互组件的效果。
-
部署应用程序:使用Streamlit的部署工具,将你的应用程序快速部署到云端,让其他人能够方便地访问和使用。
二、实现过程
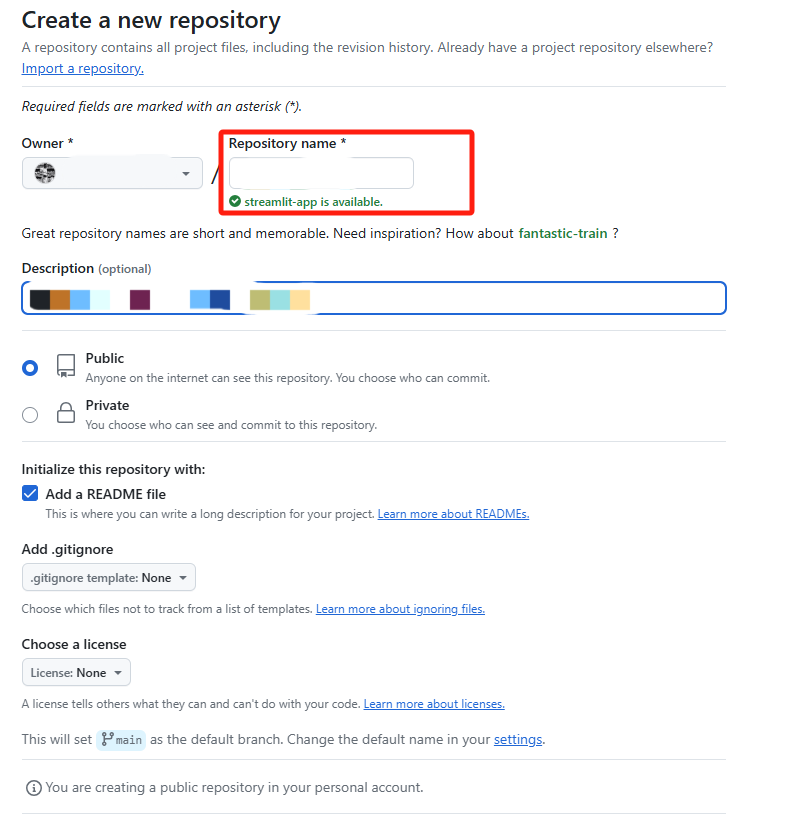
1、 创建Github仓库
登录到 GitHub,点击右上角的“New”按钮创建一个新仓库,选择仓库的名字并初始化 README 文件:
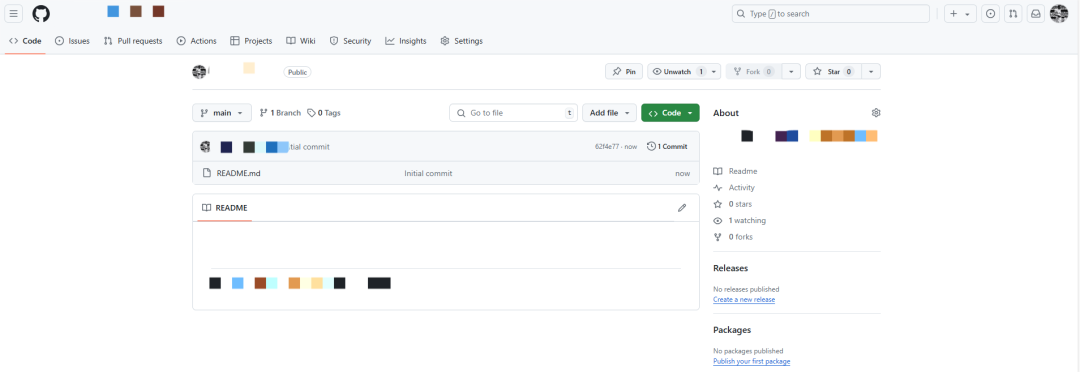
创建完成之后,我的GitHub下面就多了一个名为streamlit-app的仓库,其中有一个初始化的README.md文件:
2、本地项目推送到远程git仓库
本地建立一个同名的项目文件夹,进入该文件夹,鼠标右键打开Git Bash Here命令框。
第一步:
初始化一个 git 本地仓库,会在本地创建一个 .git 的文件夹:
git init第二步:
与远程仓库关联:
git remote add origin <远程仓库地址>第三步:
将github上的仓库的main分支pull到本地仓库的master分支(由于你新创建的那个远程仓库里面的README文件不在本地仓库目录中,需要通过pull命令先将内容合并一下)
git pull origin main:master第四步:
进入文件夹进行开发,自己编写的代码文件或文档:
app.py:
import streamlit as st
import joblib
import numpy as np
import pandas as pd
import shap
import matplotlib.pyplot as plt
# Load the model
model = joblib.load('XGBoost.pkl')
# Define feature options
cp_options = {
1: 'Typical angina (1)',
2: 'Atypical angina (2)',
3: 'Non-anginal pain (3)',
4: 'Asymptomatic (4)'
}
restecg_options = {
0: 'Normal (0)',
1: 'ST-T wave abnormality (1)',
2: 'Left ventricular hypertrophy (2)'
}
slope_options = {
1: 'Upsloping (1)',
2: 'Flat (2)',
3: 'Downsloping (3)'
}
thal_options = {
1: 'Normal (1)',
2: 'Fixed defect (2)',
3: 'Reversible defect (3)'
}
# Define feature names
feature_names = [
"Age", "Sex", "Chest Pain Type", "Resting Blood Pressure", "Serum Cholesterol",
"Fasting Blood Sugar", "Resting ECG", "Max Heart Rate", "Exercise Induced Angina",
"ST Depression", "Slope", "Number of Vessels", "Thal"
]
# Streamlit user interface
st.title("Heart Disease Predictor")
# age: numerical input
age = st.number_input("Age:", min_value=1, max_value=120, value=50)
# sex: categorical selection
sex = st.selectbox("Sex (0=Female, 1=Male):", options=[0, 1], format_func=lambda x: 'Female (0)' if x == 0 else 'Male (1)')
# cp: categorical selection
cp = st.selectbox("Chest pain type:", options=list(cp_options.keys()), format_func=lambda x: cp_options[x])
# trestbps: numerical input
trestbps = st.number_input("Resting blood pressure (trestbps):", min_value=50, max_value=200, value=120)
# chol: numerical input
chol = st.number_input("Serum cholesterol in mg/dl (chol):", min_value=100, max_value=600, value=200)
# fbs: categorical selection
fbs = st.selectbox("Fasting blood sugar > 120 mg/dl (fbs):", options=[0, 1], format_func=lambda x: 'False (0)' if x == 0 else 'True (1)')
# restecg: categorical selection
restecg = st.selectbox("Resting electrocardiographic results:", options=list(restecg_options.keys()), format_func=lambda x: restecg_options[x])
# thalach: numerical input
thalach = st.number_input("Maximum heart rate achieved (thalach):", min_value=50, max_value=250, value=150)
# exang: categorical selection
exang = st.selectbox("Exercise induced angina (exang):", options=[0, 1], format_func=lambda x: 'No (0)' if x == 0 else 'Yes (1)')
# oldpeak: numerical input
oldpeak = st.number_input("ST depression induced by exercise relative to rest (oldpeak):", min_value=0.0, max_value=10.0, value=1.0)
# slope: categorical selection
slope = st.selectbox("Slope of the peak exercise ST segment (slope):", options=list(slope_options.keys()), format_func=lambda x: slope_options[x])
# ca: numerical input
ca = st.number_input("Number of major vessels colored by fluoroscopy (ca):", min_value=0, max_value=4, value=0)
# thal: categorical selection
thal = st.selectbox("Thal (thal):", options=list(thal_options.keys()), format_func=lambda x: thal_options[x])
# Process inputs and make predictions
feature_values = [age, sex, cp, trestbps, chol, fbs, restecg, thalach, exang, oldpeak, slope, ca, thal]
features = np.array([feature_values])
if st.button("Predict"):
# Predict class and probabilities
predicted_class = model.predict(features)[0]
predicted_proba = model.predict_proba(features)[0]
# Display prediction results
st.write(f"**Predicted Class:** {predicted_class}")
st.write(f"**Prediction Probabilities:** {predicted_proba}")
# Generate advice based on prediction results
probability = predicted_proba[predicted_class] * 100
if predicted_class == 1:
advice = (
f"According to our model, you have a high risk of heart disease. "
f"The model predicts that your probability of having heart disease is {probability:.1f}%. "
"While this is just an estimate, it suggests that you may be at significant risk. "
"I recommend that you consult a cardiologist as soon as possible for further evaluation and "
"to ensure you receive an accurate diagnosis and necessary treatment."
)
else:
advice = (
f"According to our model, you have a low risk of heart disease. "
f"The model predicts that your probability of not having heart disease is {probability:.1f}%. "
"However, maintaining a healthy lifestyle is still very important. "
"I recommend regular check-ups to monitor your heart health, "
"and to seek medical advice promptly if you experience any symptoms."
)
st.write(advice)
# Calculate SHAP values and display force plot
explainer = shap.TreeExplainer(model)
shap_values = explainer.shap_values(pd.DataFrame([feature_values], columns=feature_names))
shap.force_plot(explainer.expected_value, shap_values[0], pd.DataFrame([feature_values], columns=feature_names), matplotlib=True)
plt.savefig("shap_force_plot.png", bbox_inches='tight', dpi=1200)
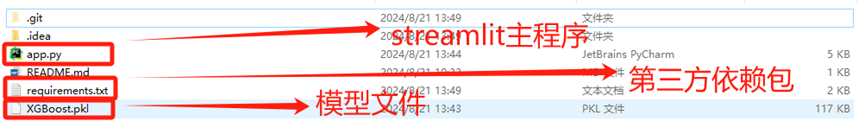
st.image("shap_force_plot.png")确保有以下这三个文件:
第五步:
将当前目录下的文件添加到仓库(缓冲区):
git add .第六步:
提交到本地仓库:
git commit -m "feat(): update code"第七步:
推送到远程仓库:
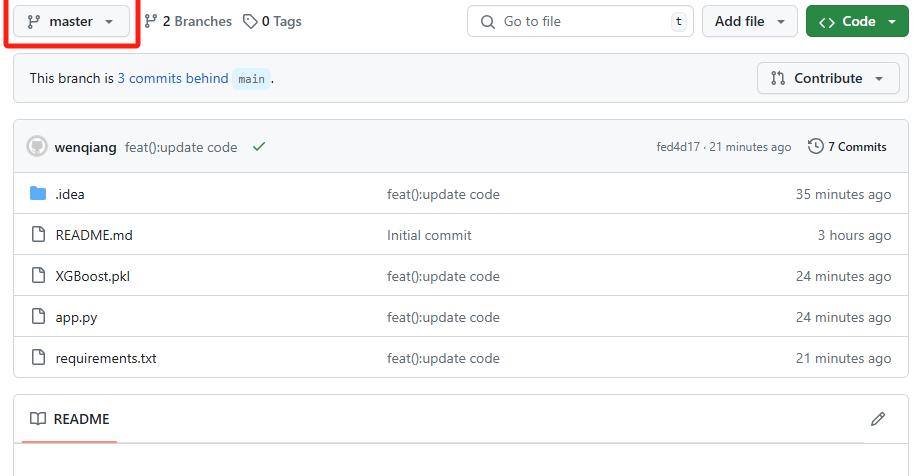
git push origin master完成之后,就将本地的master分支push到远程仓库的master分支:
3、 部署到Streamlit Cloud
登录streamlit cloud
登录 Streamlit Cloud(https://share.streamlit.io/),使用 GitHub 账户登录(因为你需要访问 GitHub 仓库)。
创建app并部署
登录后,点击页面右上角的 "Create app" 按钮;在弹出的对话框中,选择你刚刚上传到 GitHub 的项目仓库;选择分支(master)和要运行的 Python 脚本文件(如app.py);点击 "Deploy" 按钮。
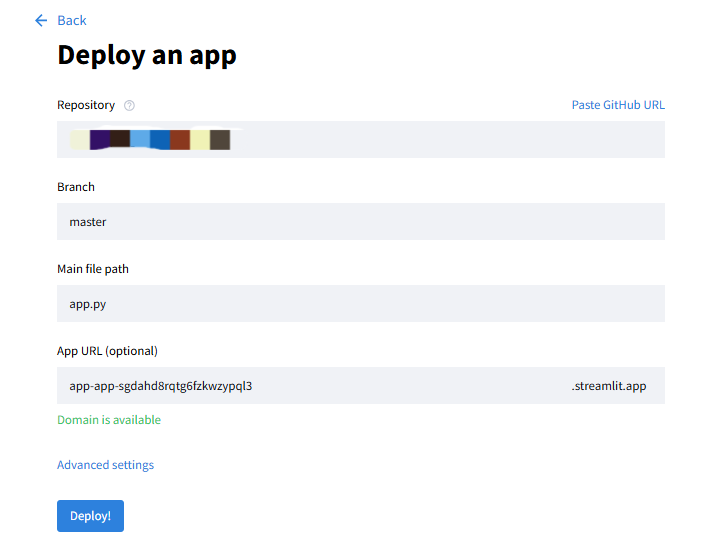
之后Streamlit Cloud 会开始构建和部署你的应用,这个过程可能需要几分钟;部署完成后就可以访问你的应用了,Streamlit 会生成一个唯一的 URL,通过这个 URL,你和其他用户可以访问你的应用:
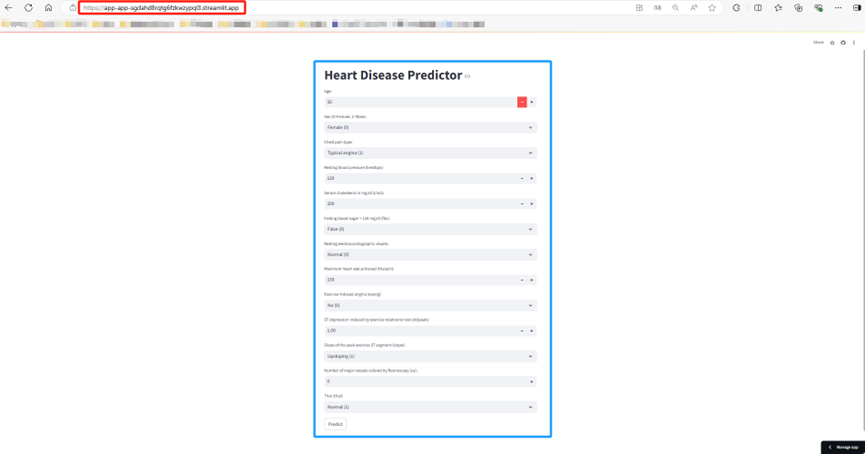
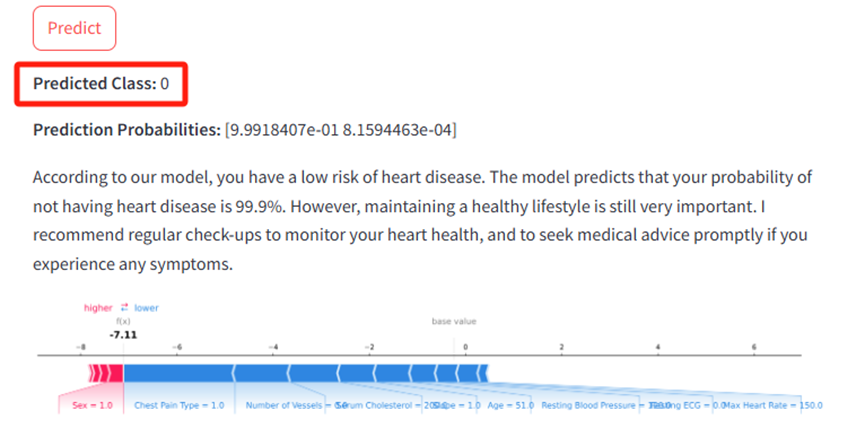
当你访问以上这个网址时会出现这个界面Heart Disease Predictor此时你只需要输入每个特征相关的值即可,然后点击Predict按钮,APP就会自动给出模型预测结果为那个类比,每个类别的概率,相关建议以及力图,具体输出如下:
作者简介:
读研期间发表6篇SCI数据挖掘相关论文,现在某研究院从事数据算法相关科研工作,结合自身科研实践经历不定期分享关于Python、机器学习、深度学习、人工智能系列基础知识与应用案例。致力于只做原创,以最简单的方式理解和学习,关注我一起交流成长。需要数据集和源码的小伙伴可以关注底部公众号添加作者微信。

DAMO开发者矩阵,由阿里巴巴达摩院和中国互联网协会联合发起,致力于探讨最前沿的技术趋势与应用成果,搭建高质量的交流与分享平台,推动技术创新与产业应用链接,围绕“人工智能与新型计算”构建开放共享的开发者生态。
更多推荐
 26
26 0
0- 0


 已为社区贡献131条内容

所有评论(0)