【python数据分析】:数据预处理之缺失值填充实例
·
数据缺失主要包括记录缺失和字段信息缺失等情况,其对数据分析会有较大影响,导致结果不确定性更加显著。
缺失值填充2种思路:
均值/中位数/众数填充、临近值填充

均值/中位数/众数填充
s = pd.Series([1,np.nan,np.nan,2,3,np.nan,4])#print(s)print('------')# 分别求出均值/中位数/众数u = s.mean() # 均值me = s.median() # 中位数mod = s.mode() # 众数print('均值为:%.2f, 中位数为:%.2f' % (u,me))print('众数为:', mod.tolist())print('------')# 用均值填补s.fillna(u,inplace = True)print(s)
------
均值为:2.50, 中位数为:2.50
众数为:[1.0, 2.0, 3.0, 4.0]
------
0    1.0
1    2.5
2    2.5
3    2.0
4    3.0
5    2.5
6    4.0
dtype: float64

临近值填充:向下填充/向上填充
s = pd.Series([1,np.nan,np.nan,2,3,np.nan,4])#print(s)print('------')# 用前值插补/向下填充s.fillna(method = 'ffill',inplace = True)print(s)s = pd.Series([1,np.nan,np.nan,2,3,np.nan,4])#print(s)print('------')# 用后值插补/向上填充s.fillna(method = 'bfill',inplace = True)print(s)
------
0    1.0
1    1.0
2    1.0
3    2.0
4    3.0
5    3.0
6    4.0
dtype: float64
------
0    1.0
1    2.0
2    2.0
3    2.0
4    3.0
5    4.0
6    4.0
dtype: float64

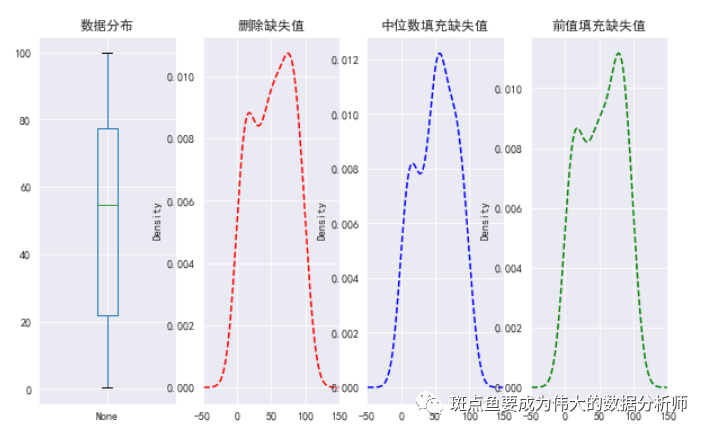
缺失值填充实例:密度图
data = pd.Series(np.random.rand(100)*100)data[3,6,33,45,56,66,67,80,90] = np.nanprint(data.head())print('总数据量:%i' % len(data))print('------')data_na = data[data.isnull()]print('缺失值数据量:%i' % len(data_na))print('缺失数据占比:%.2f%%' % (len(data_na) / len(data) * 100))# 密度图查看缺失值情况data_c = data.fillna(data.median()) # 中位数填充缺失值data_f = data.fillna(method = 'ffill') # 前值填充缺失值fig,axes = plt.subplots(1,4,figsize = (10,6))data.plot.box(ax = axes[0],grid = True,title = '数据分布')data.plot(kind = 'kde',style = '--r',ax = axes[1],grid = True,title = '删除缺失值',xlim = [-50,150])data_c.plot(kind = 'kde',style = '--b',ax = axes[2],grid = True,title = '中位数填充缺失值',xlim = [-50,150])data_f.plot(kind = 'kde',style = '--g',ax = axes[3],grid = True,title = '前值填充缺失值',xlim = [-50,150])
0    39.117918
1     1.340284
2    95.345331
3          NaN
4    13.084512
dtype: float64
总数据量:100
------
缺失值数据量:9
缺失数据占比:9.00%

DAMO开发者矩阵,由阿里巴巴达摩院和中国互联网协会联合发起,致力于探讨最前沿的技术趋势与应用成果,搭建高质量的交流与分享平台,推动技术创新与产业应用链接,围绕“人工智能与新型计算”构建开放共享的开发者生态。
更多推荐


 9
9 0
0- 0


 已为社区贡献3条内容

所有评论(0)