统计学习导论_统计学习导论|读书笔记04|返璞归真,不忘初心
统计学习导论(3.1)-简单线性回归
❝ Linear Regression serves as a good jumping-off point for many fancy statistical learning approaches that can be seen as 「generalizations or extensions」 of linear regression
❞
假设笔记(2.1)中的TV广告(
通过估计两个未知系数就可以根据已知的TV广告费预测未来的销量
1. 估计系数
残差平方和(Residual Sum of Squares)
「最小二乘估计」通过计算选择
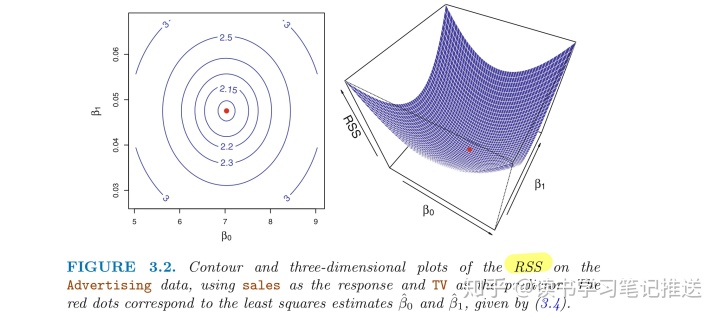
2. 评估系数估计值的准确性
真实的关系可能不是线性的,可能是其他变量导致了Y的变化,也可能存在测量误差。
- 通常假设误差项独立于X
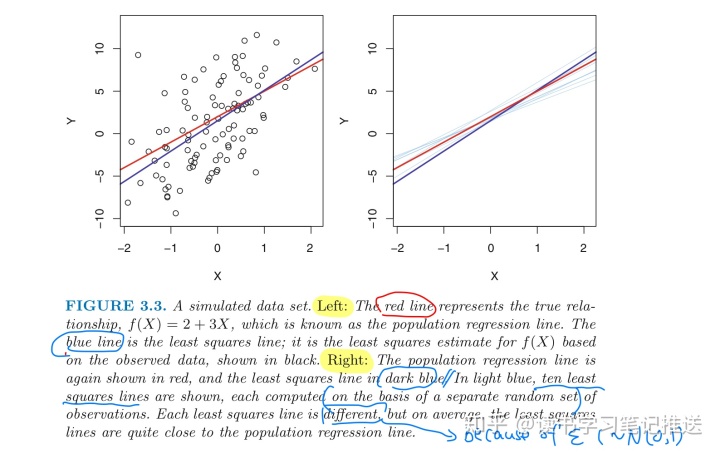
真实的「population regression line」和「least squares line」的差别原因:
- The concept of these two lines is a natural extension of the standard statistical approach of using information from a 「sample」 to estimate characteristics of a 「large population」
- e.g. The sample mean
good estimate of the population mean
will provide a
of variable Y
❝ The analogy between linear regression and estimation of the mean of a random variable is an apt one based on the concept of 「bias」
❞
「Unbiased Estimate」
Use the sample mean
- in the sense that on average, we expect
to equal
- if we average a huge number of estimates of
「exactly equal
obtained from a huge number of sets of observations, then this average would
」
- Hence, an unbiased estimator does not systematically 「over- or under-estimate」 the true parameter
The property of unbiasedness holds for the least squares coefficient estimates as well:
- average the estimates obtained over a huge number of data sets, then the average of these estimates would equal to
and
「Question」: how accurate is the sample mean
- the average of
's over MANY data sets will be very close to
- but a single estimate
substantial under- or over-estimate
may be
「Standard Error」
-
is the standard deviation of each of the realizations of
of
- the more observations
we have, the smaller the standard error of
Use standard errors to measure how close
-
is smaller when the
are more spread out:
- more 「leverage」 to estimate a slope when this is the case
-
is the same as
if
- in which case
- in which case
In general,
- the estimate of
「known」 as the 「residual standard error」:
is
Standard Errors can be used to compute 「confidence intervals」:
- a 95% CI is defined as a range of values s.t. with 95% probability, the range will contain the 「true」 unknown value of the parameter.
- CI for
「hypothesis test」
Null Hypothesis: No relationship between X and Y
Alternative hypothesis: there is some relationship between X and Y
Goal:
- how far? depends on
- if
is small, then even relatively small values of
may provide strong evidence that
- if
is large, then
「reject the null hypothesis」must be large in absolute value for us to
Test: t-statistic mesures the number of standard deviations that
- assume no relationship between X and Y, then t-statistic will have a t-distribution
- assume
「p-value」: the probability of observing any number equal to
, need to compute
or larger in absolute value.
- a small p-value indicates that it is 「unlikely」to observe such a substantial association between X and Y「due to chance(偶然)」
- infer that there is an association between the predictor and the response.
- reject the null hypothesis in favor of the alternative hypothesis ···
3. 评价模型的准确性
To quantify the extent to which the model fits the data
- The quality of a linear regression fit is assessed using two related quantities: 「
and
」
- Table below displays three quantities for the linear regression of number of units sold on TV advertising budget
| Quantity | Value |
|---|
| Quantity | Value |
|---|
| Quantity | Value |
|---|
「Residual Standard Error - RSE」
The RSE is an estimate of the standard deviation of
- due to error terms, even if the true regression line (
) is known, still cannot perfectly predict
from
- RSE is the 「average amount」 that the response will 「deviate」 from the true regression line
The RSE provides an absolute「measure of the lack of fit」of the model to the data
- if RSE is small, then the model fits the data very well
- RSE = 3.26 means actual 「sales」 in each market 「deviate from」 the true regression line by approximately 3260 units on average on the basis of 「TV advertising」
- In the advertising data set, the mean value of 「sales」 over all markets is about 14000 units, so the prediction error is 3260/14000 = 23%
「
Since the RSE is measured in the units of
-
「porpotion」
takes the form of a
- the proportion of variance explained between 0 and 1
TSS(Total Sum of Squares) measures
- the「total variance in the response Y」 before the regression is applied
RSS measures
- the「amount of variability」 that is left 「unexplained」 after applying the regression
TSS-RSS measures
- the「amount of variability」 in the response that is 「explained」 (or removed) by performing the regression
❝measures the proportion of variability in Y that can be explained using X
❞
- since unlike the RSE, it always lies between 0 and 1
NO GOOD
- an
value well below 0.1 might be more realistic!
correlation
In simple linear regression setting, we can use
- However, correlation quantifies the association between only a 「single pair」 of variables rather than between a larger number of variables
- Just
applies to the multiple linear regression
4. The BOOK I READ:
Introduction to Statistical Learning (ISL)
TOGO: 3.2. 多元线性回归

DAMO开发者矩阵,由阿里巴巴达摩院和中国互联网协会联合发起,致力于探讨最前沿的技术趋势与应用成果,搭建高质量的交流与分享平台,推动技术创新与产业应用链接,围绕“人工智能与新型计算”构建开放共享的开发者生态。
更多推荐


 0
0 0
0- 0


 已为社区贡献4条内容

所有评论(0)