数学建模(5)-Matlab绘制多个独立图
·
如题,引用subplot函数
说明:subplot(m,n,p)
式中:m,n是指将figure分成m行n列,p为 从左到右从上到下依次编号。
axis([xlb xub ylb yub])
title('xxxxx')
clc
clear
x1 = 1:10;
y1 = x1*5;
%Figure 1
subplot(3,1,1)
plot(x1,y1)
axis([1 20 0 100])
title('Figure(1)')

%Figure 2
subplot(3,1,2)
plot(x1,y1)
axis([1 20 0 100])
title('Figure(2)')

%Figure 3
subplot(3,1,3)
plot(x1,y1)
axis([1 20 0 100])
title('Figure(3)')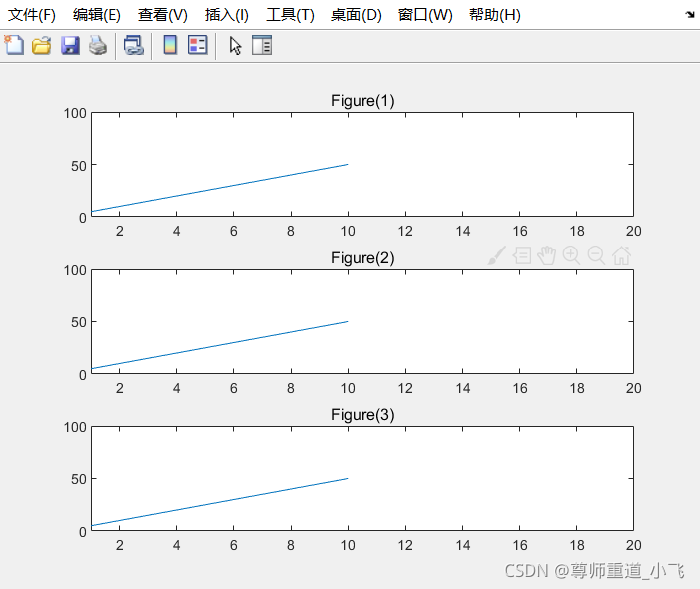

DAMO开发者矩阵,由阿里巴巴达摩院和中国互联网协会联合发起,致力于探讨最前沿的技术趋势与应用成果,搭建高质量的交流与分享平台,推动技术创新与产业应用链接,围绕“人工智能与新型计算”构建开放共享的开发者生态。
更多推荐


 0
0 0
0- 0


 已为社区贡献3条内容

所有评论(0)