(一)Prometheus+node_exporter+Grafana+altermanage+prometheus-webhook-dingtalk监控运维钉钉告警实战记录
Prometheus+node_exporter+Grafana+altermanage+prometheus-webhook-dingtalk监控运维钉钉告警实战记录
前言
本文详细记录各个操作步骤,每一步均验证成功,一次性搞定两大模块。使用Prometheus+node_exporter+Grafana+altermanage+prometheus-webhook-dingtalk,达到监控openEuler虚拟机各项指标,并能够发出告警,与钉钉hook机器人联动,发送钉钉消息。
第一部分 Prometheus+node_exporter+Grafana 监控数据展示
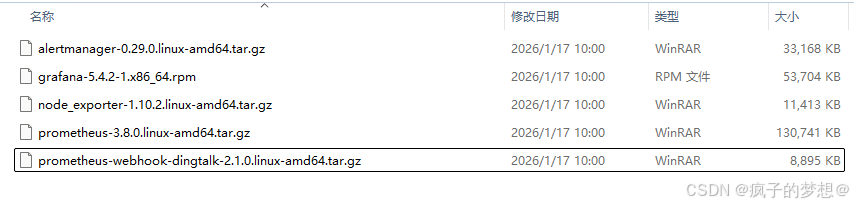
前置安装包下载:
已经作为资源绑定在该文章内最前边的大标题之下,可先下载。或直接在CSDN内搜索框搜索:搭建prometheus+grafana+alertmanager监控运维钉钉告警各组件安装包
各项前置操作
- 操作系统:
openEuler22.02LTS_SP4 - 操作系统配置:
cpu:4核,内存3G,存储200GB - 安装包组合:
alertmanager-0.29.0.linux-amd64.tar.gz
grafana-5.4.2-1.x86_64.rpm
node_exporter-1.10.2.linux-amd64.tar.gz
prometheus-3.8.0.linux-amd64.tar.gz
prometheus-webhook-dingtalk-2.1.0.linux-amd64.tar.gz
-
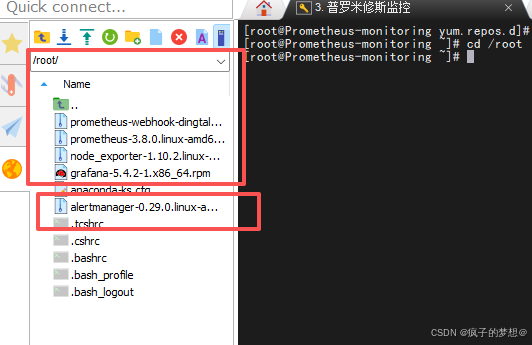
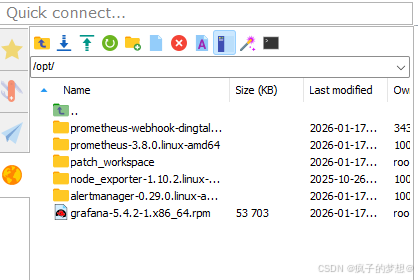
将各个安装包上传至虚拟机的根目录下。
-
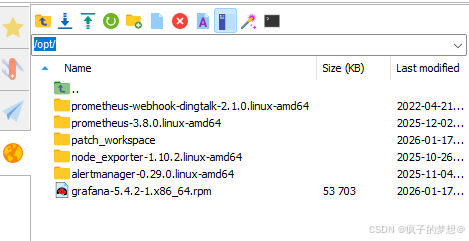
将tar.gz文件解压文件到opt目录下,将rpm文件移动到opt目录下。
tar -zxvf prometheus-3.8.0.linux-amd64.tar.gz -C /opt/
tar -zxvf prometheus-webhook-dingtalk-2.1.0.linux-amd64.tar.gz -C /opt/
tar -zxvf node_exporter-1.10.2.linux-amd64.tar.gz -C /opt/
tar -zxvf alertmanager-0.29.0.linux-amd64.tar.gz -C /opt/
mv grafana-5.4.2-1.x86_64.rpm /opt/
prometheus普罗米修斯设置后台进程启动
## cd到普罗米修斯的安装目录
cd /opt/prometheus-3.8.0.linux-amd64
## 查看文件夹内文件
ls -l
## prometheus.yml为配置文件
## 以默认设置后台进程启动普罗米修斯,不占用终端命令行界面,使用符号"&"
./prometheus --config.file=prometheus.yml &
## 在防火墙添加默认的监听9090端口
firewall-cmd --zone=public --add-port=9090/tcp --permanent
## 重载防火墙
firewall-cmd --reload
## 查看后台进程是否存在
sudo netstat -tulpn | grep 9090
ps aux | grep prometheus


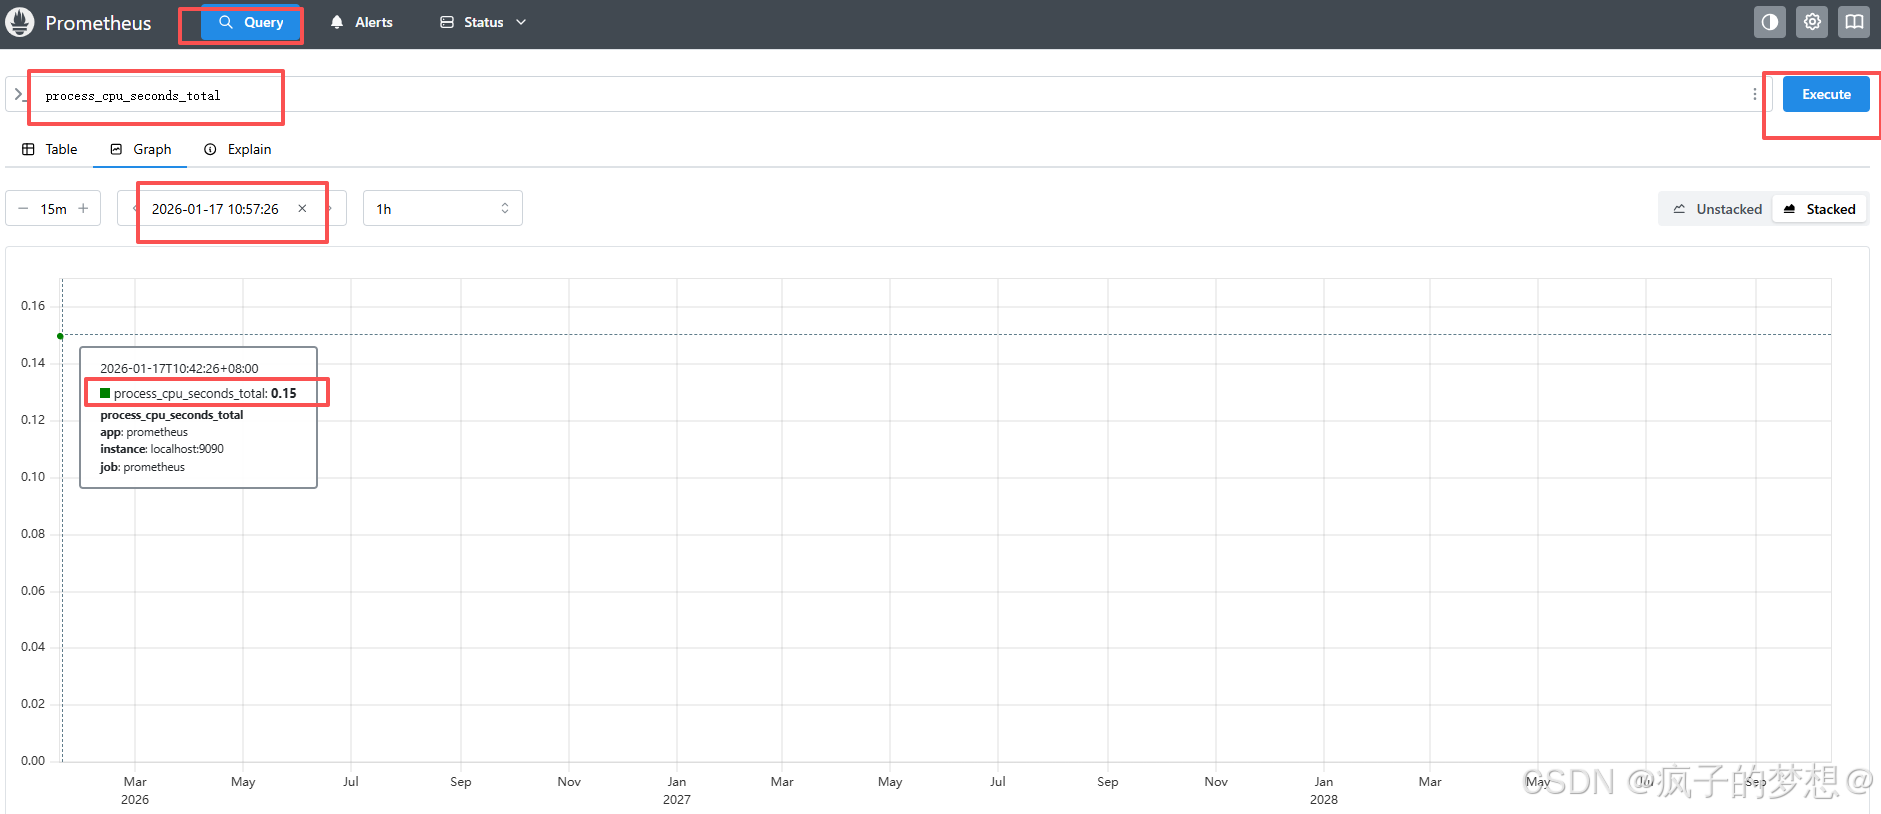
访问prometheus普罗米修斯web界面
因为9090的监听地址是:::*表示监听所有0.0.0.0地址,用自己电脑打开http://你的服务器ip地址:9090,显示界面如图,普罗米修斯默认监控自身所在的服务器。记得在web页面,设置时间使用本地时间。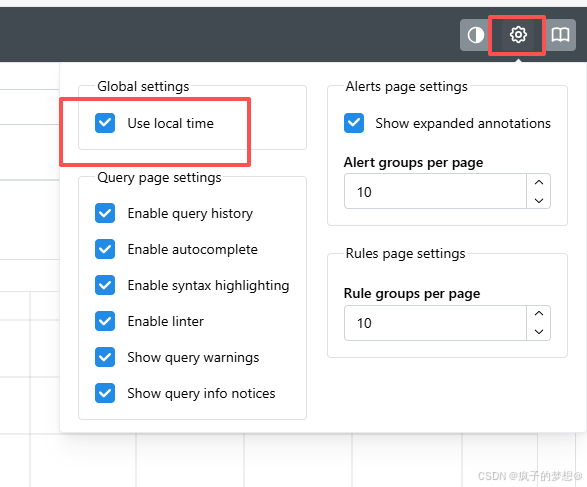
node_exporter设置启动
node_exporter可以采集服务器的各种资源使用情况,将这些信息提供给Prometheus服务器进行监控和分析。因此要在所有需要监控和分析的机器上安装node_exporter。此处以在本机同一台服务器上启动举例。
## 进入到node_exporter目录下
cd /opt/node_exporter-1.10.2.linux-amd64
ls -l
## 执行以后台进程的形式启动,使用&符号
./node_exporter &
## 添加防火墙端口,默认的9100
firewall-cmd --zone=public --add-port=9100/tcp --permanent
## 重载防火墙
firewall-cmd --reload
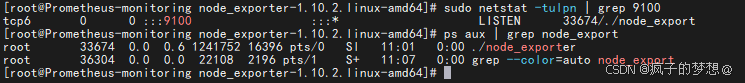
## 查看进程启动情况
ps aux | grep node_export
sudo netstat -tulpn | grep 9100
关掉之前开启的prometheus进程,重新修改prometheus.yml配置文件,将node_export配置进去。然后重启prometheus进程。
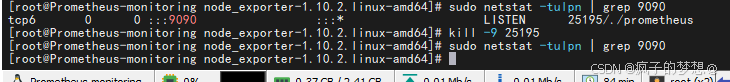
## 查看prometheus后台进程的pid号
sudo netstat -tulpn | grep 9090
## 杀死进程号为25195的进程
kill -9 25195
## 切换到prometheus目录,编辑prometheus.yml文件
cd /opt/prometheus-3.8.0.linux-amd64
vim prometheus.yml
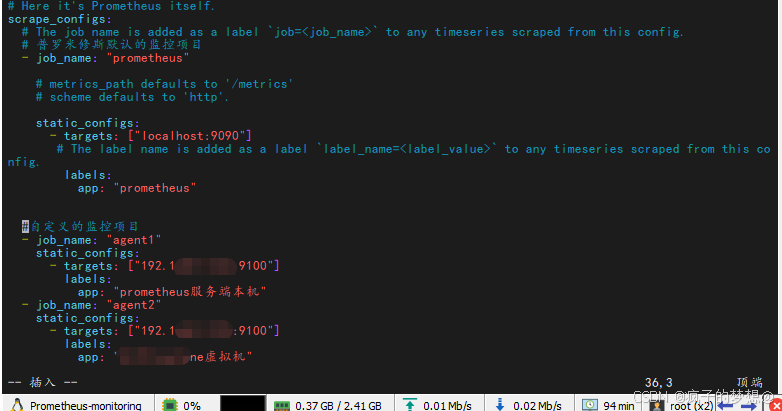
## 添加自定义的监控项目
#自定义的监控项目
- job_name: "agent1"
static_configs:
- targets: ["你的prometheus服务端本机:9100"]
labels:
app: "prometheus服务端本机"
# 自行在第二台机器安装node_export,并修改防火墙端口,启动服务,保证机器与机器之间网络通。
- job_name: "agent2"
static_configs:
- targets: ["你的第二台机器ip:9100"]
labels:
app: "你的第二台机器的自定义标签"
## 修改完.yml配置文件后,以后台进程形式启动prometheus
## cd到普罗米修斯的安装目录
cd /opt/prometheus-3.8.0.linux-amd64
## 查看文件夹内文件
ls -l
## prometheus.yml为配置文件
## 以默认设置后台进程启动普罗米修斯,不占用终端命令行界面,使用符号"&"
./prometheus --config.file=prometheus.yml &
重新访问http://你的服务器ip:9090web界面,查看是否有对应的端点显示情况。此处agent2报红,是因为网络还未通。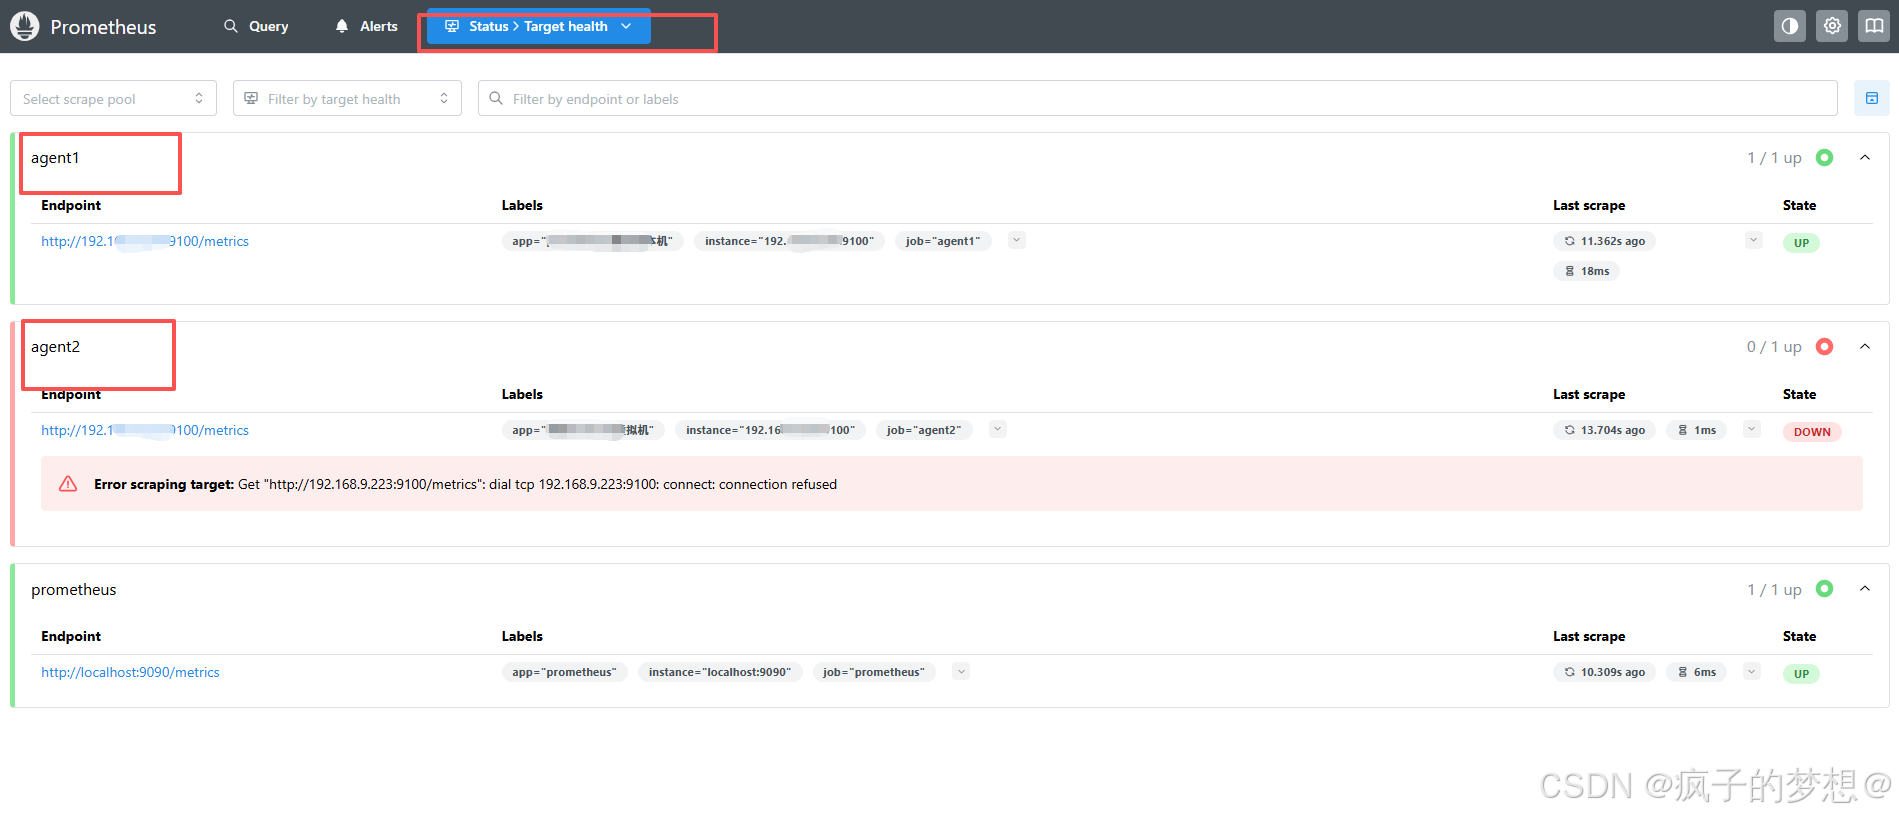
Grafana图形化工具安装配置
仅使用prometheus做监控,web界面不直观,多以日志的形式展示,难以阅读,使用Grafana图形化界面对数据进行整合。
## 切换到Grafana的安装目录
cd /opt/
ls =l
## 执行grafana安装程序,自动下载相关依赖。
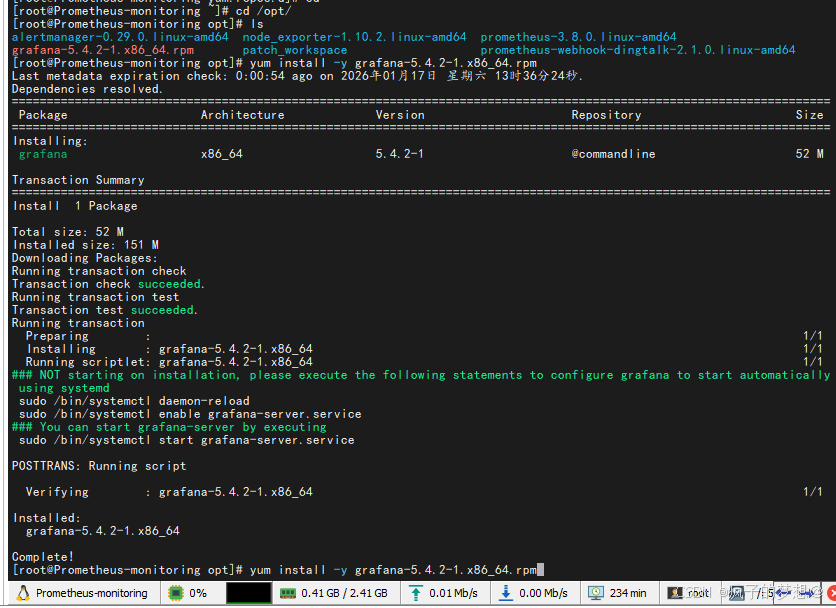
yum install -y grafana-5.4.2-1.x86_64.rpm
## 默认openEuler的yum源仓库不满足,需改仓库源,下述为直接安装时报错,更改镜像源的操作。
cd /etc/yum.repos.d/
## 将原有repo仓库备份
cp openEuler.repo openEuler.repo.back
## 删除openEuler.repo
rm -i openEuler.repo
## 新建华为云镜像源仓库
vim /etc/yum.repos.d/huawei-openeuler.repo
## 编辑文件内容为
[openEuler-everything]
name=openEuler-everything
baseurl=https://mirrors.huaweicloud.com/openeuler/openEuler-22.03-LTS-SP4/everything/x86_64/
enabled=1
gpgcheck=0
gpgkey=https://mirrors.huaweicloud.com/openeuler/openEuler-22.03-LTS-SP4/everything/x86_64/RPM-GPG-KEY-openEuler
[openEuler-EPOL]
name=openEuler-epol
baseurl=https://mirrors.huaweicloud.com/openeuler/openEuler-22.03-LTS-SP4/EPOL/main/x86_64/
enabled=1
gpgcheck=0
[openEuler-update]
name=openEuler-update
baseurl=https://mirrors.huaweicloud.com/openeuler/openEuler-22.03-LTS-SP4/update/x86_64/
enabled=1
gpgcheck=0
## 清理仓库缓存,并新建缓存
yum clean all
yum makecache
## 返回grafana的目录
cd /opt/
## 重新执行安装
yum install -y grafana-5.4.2-1.x86_64.rpm
点此进入华为云镜像仓库地址可获取镜像文件相关配置。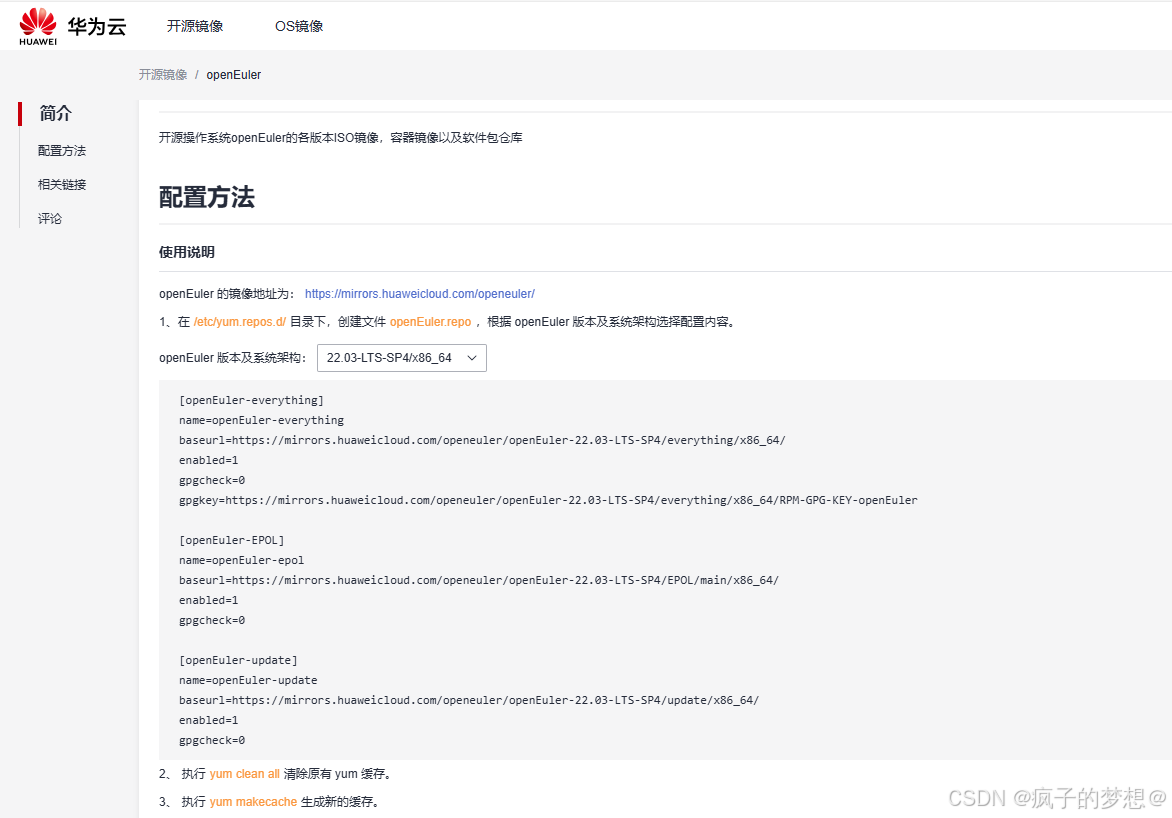
## 在防火墙添加默认的监听3000端口
firewall-cmd --zone=public --add-port=3000/tcp --permanent
## 重载防火墙
firewall-cmd --reload
然后启动garfana:systemctl start grafana-server ,systemctl enable grafana-server
浏览器访问http://你的服务器ip:3000,默认用户名和密码是admin/admin,若访问打不开网页,修改防火墙设置。
添加数据源普罗米修斯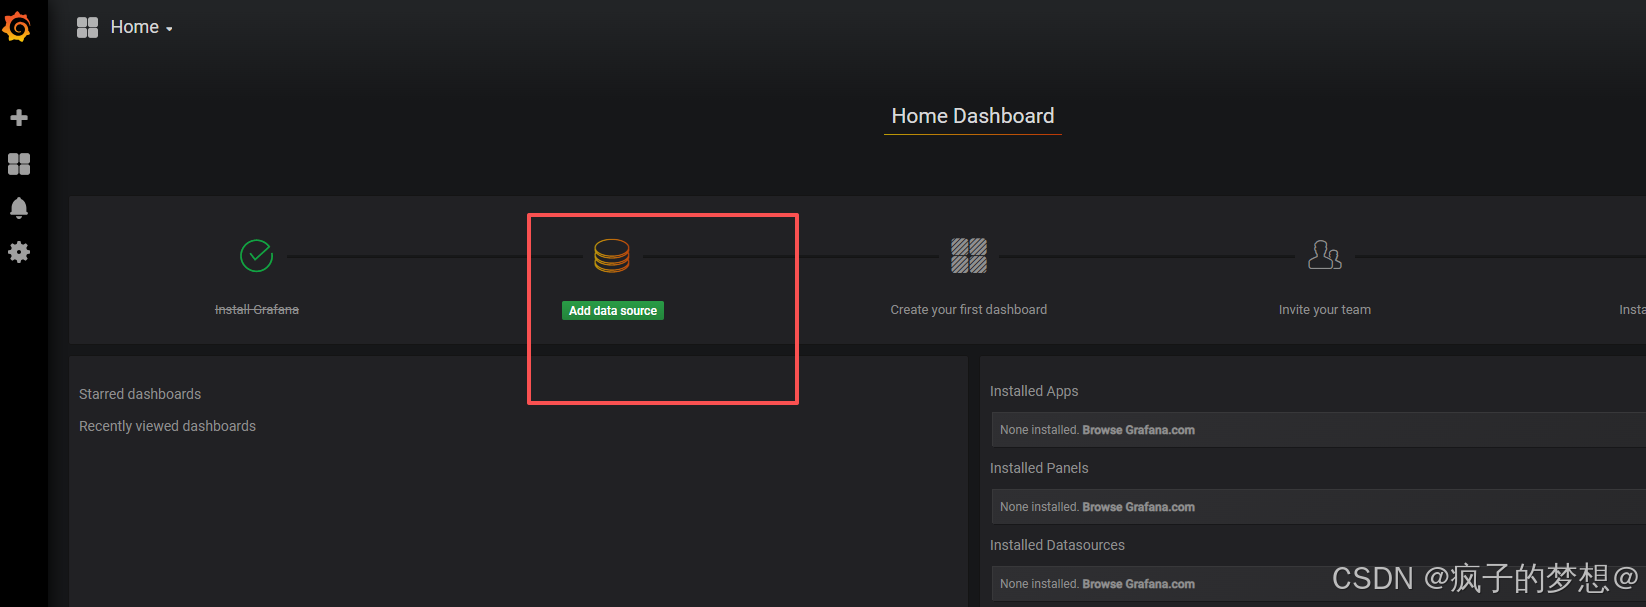
选择为普罗米修斯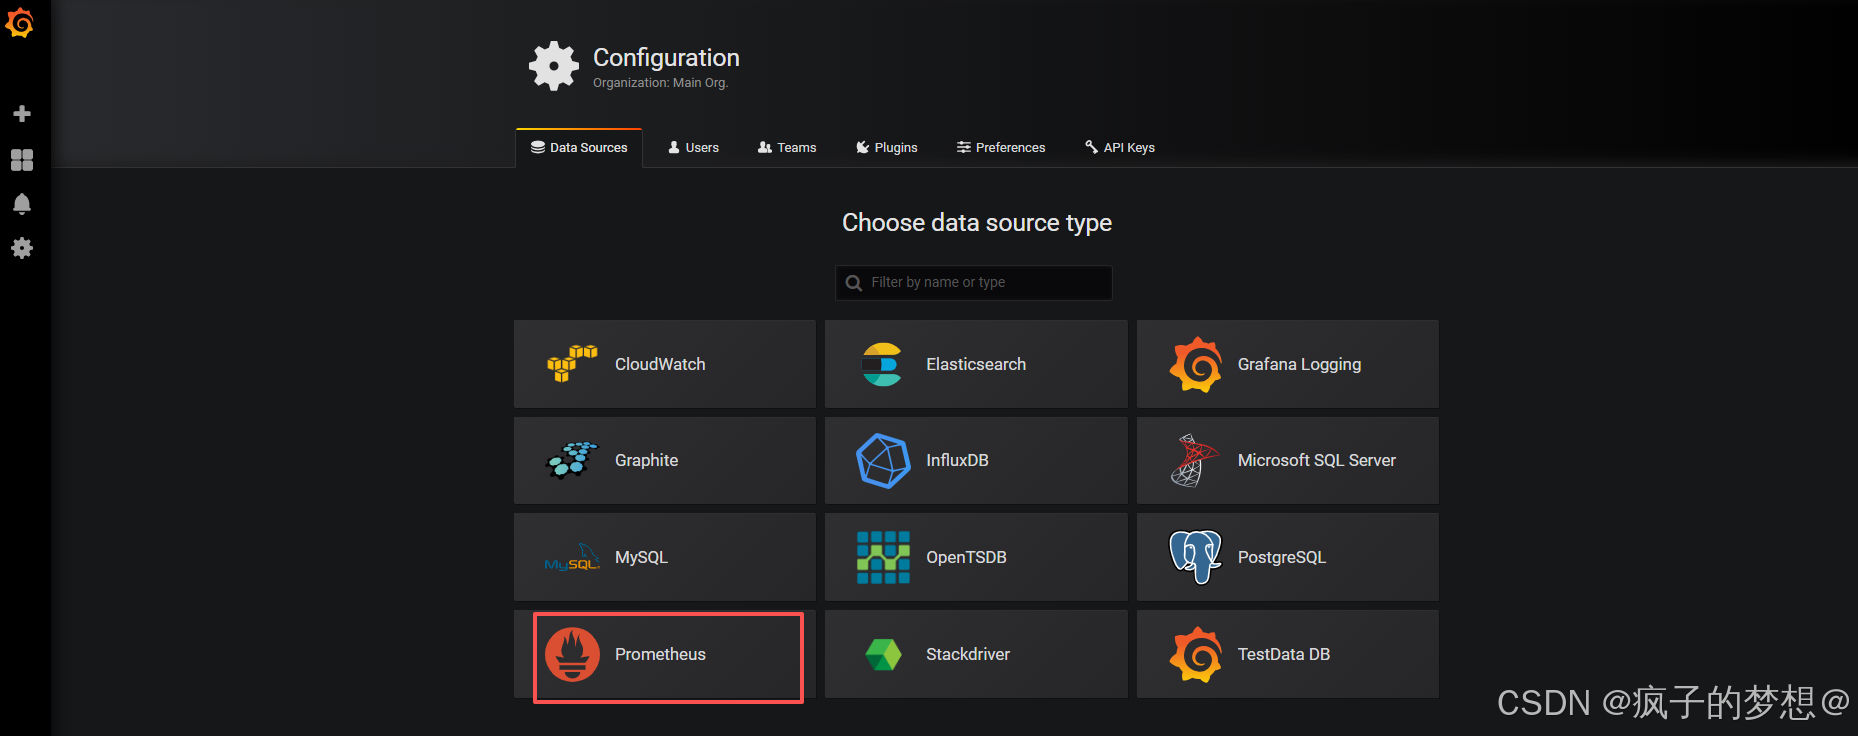
填写自定义名称,普罗米修斯的服务地址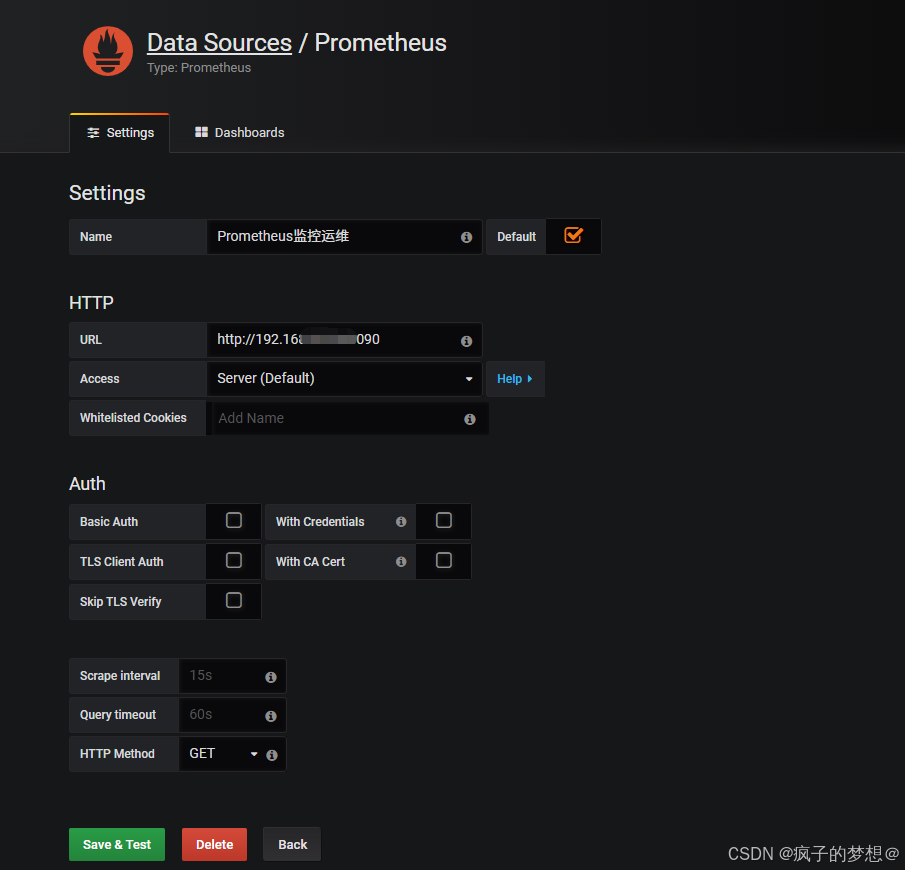
返回首页进入Dashboard自己创建监控图标,但是比较麻烦,不如直接import引入现有的监控大屏。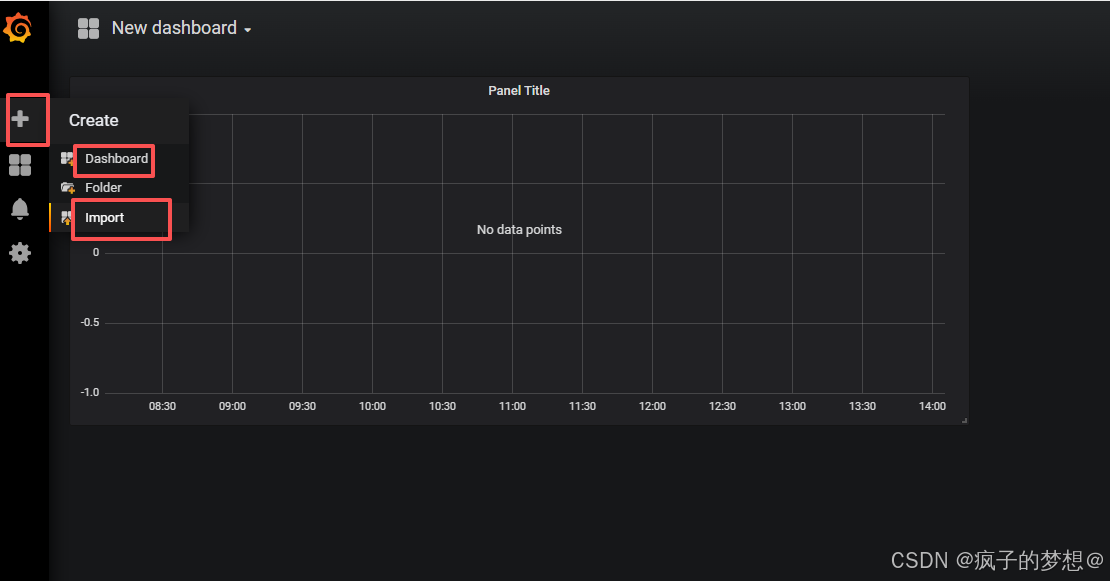
前往官网:https://grafana.com/,进入模板下载界面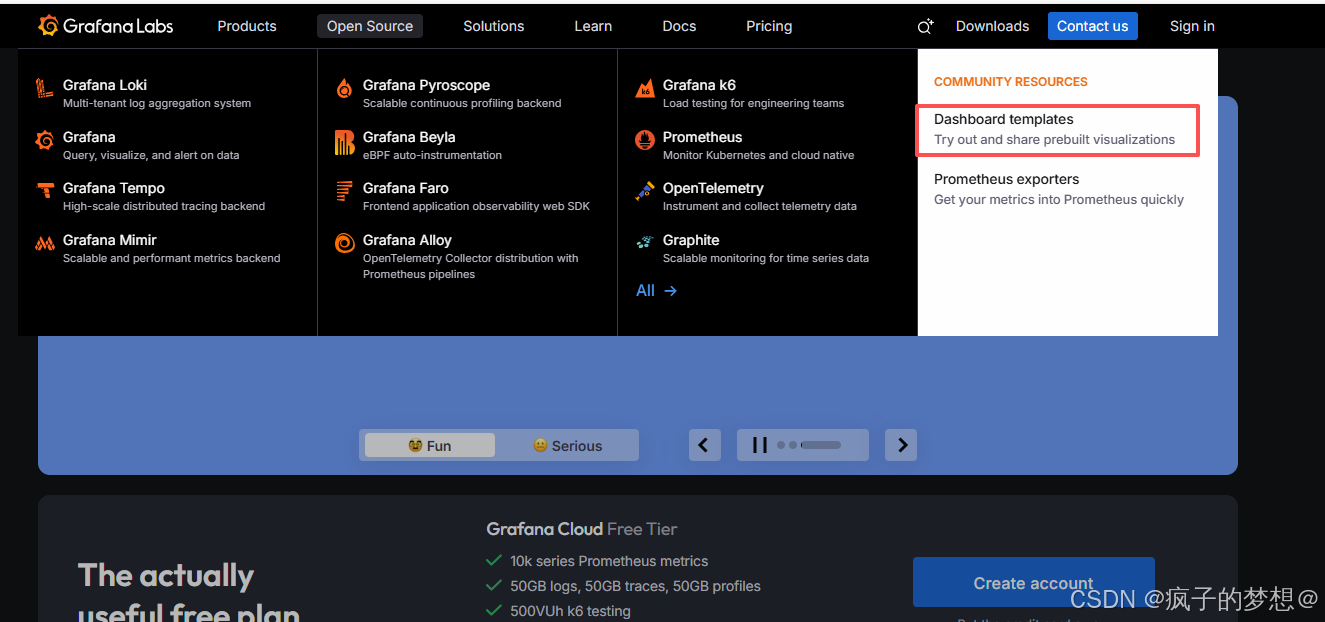
选择第一个模板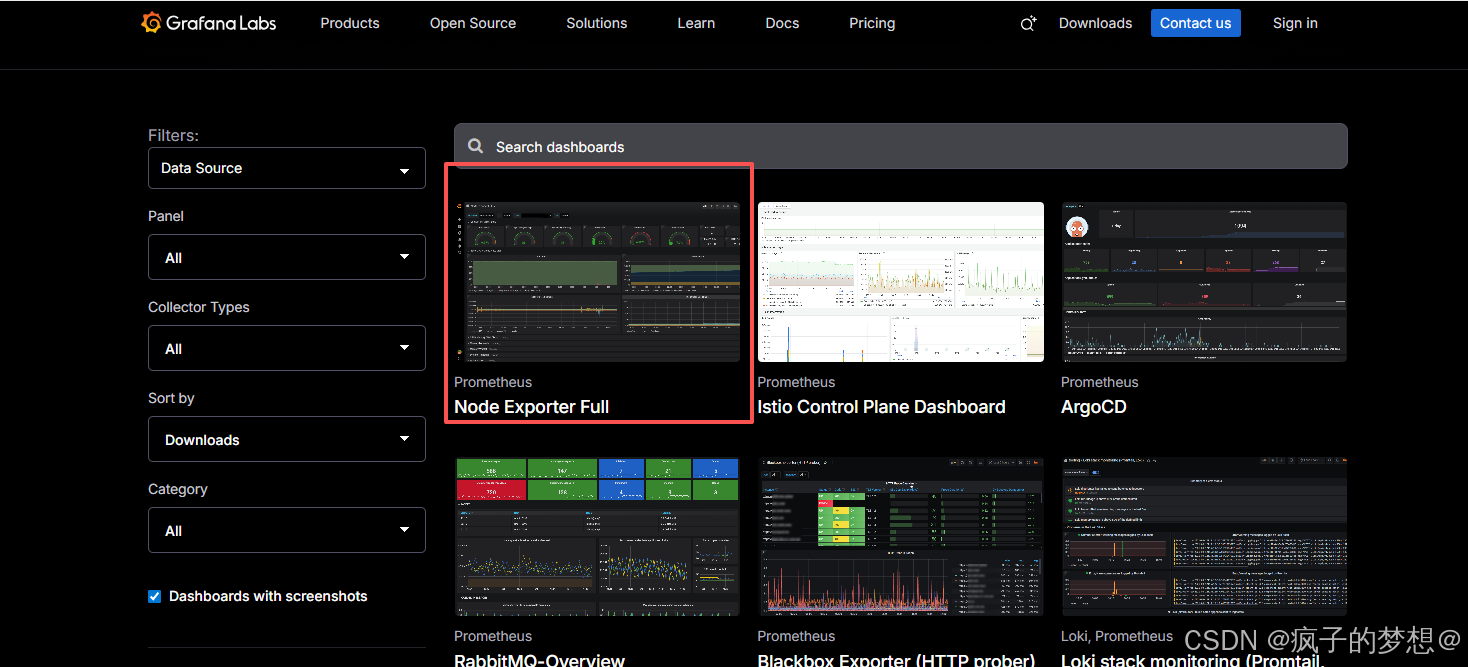
点击下载,然后会获得一个json文件,选择模板时,记得要选择与grafana相匹配的版本,否则导入后会报错,此处使用的grafana版本为2019年发布,所以模板也选择2019年发布的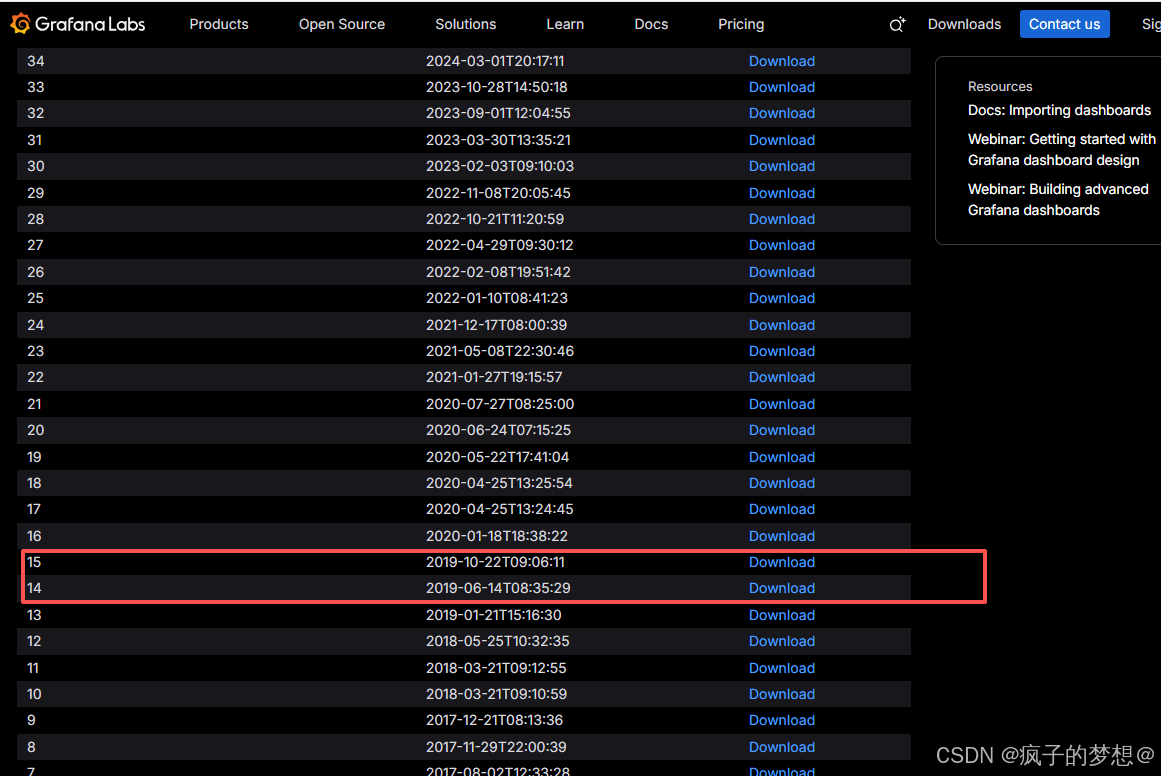
返回grafana界面,直接上传json文件即可。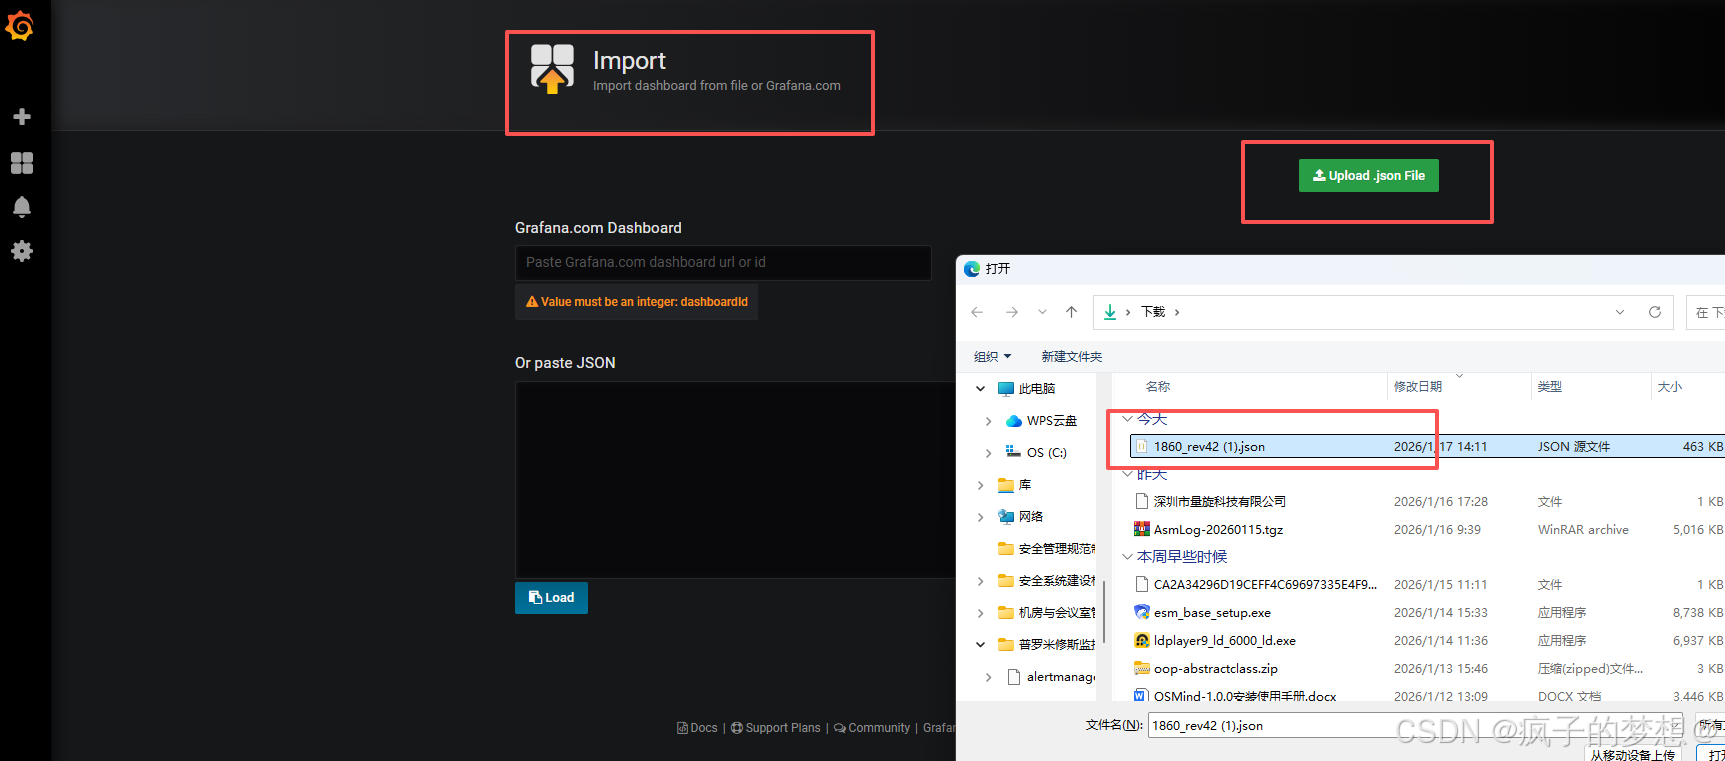
最终界面如下,此处没有启动node_exporter,所以有些地方显示N/A,启动后正常显示。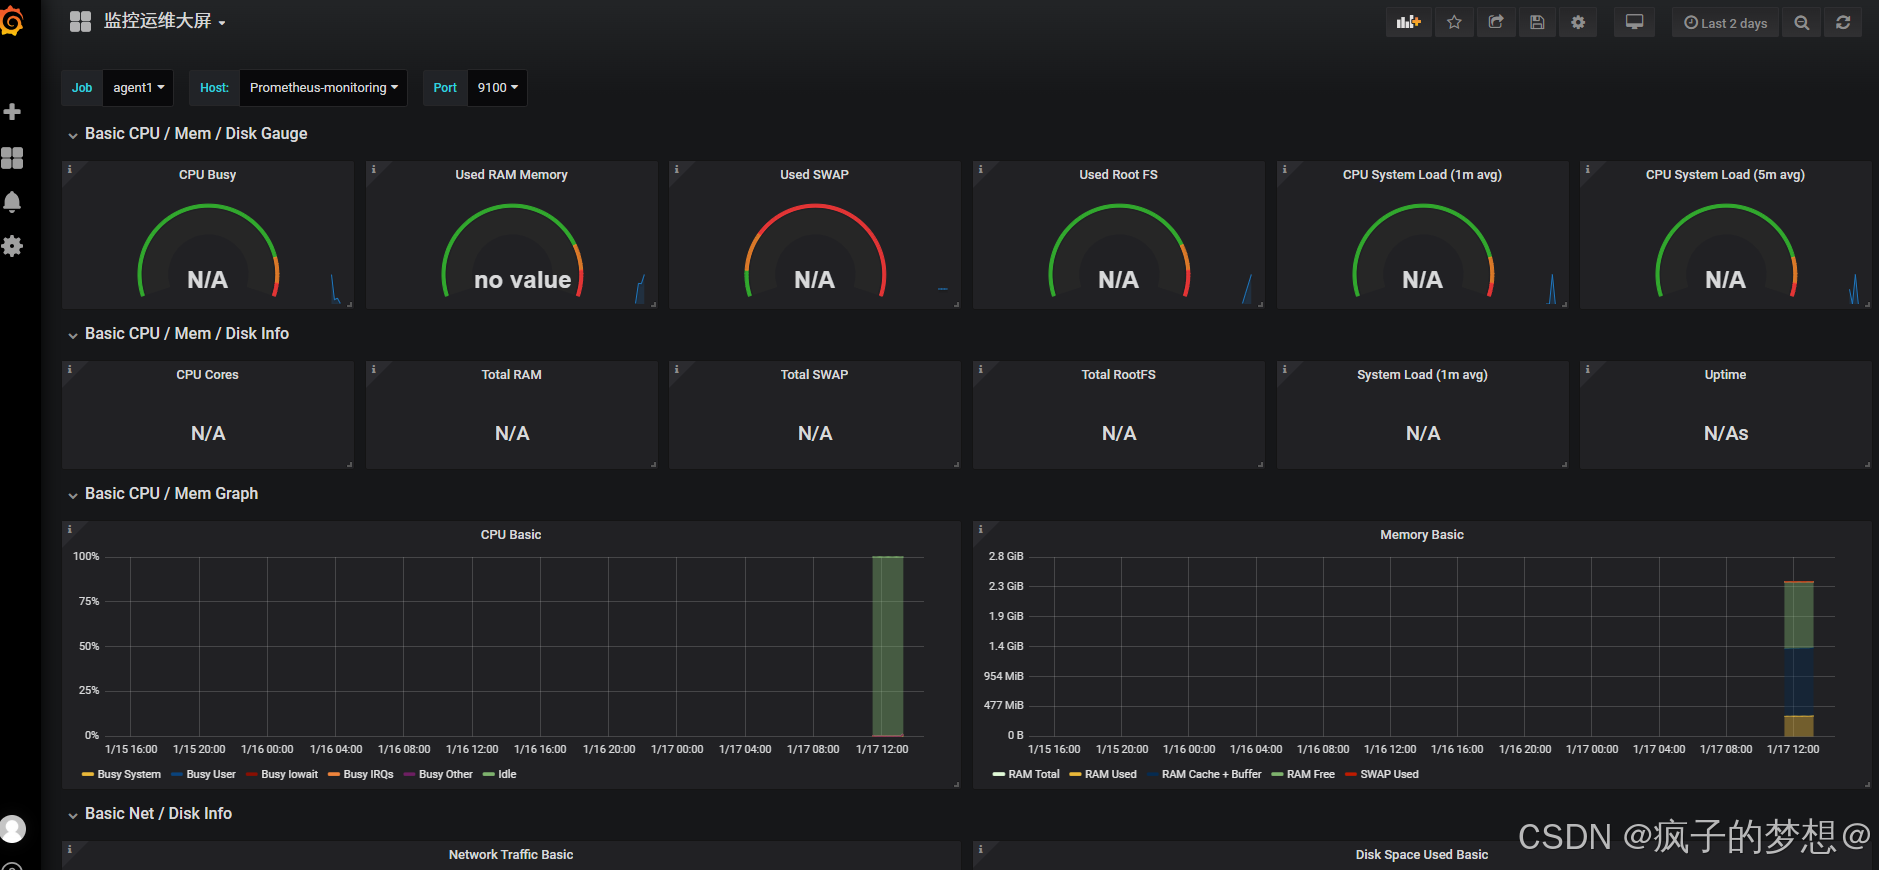
第二部分Prometheus+node_exporter+Grafana+altermanage+prometheus-webhook-dingtalk实现监控指标异常钉钉告警
prometheus-webhook-dingtalk搭配钉钉告警
登录阿里的钉钉,然后创建群,群成员必须大于等于2人,然后添加webhook机器人进群,群设置内完成如下操作:
消息推送 开启
Webhook 复制
安全设置 -> 勾选 加签 -> 复制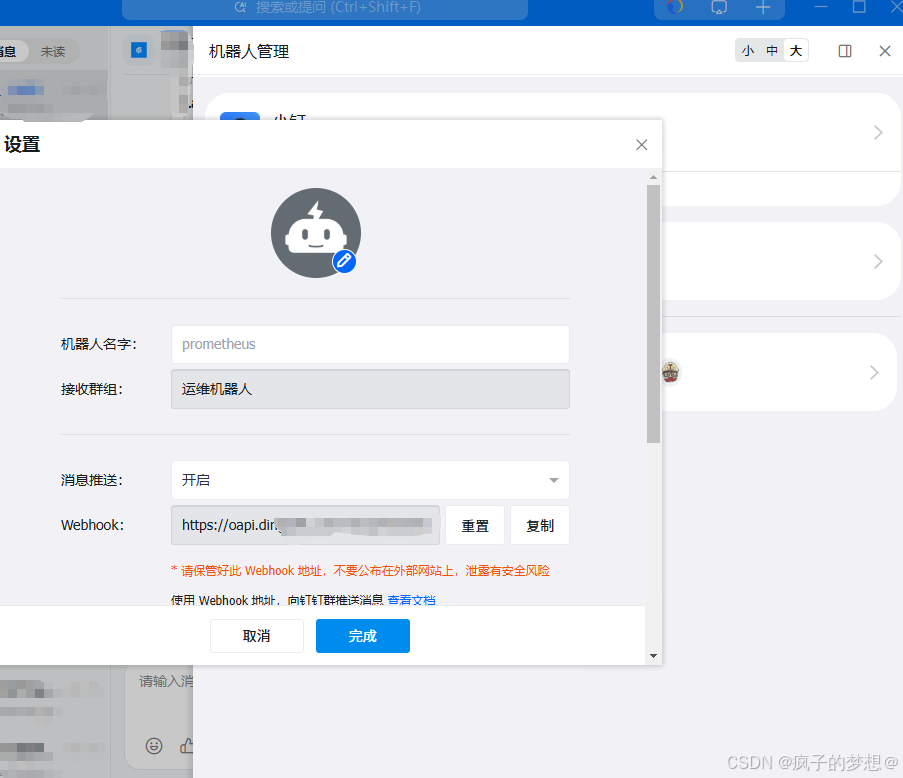
进入prometheus-webhook-dingtalk目录,编辑.yml配置文件
## 进入目录
cd /opt/prometheus-webhook-dingtalk-2.1.0.linux-amd64/
ls -l
## 复制配置文件,此处不可省略,否则启动prometheus-webhook-dingtalk会报错
cp -p config.example.yml config.yml
## 编辑配置文件
vim config.yml
## 使用默认的模板templates
## 并增加刚刚复制的钉钉机器人url与密钥secret,将其不需要的行注释掉
## Request timeout
timeout: 5s

## Uncomment following line in order to write template from scratch (be careful!)
#no_builtin_template: true

## Customizable templates path
templates:
  - contrib/templates/legacy/template.tmpl

## You can also override default template using `default_message`
## The following example to use the 'legacy' template from v0.3.0
default_message:
  title: '{{ template "legacy.title" . }}'
  text: '{{ template "legacy.content" . }}'

## Targets, previously was known as "profiles"
targets:
  webhook1:
    url: https://oapi.dingtalk.com/robot/send?access_token=你的token
    # secret for signature
    secret: 你的密钥
    # webhook2:
    #url: https://oapi.dingtalk.com/robot/send?access_token=xxxxxxxxxxxx
    #webhook_legacy:
    #url: https://oapi.dingtalk.com/robot/send?access_token=xxxxxxxxxxxx
    # Customize template content
    #message:
      # Use legacy template
      #title: '{{ template "legacy.title" . }}'
      #text: '{{ template "legacy.content" . }}'
      #webhook_mention_all:
      #url: https://oapi.dingtalk.com/robot/send?access_token=xxxxxxxxxxxx
      #mention:
      #all: true
      #webhook_mention_users:
      #url: https://oapi.dingtalk.com/robot/send?access_token=xxxxxxxxxxxx
      #mention:
      #mobiles: ['156xxxx8827', '189xxxx8325']
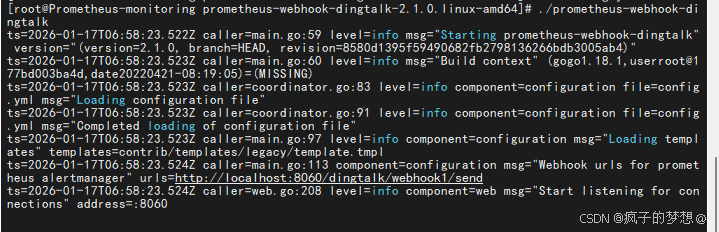
## 修改防火墙规则,添加端口8060
firewall-cmd --zone=public --add-port=8060/tcp --permanent
## 重载防火墙
firewall-cmd --reload
## 启动服务
./prometheus-webhook-dingtalk
altermanager配置文件修改
## 进入altermanager目录
cd /opt/alertmanager-0.29.0.linux-amd64/
ls -l
## 编辑alertmanager.yml配置文件
vim alertmanager.yml
## 配置文件编辑内容如下
global:
  resolve_timeout: 5m
route:
  group_by: ['alertname']
  group_wait: 10s
  group_interval: 15s
  repeat_interval: 20m
  receiver: 'dingding.webhook1'
receivers:
  - name: 'dingding.webhook1'
    webhook_configs:
      - url: 'http://你自己安装了webhook-dingtalk服务器的ip:8060/dingtalk/webhook1/send'
        send_resolved: true
inhibit_rules:
  - source_match:
      severity: 'critical'
    target_match:
      severity: 'warning'
    equal: ['alertname', 'dev', 'instance']
## 然后修改防火墙规则,增加9093
firewall-cmd --zone=public --add-port=9093/tcp --permanent
## 重载防火墙
firewall-cmd --reload
## 启动服务
cd /opt/alertmanager-0.29.0.linux-amd64
./alertmanager
再次修改prometheus配置文件
先修改prometheus.yml文件,增加告警规则的指定位置,增加altermanager告警服务的地址
# my global config
global:
  scrape_interval: 15s # Set the scrape interval to every 15 seconds. Default is every 1 minute.
  evaluation_interval: 15s # Evaluate rules every 15 seconds. The default is every 1 minute.
  # scrape_timeout is set to the global default (10s).

# Alertmanager configuration
# 增加alter告警服务的地址
alerting:
  alertmanagers:
    - static_configs:
        - targets:
           - 你的服务地址:9093

# Load rules once and periodically evaluate them according to the global 'evaluation_interval'.
# 增加告警规则指定位置,位置为相对位置
rule_files:
   - "alter_rules/first_rules.yml"
  # - "second_rules.yml"

# A scrape configuration containing exactly one endpoint to scrape:
# Here it's Prometheus itself.
scrape_configs:
  # The job name is added as a label `job=<job_name>` to any timeseries scraped from this config.
  # 普罗米修斯默认的监控项目
  - job_name: "prometheus"

    # metrics_path defaults to '/metrics'
    # scheme defaults to 'http'.

    static_configs:
      - targets: ["localhost:9090"]
       # The label name is added as a label `label_name=<label_value>` to any timeseries scraped from this config.
        labels:
          app: "prometheus"


  #自定义的监控项目
  - job_name: "agent1"
    static_configs:
      - targets: ["你的目标机器1地址:9100"]
        labels:
          app: "prometheus服务端本机"
  - job_name: "agent2"
    static_configs:
      - targets: ["你的目标机器2地址:9100"]
        labels:
          app: "你的自定义名称"
在prometheus安装目录新建alter_rules目录,增加告警文件规则
## 进入安装普罗米修斯目录
cd /opt/prometheus-3.8.0.linux-amd64/
## 新建告警规则目录
mkdir alter_rules
## 进到该目录
cd alter_rules
## 新建告警规则文件
touch first_rules.yml
## 告警规则文件内容
# 规则组列表,每个规则组是独立的规则集合
groups:
# 第一个规则组,用于监控系统资源相关指标
- name: system_resource_monitoring
rules:
# 监控 CPU 使用率的告警规则
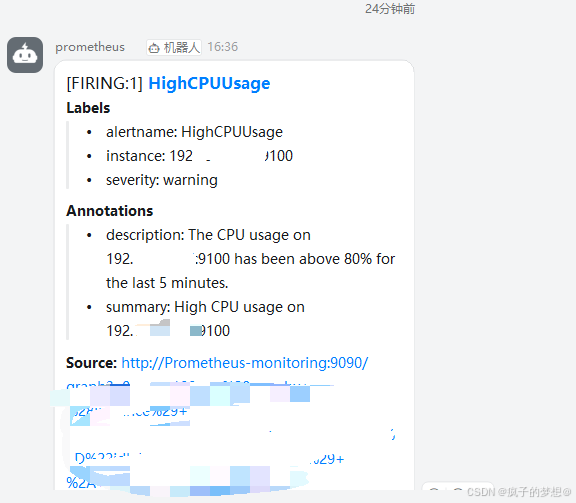
- alert: HighCPUUsage
# 告警名称,用于唯一标识该告警
expr: 100 - (avg by (instance) (irate(node_cpu_seconds_total{mode="idle"}[30s])) * 100) > 80
# 告警表达式,计算每个实例的 CPU 使用率,判断是否超过 80%
for: 30s
# 持续时间,CPU 使用率必须连续 30s超过 80% 才触发告警
labels:
severity: warning
# 告警严重级别为警告
annotations:
summary: "High CPU usage on {{ $labels.instance }}"
# 告警简要描述,动态插入实例名称
description: "The CPU usage on {{ $labels.instance }} has been above 80% for the last 5 minutes."
# 告警详细描述,说明 CPU 使用率过高及持续时间
# 监控内存使用率的告警规则
- alert: HighMemoryUsage
expr: (node_memory_MemTotal_bytes - node_memory_MemAvailable_bytes) / node_memory_MemTotal_bytes * 100 > 90
# 计算内存使用率,判断是否超过 90%
for: 5m
# 持续时间,内存使用率必须连续 5 分钟超过 90% 才触发告警
labels:
severity: warning
# 告警严重级别为警告
annotations:
summary: "High memory usage on {{ $labels.instance }}"
# 告警简要描述,动态插入实例名称
description: "The memory usage on {{ $labels.instance }} has been above 90% for the last 5 minutes."
# 告警详细描述,说明内存使用率过高及持续时间
# 监控磁盘使用率的告警规则
- alert: HighDiskUsage
expr: (node_filesystem_size_bytes{mountpoint="/"} - node_filesystem_free_bytes{mountpoint="/"}) / node_filesystem_size_bytes{mountpoint="/"} * 100 > 85
# 计算根目录(/)的磁盘使用率,判断是否超过 85%
for: 5m
# 持续时间,磁盘使用率必须连续 5 分钟超过 85% 才触发告警
labels:
severity: warning
# 告警严重级别为警告
annotations:
summary: "High disk usage on {{ $labels.instance }}"
# 告警简要描述,动态插入实例名称
description: "The disk usage on {{ $labels.instance }} (mountpoint: /) has been above 85% for the last 5 minutes."
# 告警详细描述,说明磁盘使用率过高、挂载点及持续时间
# 监控磁盘 IO 使用率的告警规则
- alert: HighDiskIOUsage
expr: rate(node_disk_io_time_seconds_total[5m]) > 0.9
# 计算磁盘 IO 使用率,判断是否超过 0.9
for: 5m
# 持续时间,磁盘 IO 使用率必须连续 5 分钟超过 0.9 才触发告警
labels:
severity: warning
# 告警严重级别为警告
annotations:
summary: "High disk IO usage on {{ $labels.instance }}"
# 告警简要描述,动态插入实例名称
description: "The disk IO usage on {{ $labels.instance }} has been above 0.9 for the last 5 minutes."
# 告警详细描述,说明磁盘 IO 使用率过高及持续时间
# 第二个规则组,用于监控网络和防火墙状态
- name: network_and_firewall_monitoring
rules:
# 监控网络连通性的告警规则
- alert: NetworkConnectivityIssue
expr: probe_success{job="blackbox_exporter"} == 0
# 判断网络探测是否失败(值为 0 表示失败)
for: 2m
# 持续时间,网络探测失败必须连续 2 分钟才触发告警
labels:
severity: critical
# 告警严重级别为严重
annotations:
summary: "Network connectivity issue on {{ $labels.instance }}"
# 告警简要描述,动态插入实例名称
description: "The network connectivity on {{ $labels.instance }} has failed for the last 2 minutes."
# 告警详细描述,说明网络连接失败及持续时间
# 监控防火墙状态的告警规则
- alert: FirewallNotRunning
expr: node_systemd_unit_state{name="firewalld.service",state="active"} == 0
# 判断防火墙服务(firewalld)是否未处于活跃状态(值为 0 表示未活跃)
for: 2m
# 持续时间,防火墙服务未活跃必须连续 2 分钟才触发告警
labels:
severity: critical
# 告警严重级别为严重
annotations:
summary: "Firewall is not running on {{ $labels.instance }}"
# 告警简要描述,动态插入实例名称
description: "The firewall service on {{ $labels.instance }} has been inactive for the last 2 minutes."
# 告警详细描述,说明防火墙服务未运行及持续时间
测试是否能正常钉钉报警
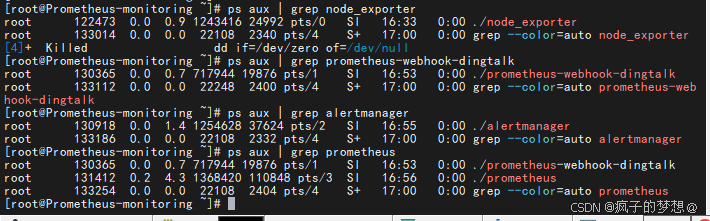
## 命令行执行
dd if=/dev/zero of=/dev/null &
## 执行top,查看cpu使用率,如果执行一次dd if=/dev/zero of=/dev/null &达不到100%占用,那就多执行几次
top
## 各项服务后台进程启动,需要分别cd进到各服务的目录下,执行启动进程
./prometheus-webhook-dingtalk &
./alertmanager &
./prometheus &
./node_exporter &
## 可分别查看其进程有无真正起来
## 查看进程启动情况,以node_exporter举例,其他服务替换服务名和端口号即可,其中prometheus-webhook-dingtalk服务名称为prometheus-webh
ps aux | grep node_exporter
## 可以通过端口号查询进程是否存在,同时获得pid号
sudo netstat -tulpn | grep 9100
## 测试完毕后,需要kill -9 pid号
kill -9 dd的pid号
kill -9 各服务的pid号
各项服务的端口号
ss -tulpn | grep node_exporter #端口号9100
ss -tulpn | grep alertmanager #端口号9093
ss -tulpn | grep prometheus-webh #端口号8060
ss -tulpn | grep prometheus #端口号9090
ss -tulpn | grep grafana #端口号3000
问题排查
- 观察30秒后,没有告警通知发出,则命令行输入top,查看cpu占用飙升后,打开prometheus的web页面。查看是否能正常采集到机器的各项指标,若没有,则说明采集指标异常。
- 各服务所需的端口一定要在防火墙开放。且监听地址为0.0.0.0。
第三部分设置各项服务为开机启动,失败后重启。
-
先确认好各服务的安装目录,示例如下,在/opt/下:
-
编辑prometheus系统启动文件
## 编辑prometheus文件
sudo vi /etc/systemd/system/prometheus.service
## 文件内容如下:
[Unit]
# 服务描述
Description=Prometheus监控系统
# 官方文档链接
Documentation=https://prometheus.io/
# 启动顺序,确保在网络服务启动后再启动本服务
After=network.target

[Service]
# 服务类型,simple表示主进程启动后服务即视为激活
Type=simple
# Prometheus执行文件路径和启动参数
# --config.file指定配置文件位置(使用您的实际路径)
# --storage.tsdb.path指定监控数据存储路径(使用您的实际路径)
# --web.listen-address指定监听地址和端口(0.0.0.0表示监听所有网络接口)
ExecStart=/opt/prometheus-3.8.0.linux-amd64/prometheus \
  --config.file=/opt/prometheus-3.8.0.linux-amd64/prometheus.yml \
  --storage.tsdb.path=/opt/prometheus-3.8.0.linux-amd64/data \
  --web.listen-address=0.0.0.0:9090
# 服务异常退出时自动重启
Restart=on-failure
# 重启前等待5秒
RestartSec=5s
# 指定工作目录为您的安装目录
WorkingDirectory=/opt/prometheus-3.8.0.linux-amd64
# 限制内存使用(可选,根据您的系统配置调整)
MemoryLimit=2G

[Install]
# 指定服务安装到哪个系统目标下,multi-user.target表示多用户命令行模式
WantedBy=multi-user.target
- 编辑node_export系统启动文件
## 编辑node_export系统启动文件
sudo vi /etc/systemd/system/node_exporter.service

## 文件内容如下:
[Unit]
# 服务描述
Description=Node Exporter for Prometheus
# 官方文档链接
Documentation=https://github.com/prometheus/node_exporter
# 启动顺序,确保在网络服务启动后再启动本服务
After=network.target

[Service]
# 服务类型,simple表示主进程启动后服务即视为激活
Type=simple
# node_exporter执行文件路径(已根据您的实际路径调整)
# --web.listen-address指定监听地址和端口(默认9100)
# --collector.systemd 启用systemd收集器
# --collector.processes 启用进程收集器
ExecStart=/opt/node_exporter-1.10.2.linux-amd64/node_exporter \
  --web.listen-address=:9100 \
  --collector.systemd \
  --collector.processes
# 服务异常退出时自动重启
Restart=on-failure
# 重启前等待5秒
RestartSec=5s
# 指定工作目录为您的安装目录
WorkingDirectory=/opt/node_exporter-1.10.2.linux-amd64
# 指定运行用户(这里使用root,生产环境建议使用专用用户)
User=root
Group=root

[Install]
# 指定服务安装到哪个系统目标下,multi-user.target表示多用户命令行模式
WantedBy=multi-user.target
- 编辑Grafana系统启动文件。因此处使用的是RPM包安装,所以Grafana已经自带systemd服务文件,只需启用即可。
# 启用Grafana服务开机自启
sudo systemctl enable grafana-server

# 启动Grafana服务
sudo systemctl start grafana-server

# 检查服务状态
sudo systemctl status grafana-server
- 编辑altermanager系统启动文件
## 创建systemd服务文件
sudo vi /etc/systemd/system/alertmanager.service

## 文件内容如下:
[Unit]
# 服务描述
Description=Alertmanager for Prometheus
# 官方文档链接
Documentation=https://prometheus.io/docs/alerting/alertmanager/
# 启动顺序,确保在网络服务启动后再启动本服务
After=network.target

[Service]
# 服务类型,simple表示主进程启动后服务即视为激活
Type=simple
# Alertmanager执行文件路径(已根据您的实际路径调整)
# --config.file指定配置文件位置
# --storage.path指定告警数据存储路径
# --web.listen-address指定监听地址和端口(默认9093)
ExecStart=/opt/alertmanager-0.29.0.linux-amd64/alertmanager \
  --config.file=/opt/alertmanager-0.29.0.linux-amd64/alertmanager.yml \
  --storage.path=/opt/alertmanager-0.29.0.linux-amd64/data \
  --web.listen-address=0.0.0.0:9093
# 服务异常退出时自动重启
Restart=on-failure
# 重启前等待5秒
RestartSec=5s
# 指定工作目录为您的安装目录
WorkingDirectory=/opt/alertmanager-0.29.0.linux-amd64
# 指定运行用户(这里使用root,生产环境建议使用专用用户)
User=root
Group=root

[Install]
# 指定服务安装到哪个系统目标下,multi-user.target表示多用户命令行模式
WantedBy=multi-user.target
- 设置Prometheus-webhook-dingtalk系统开机启动
## 创建systemd服务文件
sudo vi /etc/systemd/system/prometheus-webhook-dingtalk.service

## 文件内容如下:
[Unit]
# 服务描述
Description=Prometheus Webhook for DingTalk
# 官方文档链接
Documentation=https://github.com/timonwong/prometheus-webhook-dingtalk
# 启动顺序,确保在网络服务启动后再启动本服务
After=network.target

[Service]
# 服务类型,simple表示主进程启动后服务即视为激活
Type=simple
# Prometheus-webhook-dingtalk执行文件路径(已根据您的实际路径调整)
# --config.file指定配置文件位置
# --web.listen-address指定监听地址和端口(默认8060)
ExecStart=/opt/prometheus-webhook-dingtalk-2.1.0.linux-amd64/prometheus-webhook-dingtalk \
  --config.file=/opt/prometheus-webhook-dingtalk-2.1.0.linux-amd64/config.yml \
  --web.listen-address=0.0.0.0:8060
# 服务异常退出时自动重启
Restart=on-failure
# 重启前等待5秒
RestartSec=5s
# 指定工作目录为您的安装目录
WorkingDirectory=/opt/prometheus-webhook-dingtalk-2.1.0.linux-amd64
# 指定运行用户(这里使用root,生产环境建议使用专用用户)
User=root
Group=root

[Install]
# 指定服务安装到哪个系统目标下,multi-user.target表示多用户命令行模式
WantedBy=multi-user.target
- 重载系统服务文件加载,各项服务启动,各项服务设置开机自启。
## 重载系统服务文件
sudo systemctl daemon-reload
## 设置Prometheus开机自启
sudo systemctl enable prometheus
## 启动Prometheus服务
sudo systemctl start prometheus

# 设置node_exporter开机自启
sudo systemctl enable node_exporter
# 启动node_exporter服务
sudo systemctl start node_exporter

# 启用Grafana服务开机自启
sudo systemctl enable grafana-server
# 启动Grafana服务
sudo systemctl start grafana-server

# 设置开机自启
sudo systemctl enable alertmanager
# 启动服务
sudo systemctl start alertmanager

# 设置开机自启
sudo systemctl enable prometheus-webhook-dingtalk
# 启动服务
sudo systemctl start prometheus-webhook-dingtalk
- 查看各项服务状态
sudo systemctl status prometheus
sudo systemctl status node_exporter
sudo systemctl status grafana-server
sudo systemctl status alertmanager
sudo systemctl status prometheus-webhook-dingtalk
重点观察两个位置的状态。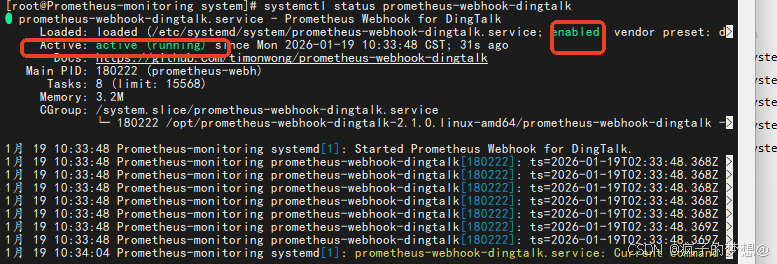

DAMO开发者矩阵,由阿里巴巴达摩院和中国互联网协会联合发起,致力于探讨最前沿的技术趋势与应用成果,搭建高质量的交流与分享平台,推动技术创新与产业应用链接,围绕“人工智能与新型计算”构建开放共享的开发者生态。
更多推荐

 14
14 0
0- 0


 已为社区贡献1条内容

所有评论(0)