Eip开源从站Opener在MCU上的移植调试记录(四 调优过程)
摘要:文章详细记录了工业通信协议栈的实时性优化过程。通过调整FreeRTOS任务优先级(将底层网络任务设为最高优先级),50ms通讯周期从105ms降至96ms。使用Wireshark抓包分析发现实际抖动仅±30us,证明系统满足要求。进一步将周期压缩至20ms/5ms/2ms时,通过优化EDS配置和调整Opener线程处理机制,最终实现±40us的抖动。同时针对内存占用问题(从144KB优化至7
六、调优过程
实时性问题
对于50ms的IO连接通讯周期
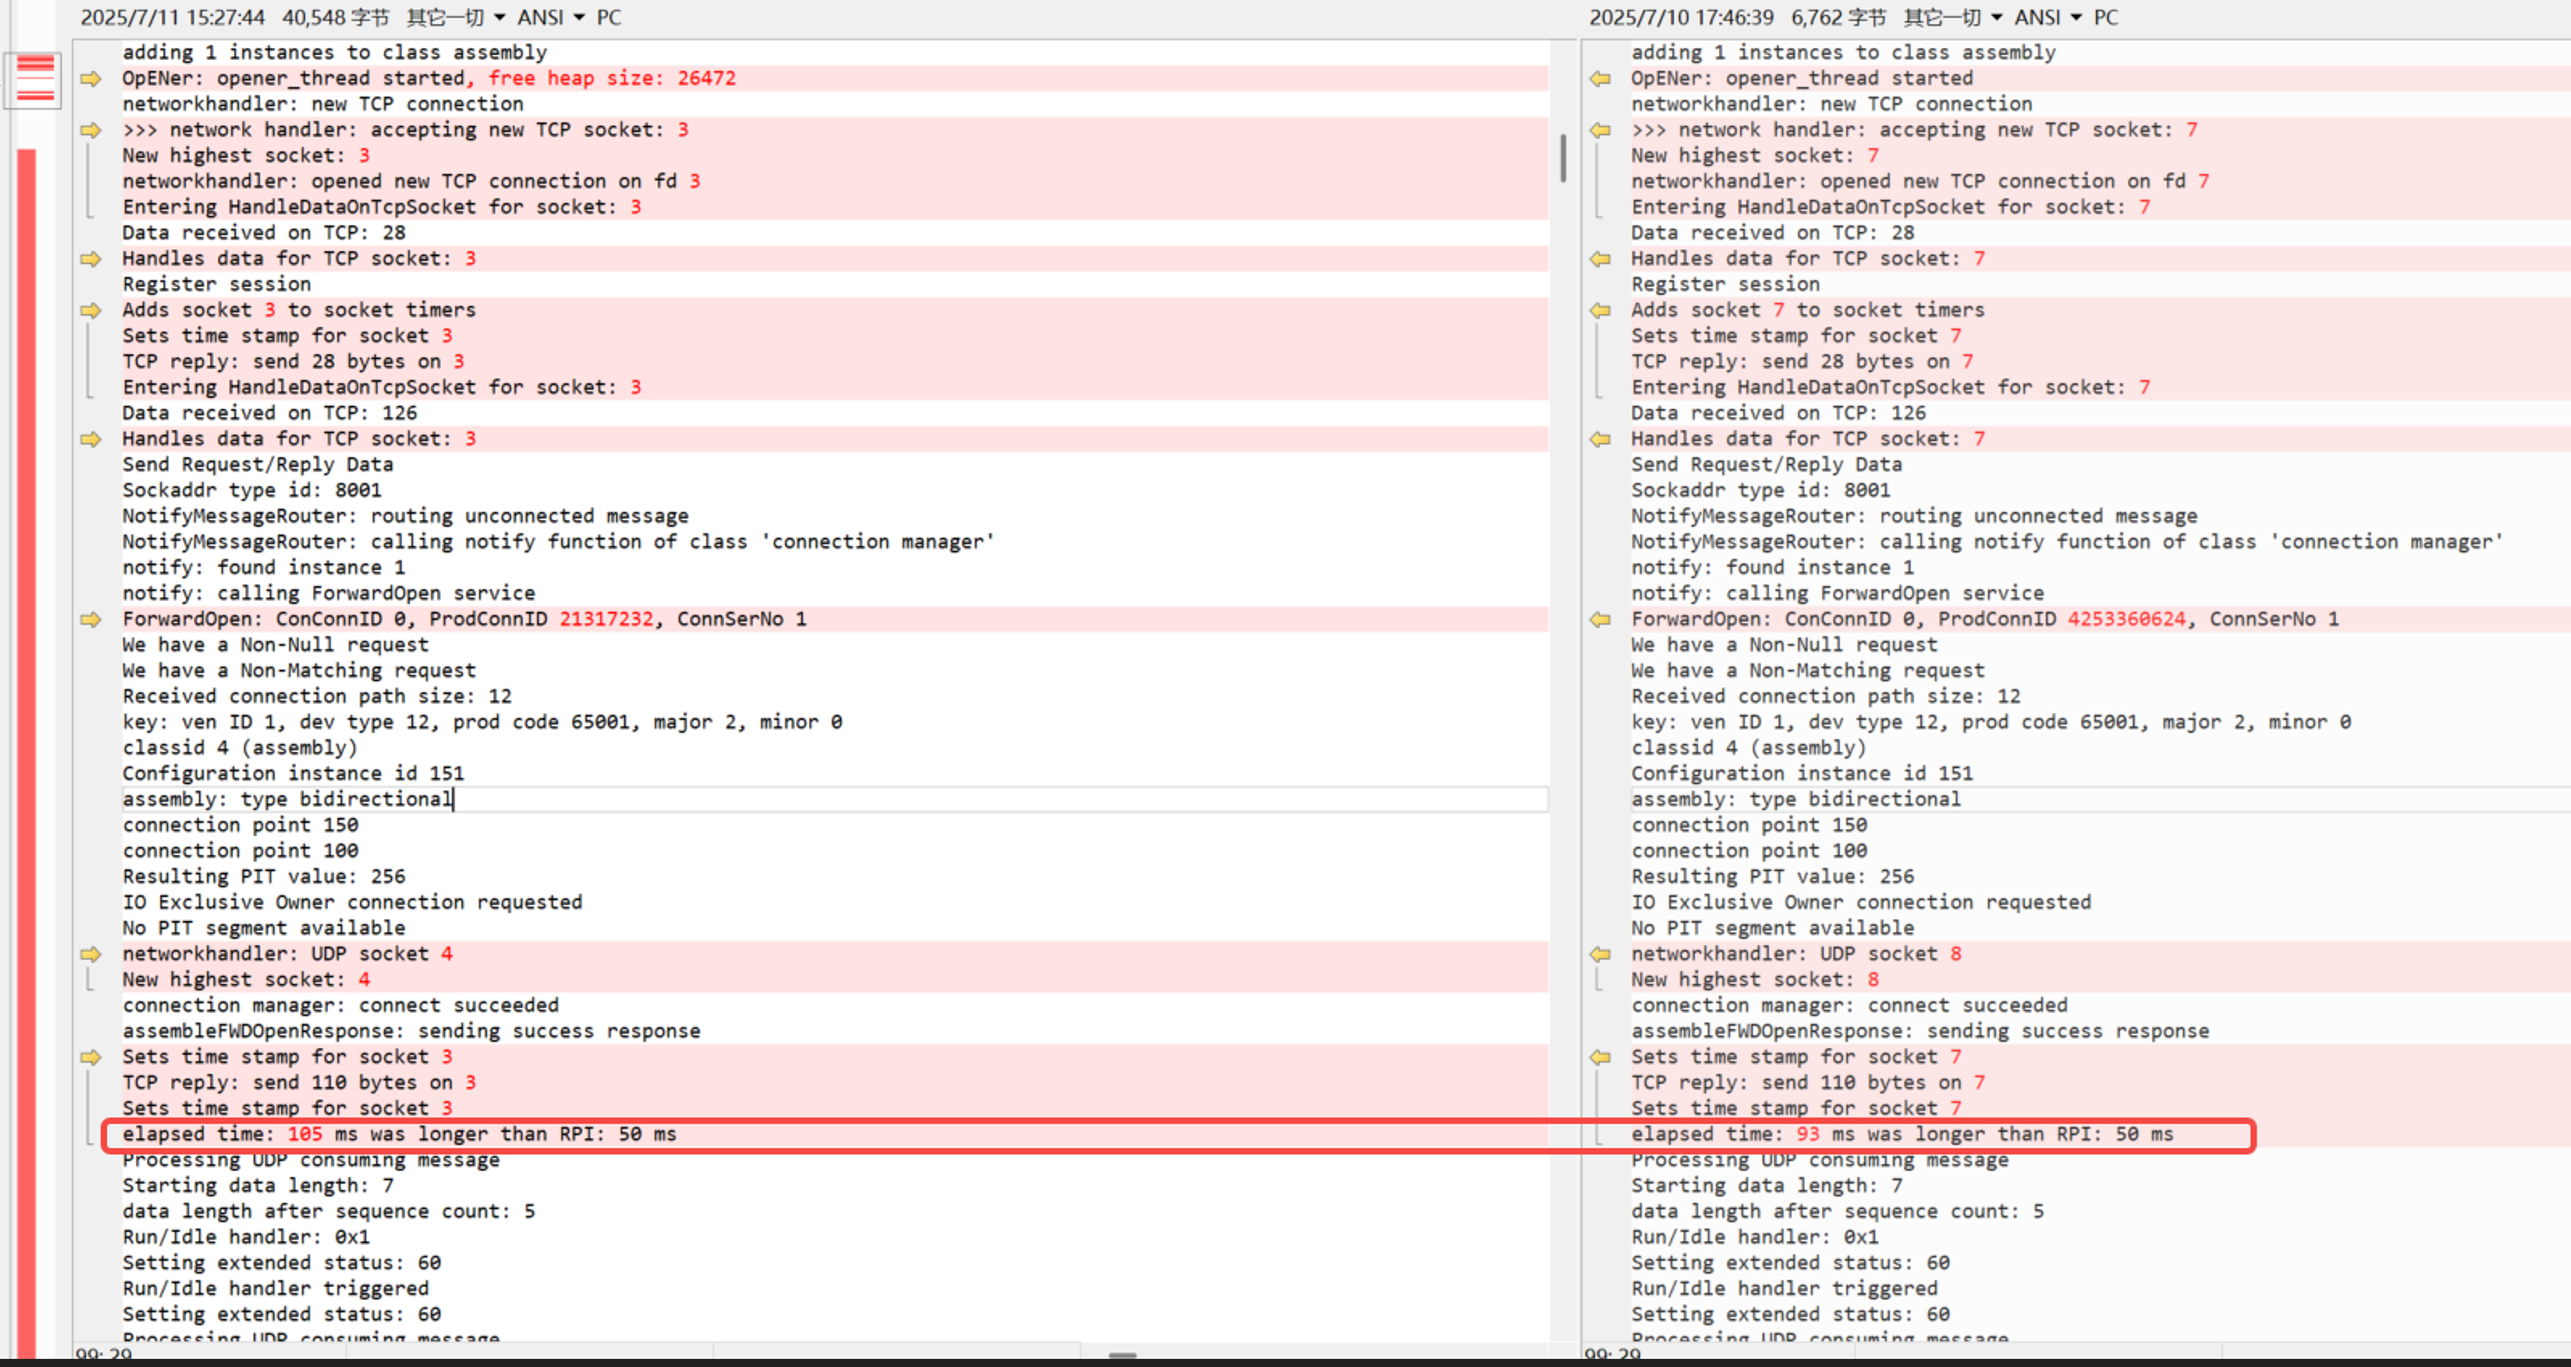
设置的50ms通讯周期,实际跑到了105ms
首先怀疑任务优先级设置问题,打开FreeRTOS的任务信息功能,打印出来如下:
Task List:
my_task01              X        0        42        1
IDLE                   R        0        116        2
tcpip_thread           B        7        201        4
eth_link_thread        B        6        424        6
opener_thread          B        10        949        7
eth_rxpkt              B        5        314        5
Tmr Svc                B        2        230        3
发现任务优先级设计不合理,由于opener是在TCP/IP之上的应用层协议,优先级设置应该是:
eth_rxpkt>tcpip_thread>opener_thread。
调整后,任务优先级如下:
Task List:
my_task01              X        0        19        1
IDLE                   R        0        116        2
tcpip_thread           B        9        193        4
eth_link_thread        B        6        40        6
opener_thread          B        8        164        7
Tmr Svc                B        2        230        3
eth_rxpkt              B        10        186        5
//opener的log警告:elapsed time: 96 ms was longer than RPI: 50 ms
opener还是告警,但有了一定改善。
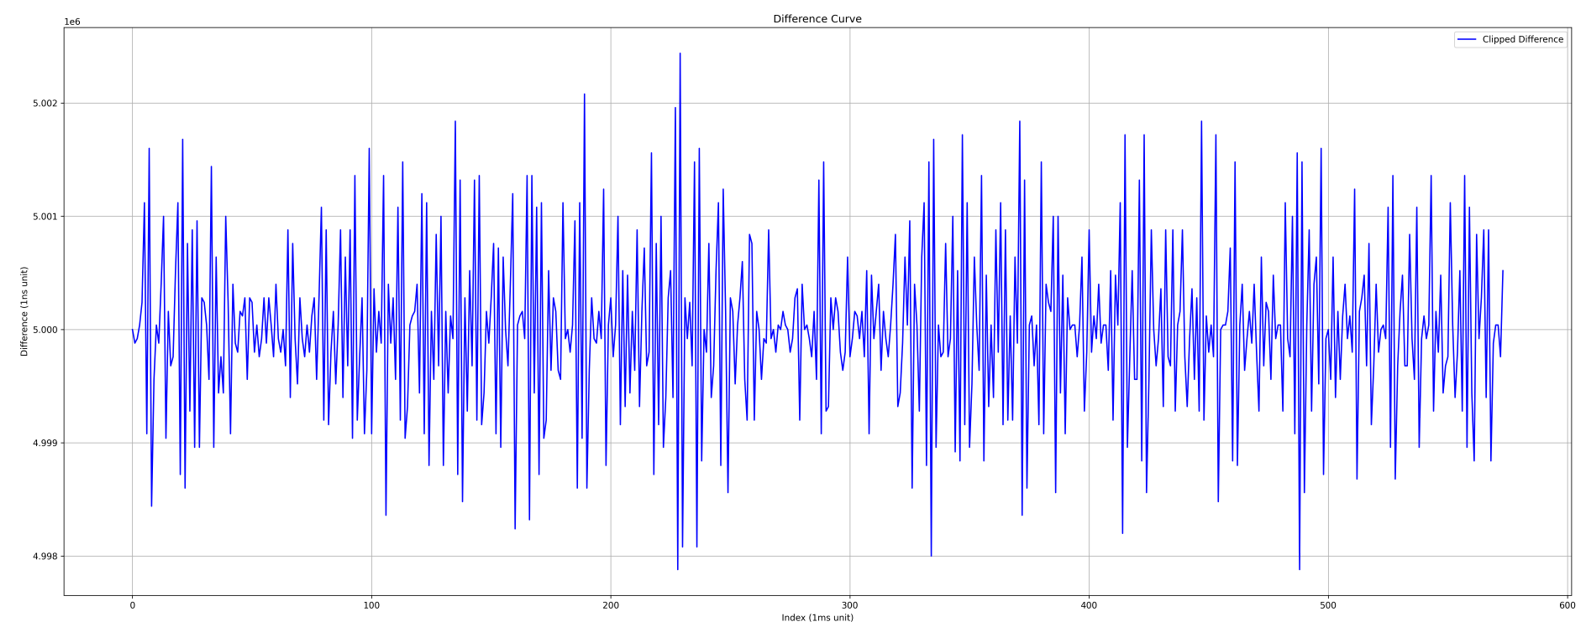
于是用wireshark抓下PLC跟opener板子之间的通讯报文(带64位的硬件时间戳),看是不是真的实时性不够。并把两个报文之间的时间间隔统计出来,画出曲线,如下:
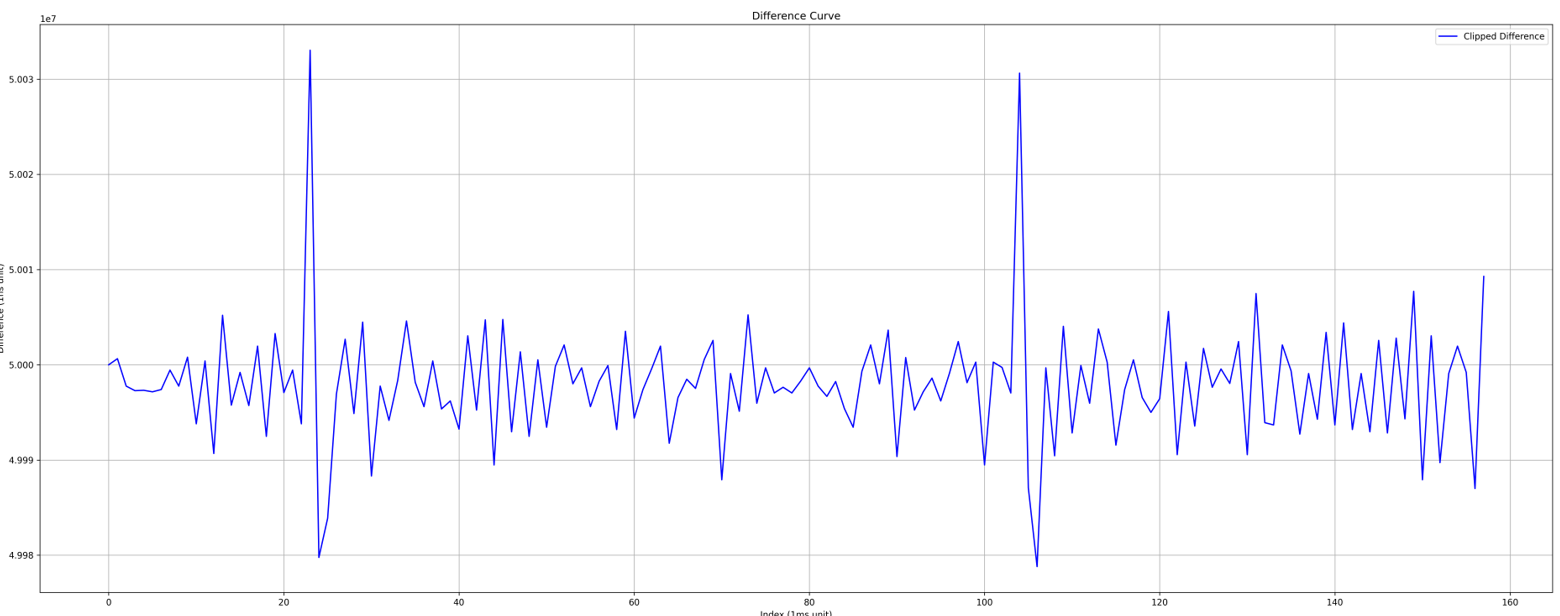
50ms的周期,抖动在±30us,满足要求。
也就说opener的log信息作为参考就好。
优化到20ms的IO连接通讯周期
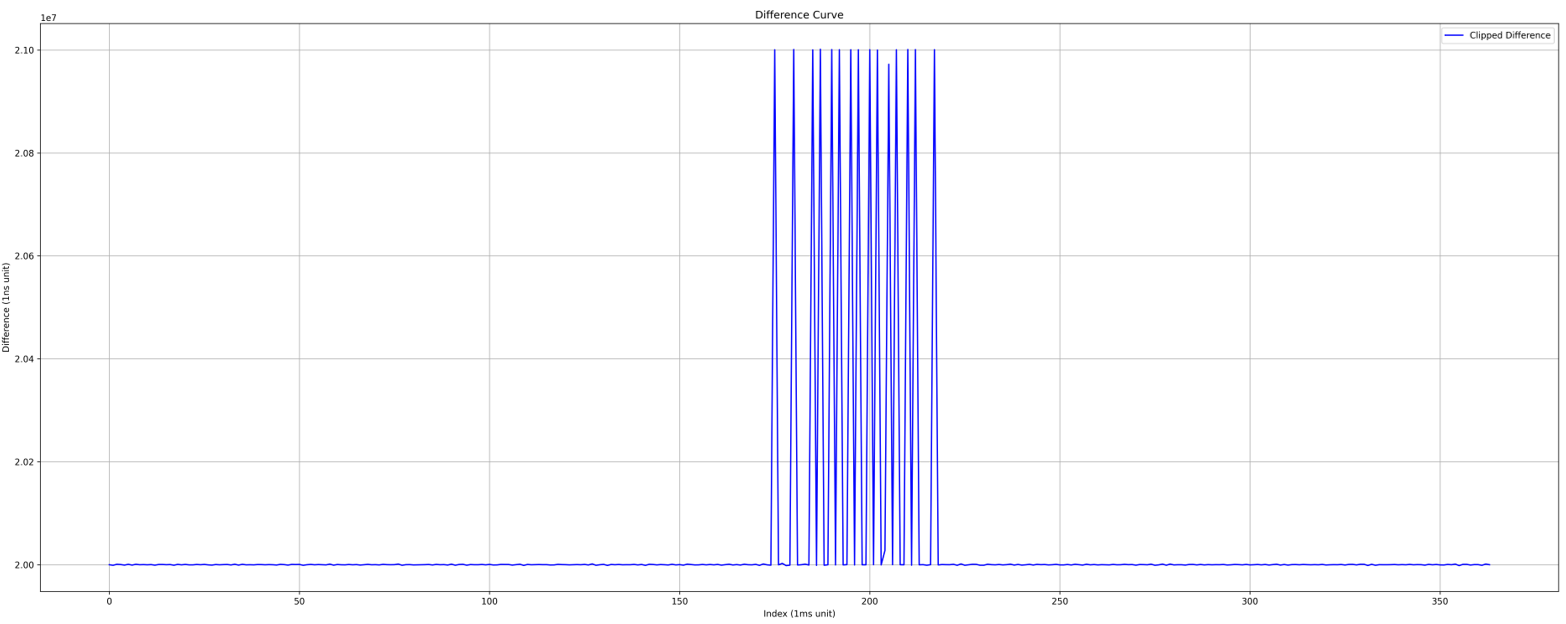
按上述分析方法,将PLC内部的IO连接提升到20ms周期,得出实时性曲线如下:
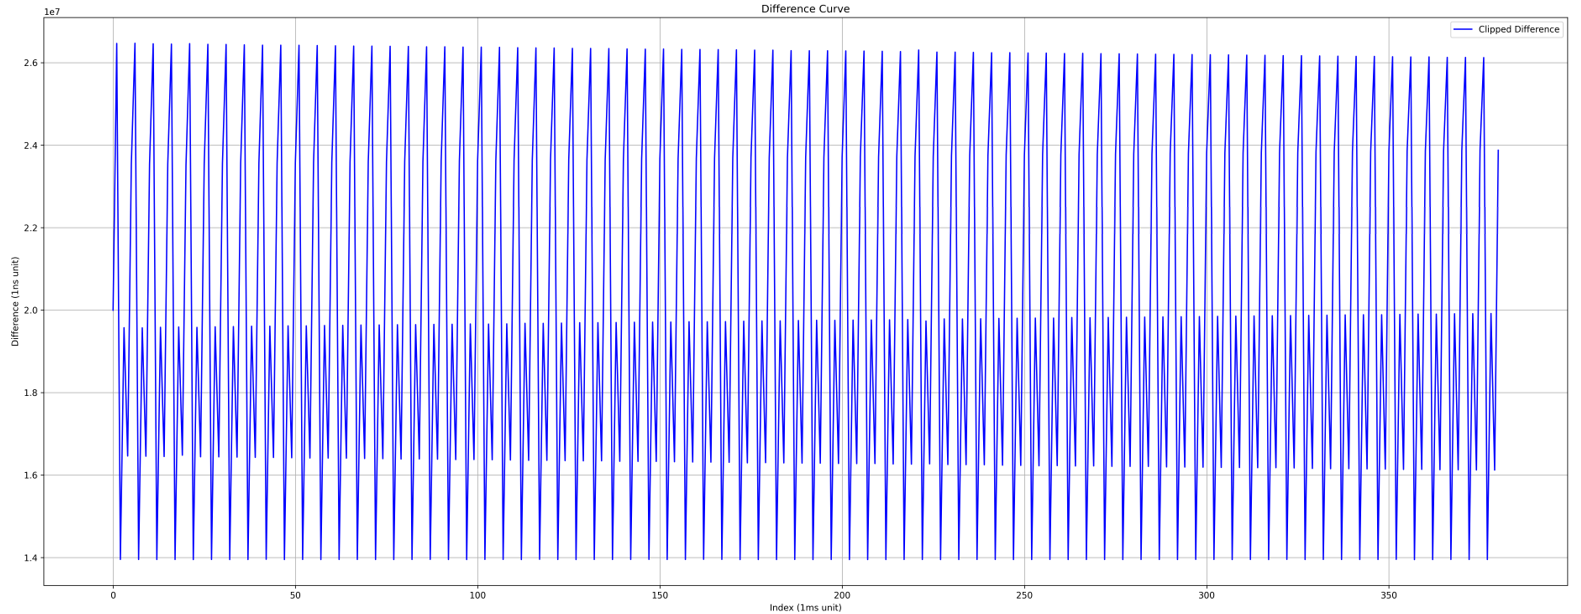
抖动在±6ms,推测为MCU报文处理慢导致。
接上逻辑分析仪,观察每个线程处理所需的时长:
方案如下,在任务进入时拉高引脚,出来后拉低引脚,统计高电平时长。
tcpip_thread          PB6   ->ch1
opener_thread         PB7   ->ch2
eth_rxpkt             PB5   ->ch0
eth_rxpkt:用时55us
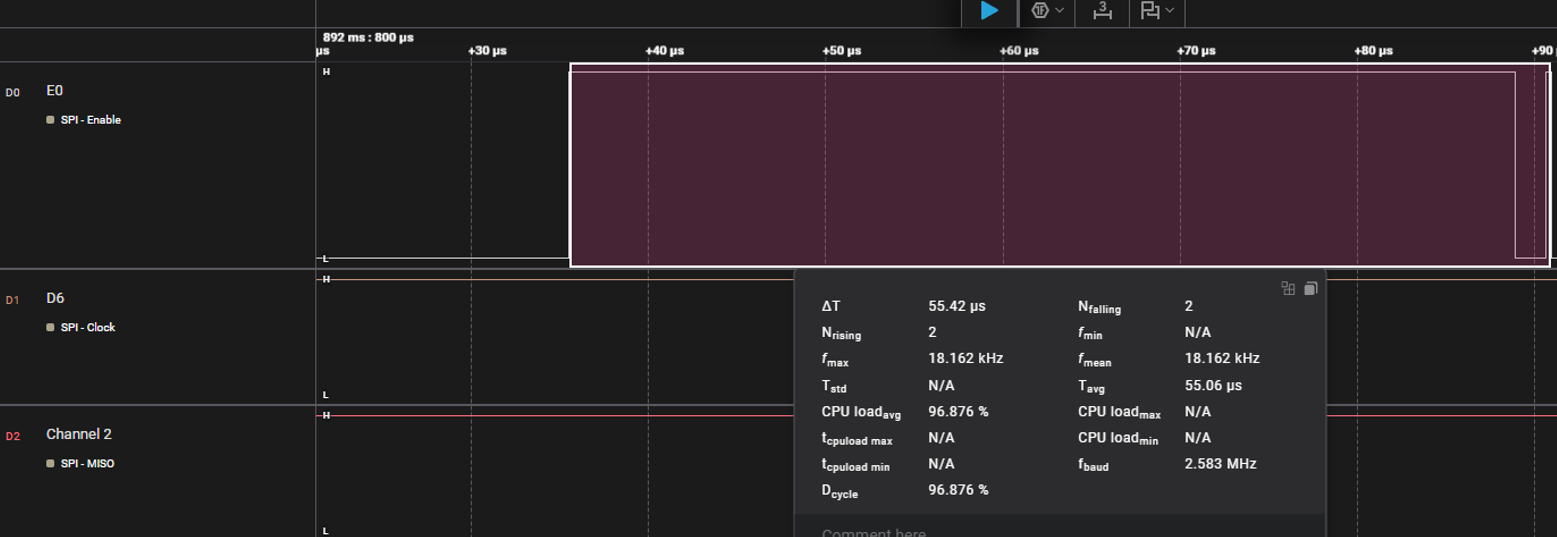
opener_thread :用时10ms
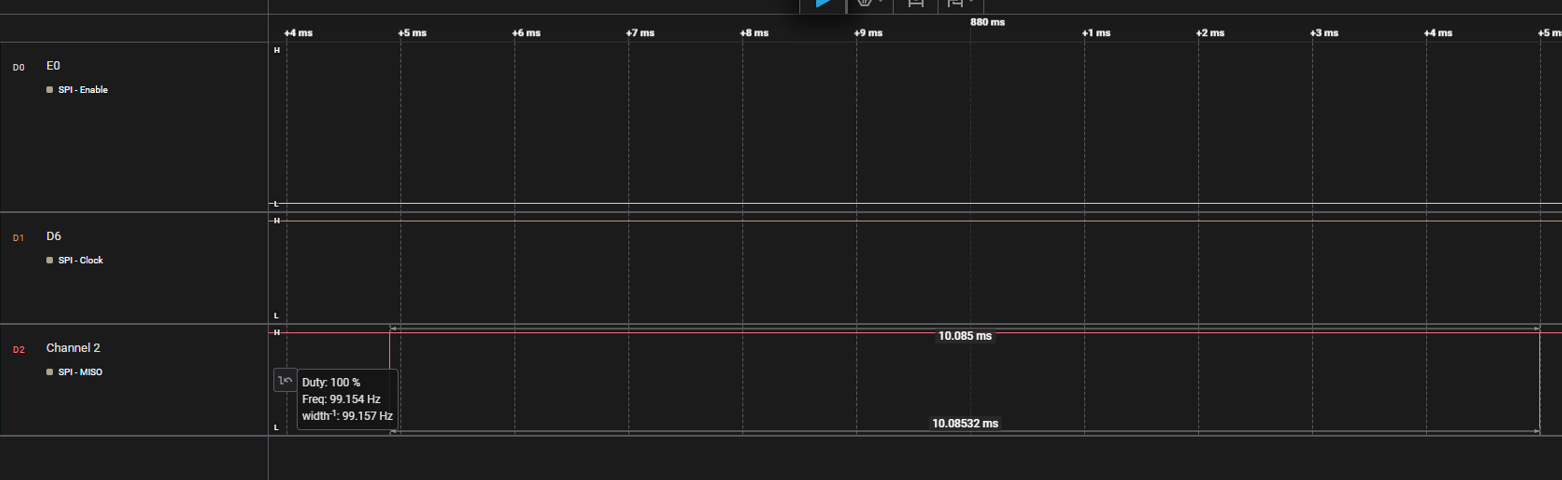
感觉不太正常,看opener_thread代码:
C
EipStatus NetworkHandlerProcessCyclic(void) {

  read_socket = master_socket;

  g_time_value.tv_sec = 0;
  g_time_value.tv_usec =
    (g_network_status.elapsed_time <
     kOpenerTimerTickInMilliSeconds ? kOpenerTimerTickInMilliSeconds -
     g_network_status.elapsed_time : 0)
    * 1000; /* 10 ms */

  int ready_socket = select(highest_socket_handle + 1,
                            &read_socket,
                            0,
                            0,
                            &g_time_value);

  if(ready_socket == kEipInvalidSocket) {
    if(EINTR == errno) /* we have somehow been interrupted. The default behavior is to go back into the select loop. */
    {
      return kEipStatusOk;
    } else {
      int error_code = GetSocketErrorNumber();
      char *error_message = GetErrorMessage(error_code);
      OPENER_TRACE_ERR("networkhandler: error with select: %d - %s\n",
                       error_code,
                       error_message);
      FreeErrorMessage(error_message);
      return kEipStatusError;
    }
  }

  if(ready_socket > 0) {

    CheckAndHandleTcpListenerSocket();
    CheckAndHandleUdpUnicastSocket();
    CheckAndHandleUdpGlobalBroadcastSocket();
    CheckAndHandleConsumingUdpSocket();

    for(int socket = 0; socket <= highest_socket_handle; socket++) {
      if( true == CheckSocketSet(socket) ) {
        /* if it is still checked it is a TCP receive */
        if( kEipStatusError == HandleDataOnTcpSocket(socket) ) /* if error */
        {
          CloseTcpSocket(socket);
          RemoveSession(socket); /* clean up session and close the socket */
        }
      }
    }
  }

  for(int socket = 0; socket <= highest_socket_handle; socket++) {
    CheckEncapsulationInactivity(socket);
  }

  /* Check if all connections from one originator times out */
  //CheckForTimedOutConnectionsAndCloseTCPConnections();
  //OPENER_TRACE_INFO("Socket Loop done\n");
  g_actual_time = GetMilliSeconds();
  g_network_status.elapsed_time += g_actual_time - g_last_time;
  g_last_time = g_actual_time;
  //OPENER_TRACE_INFO("Elapsed time: %u\n", g_network_status.elapsed_time);

  /* check if we had been not able to update the connection manager for several kOpenerTimerTickInMilliSeconds.
   * This should compensate the jitter of the windows timer
   */
  if(g_network_status.elapsed_time >= kOpenerTimerTickInMilliSeconds) {
    /* call manage_connections() in connection manager every kOpenerTimerTickInMilliSeconds ms */
    ManageConnections(g_network_status.elapsed_time);

    /* Call timeout checker functions registered in timeout_checker_array */
    for (size_t i = 0; i < OPENER_TIMEOUT_CHECKER_ARRAY_SIZE; i++) {
      if (NULL != timeout_checker_array[i]) {
        (timeout_checker_array[i])(g_network_status.elapsed_time);
      }
    }

    g_network_status.elapsed_time = 0;
  }

  return kEipStatusOk;
}
发现是按kOpenerTimerTickInMilliSeconds的周期处理一次IO连接,类似于采用阻塞的方式进行处理。
调整后,再抓包
C
/** @brief The time in ms of the timer used in this implementations, time base for time-outs and production timers
 */
static const MilliSeconds kOpenerTimerTickInMilliSeconds = 20;
发现是按kOpenerTimerTickInMilliSeconds的周期处理一次IO连接,类似于采用阻塞的方式进行处理。
调整周期设置如下:
/** @brief The time in ms of the timer used in this implementations, time base for time-outs and production timers
 */
static const MilliSeconds kOpenerTimerTickInMilliSeconds = 20;
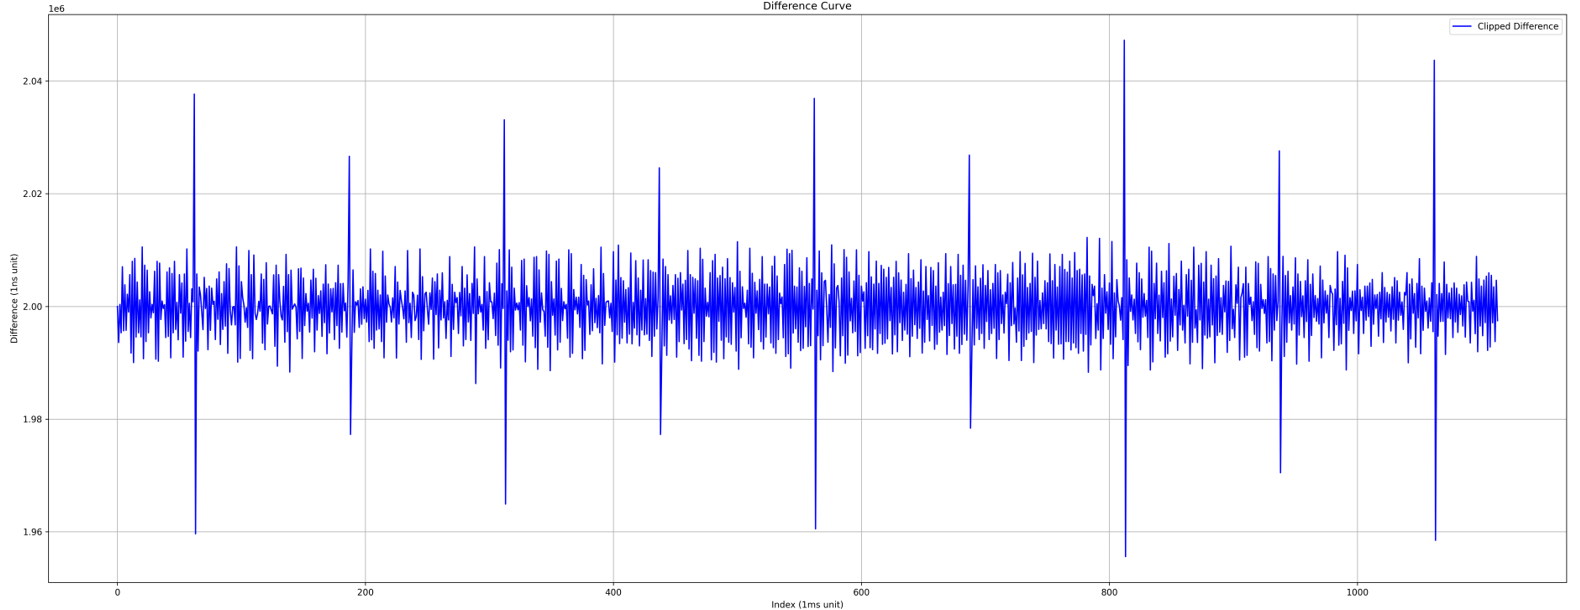
再抓包分析,输出的图表如下:
发现20ms的周期,有个1ms的尖峰,这是合理的。因为有更优先的任务将其打断导致
提升到5ms的IO连接通讯周期
这需要修改eds文件,因为opener为规定最小的PRI,也就是说主站默认。主站默认最小为20ms。
于是手动规定eds中最小io通讯周期,如下:
    .......
                1000,,Assem150,       $ O->T RPI, size, format
                1000,,Assem100,       $ T->O RPI, size, format
    .....
                "20 04 24 97 2C 96 2C 64";    $ Path
PLC配置:

Opener配置:
/** @brief The time in ms of the timer used in this implementations, time base for time-outs and production timers
 */
static const MilliSeconds kOpenerTimerTickInMilliSeconds = 5;
抓包如下:
抖动在±3us
压榨到2ms的IO连接通讯周期
重新导入EDS(PLC有bug,最小支持RPI为5ms,重新导入EDS可以恢复为2ms)
PLC配置:

opener配置:
/** @brief The time in ms of the timer used in this implementations, time base for time-outs and production timers
 */
static const MilliSeconds kOpenerTimerTickInMilliSeconds = 2;
抓包如下:
抖动在±40us。分析应该是eth_rxpkt线程处理数据打断导致。
内存占用过大问题
在FreeRTOS+Lwip+Opener时,总共144KB内存,几乎沾满了。
 Total RO  Size (Code + RO Data)               155364 ( 151.72kB)
 Total RW  Size (RW Data + ZI Data)            141464 ( 138.15kB)
 Total ROM Size (Code + RO Data + RW Data)     155444 ( 151.80kB)
找差异,在移植之前FreeRTOS+Lwip时:
    Total RO  Size (Code + RO Data)                71936 (  70.25kB)
    Total RW  Size (RW Data + ZI Data)             51864 (  50.65kB)
    Total ROM Size (Code + RO Data + RW Data)      71972 (  70.29kB)
从MAP文件分析
思路,打开map文件,抓大放小,map中大数据如下:
     Rx_Buff                                  0x20000aec   Data        9120  ethernetif.o(.bss)
    Tx_Buff                                  0x20002e8c   Data        6080  ethernetif.o(.bss)
    ram_heap                                 0x20009a58   Data        4115  mem.o(.bss)
    memp_memory_PBUF_POOL_base               0x2000b57a   Data        9731  memp.o(.bss)
    g_exlusive_owner_connections             0x2000dc88   Data        1296  appcontype.o(.bss)
    g_input_only_connections                 0x2000e198   Data        3856  appcontype.o(.bss)
    g_listen_only_connections                0x2000f0a8   Data        3856  appcontype.o(.bss)
    g_dummy_connection_object                0x2000ffd0   Data        1280  cipconnectionmanager.o(.bss)
    explicit_connection_object_pool          0x200104e0   Data        7680  cipconnectionobject.o(.bss)
    g_delayed_encapsulation_messages         0x20012428   Data        2112  encap.o(.bss)
从启动文件分析
再看.s启动文件,有个32KB的系统堆空间。
Stack_Size      EQU     0x00001000

                AREA    STACK, NOINIT, READWRITE, ALIGN=3
Stack_Mem       SPACE   Stack_Size
__initial_sp

; <h> Heap Configuration
;   <o>  Heap Size (in Bytes) <0x0-0xFFFFFFFF:8>
; </h>

Heap_Size       EQU     0x00008000
优化后:
    Total RO  Size (Code + RO Data)               156328 ( 152.66kB)
    Total RW  Size (RW Data + ZI Data)             72944 (  71.23kB)
    Total ROM Size (Code + RO Data + RW Data)     156408 ( 152.74kB)

    OpENer: opener_thread started, free heap size: 4456
文内示例见咸鱼ID:tb764914262

DAMO开发者矩阵,由阿里巴巴达摩院和中国互联网协会联合发起,致力于探讨最前沿的技术趋势与应用成果,搭建高质量的交流与分享平台,推动技术创新与产业应用链接,围绕“人工智能与新型计算”构建开放共享的开发者生态。
更多推荐


 29
29 0
0- 0


 已为社区贡献1条内容

所有评论(0)