使用Antv X6实现拓扑图加数据流动
·
描述
借助Antv X6 实现简单的拓扑图和数据流动效果;适用vue项目
效果
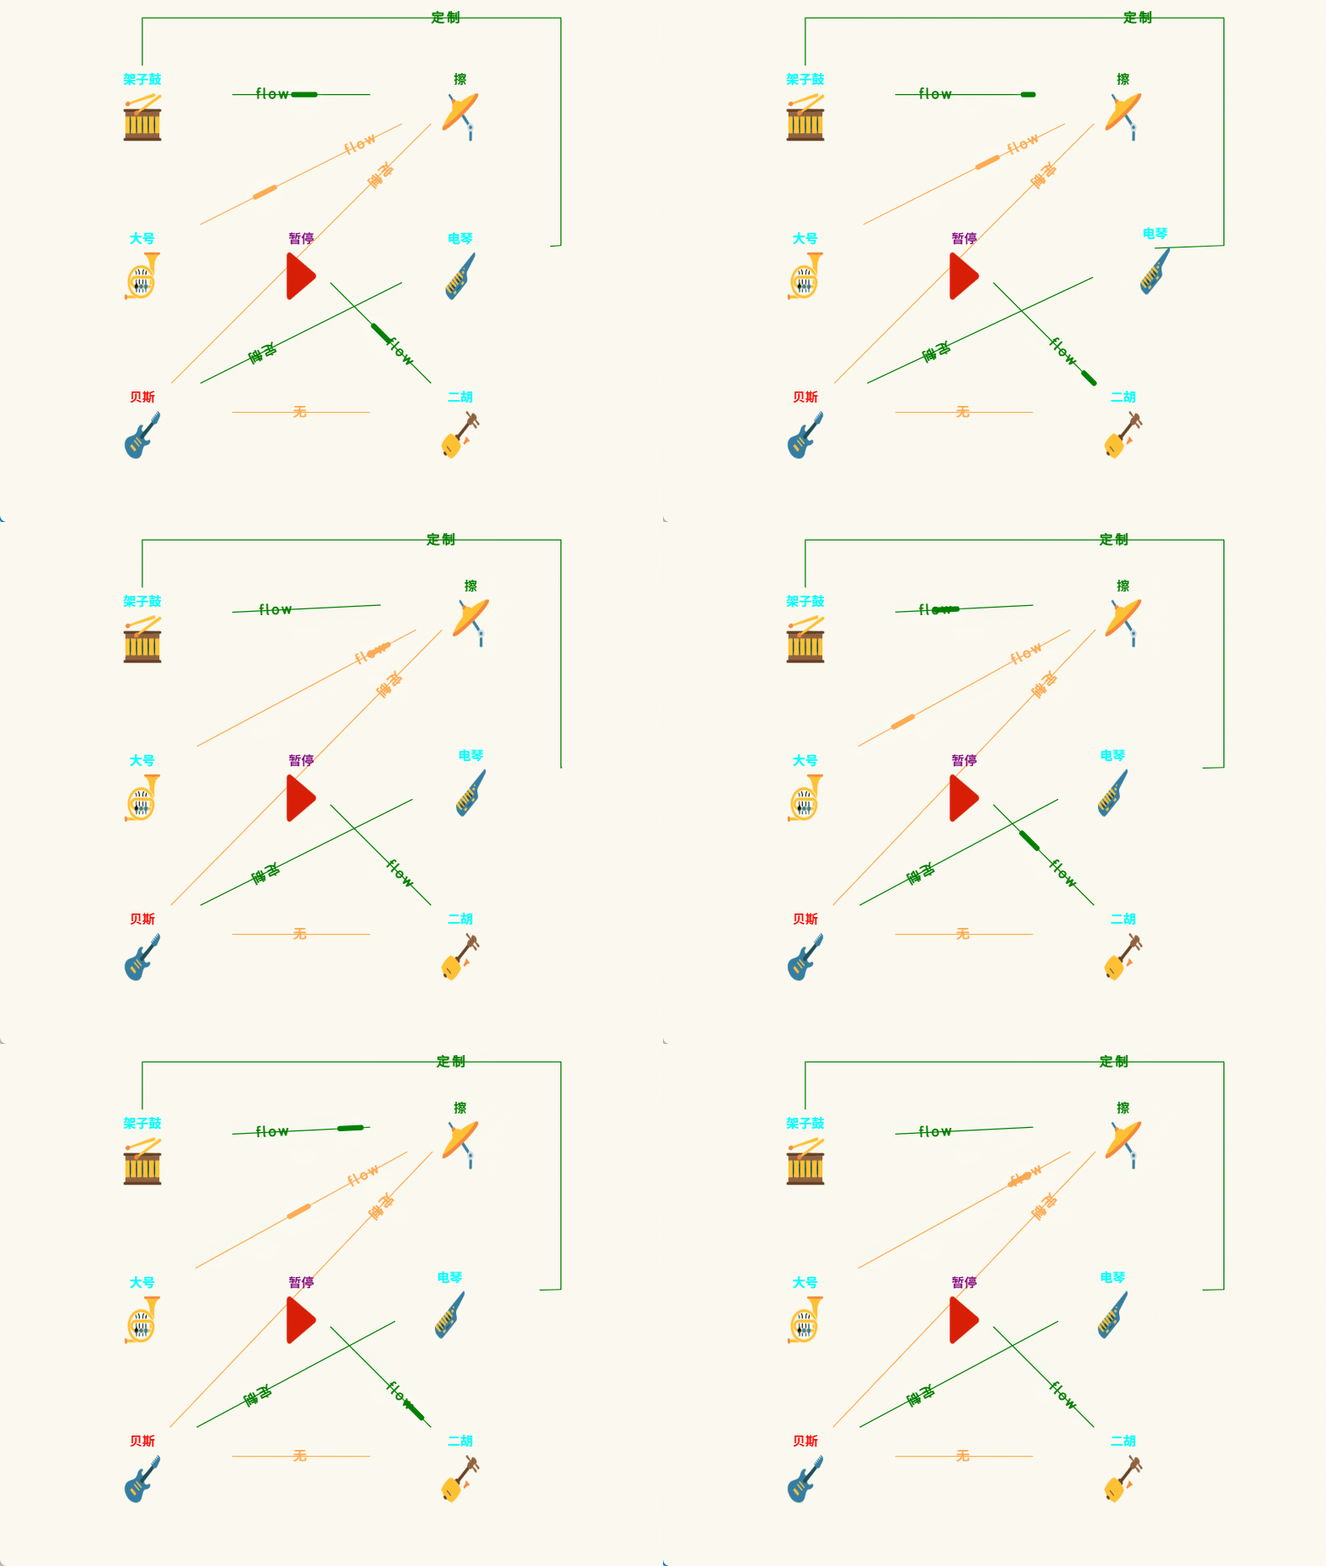
下载
npm install @antv/x6 --save
项目中使用
script部分
// 1.引入
import { Graph } from "@antv/x6"
// 2.初始化(我自己写了render函数,如果是组合式API注意改语法)
render() {
  this.graph = new Graph({
    container: this.$refs.container,
    width: 800, //设置尺寸大小
    height: 500,
    // mousewheel: true, //鼠标滚轮缩放
    // autoResize: true, //自动适应容器大小
    interacting: function (cellView) {
      return {
        nodeMovable: true, //是否可以移动节点
      }
    },
  })
  // 可以自定义节点-点击事件
  this.graph.on("node:click", ({ e, x, y, node, view }) => {
    console.log(node)
  })
  this.graph.fromJSON(this.renderData)
},
style部分
采用的是自定义html,要在vue文件中自行写自己在自定义时添加的类样式
- 需要注意的是:内部有个线条流动效果,需要写到全局才可以生效入。如下:
@keyframes ant-line {
  0% {
    stroke-dashoffset: 0;
  }
  100% {
    stroke-dashoffset: -210;
  }
}
renderData数据部分(可以自己提一个文件,内容有点多—核心)
码友们就自己看代码吧,可以评论区沟通。
import { Graph, Shape } from "@antv/x6"
export const data = {
  nodes: [
    {
      id: 1,
      shape: "custom-html",
      draggable: false,
      position: {
        x: 150,
        y: 65,
      },
      data: {
        label: "架子鼓",
        icon: "icon_1",
        type: "cyan",
      },
    },
    {
      id: 2,
      shape: "custom-html",
      position: {
        x: 150,
        y: 65 + 150,
      },
      data: {
        label: "大号",
        icon: "icon_2",
        type: "cyan",
      },
    },
    {
      id: 3,
      shape: "custom-html",
      position: {
        x: 150,
        y: 65 + 150 * 2,
      },
      data: {
        label: "贝斯",
        icon: "icon_3",
      },
    },
    {
      id: 4,
      shape: "custom-html",
      position: {
        x: 150 * 2,
        y: 65 + 150,
      },
      data: {
        label: "暂停",
        icon: "icon_4",
        type: "purple",
      },
    },
    {
      id: 5,
      shape: "custom-html",
      position: {
        x: 150 * 3,
        y: 65,
      },
      data: {
        label: "擦",
        icon: "icon_5",
        type: "green",
      },
    },
    {
      id: 6,
      shape: "custom-html",
      position: {
        x: 150 * 3,
        y: 65 + 150,
      },
      data: {
        label: "电琴",
        icon: "icon_6",
        type: "cyan",
      },
    },
    {
      id: 7,
      shape: "custom-html",
      position: {
        x: 150 * 3,
        y: 65 + 150 * 2,
      },
      data: {
        label: "二胡",
        icon: "icon_7",
        type: "cyan",
      },
    },
    {
      id: 8,
      shape: "custom-html",
      position: {
        x: 150 * 4,
        y: 65,
      },
      data: {
        label: "隐藏",
        icon: "icon_7",
        type: "cyan",
        isHidden: true,
      },
    },
  ],
  edges: [
    edgesFun(1, 6, {
      labelText: "定制",
      vertices: [
        { x: 235, y: 20 },
        { x: 630, y: 20 },
        { x: 630, y: 235 },
      ],
    }),
    edgesFun(1, 5, { labelText: "" }),
    edgesFun(1, 5, { labelText: "flow", distance: 0.3, flow: true }),
    edgesFun(2, 5, { labelText: "", type: "warn" }),
    edgesFun(2, 5, { labelText: "flow", type: "warn", distance: 0.8, flow: true }),
    edgesFun(3, 7, { labelText: "无", type: "warn" }),
    edgesFun(4, 7, { labelText: "" }),
    edgesFun(4, 7, { labelText: "flow", distance: 0.7, flow: true }),
    edgesFun(5, 3, { labelText: "定制", type: "warn", distance: 0.2 }),
    edgesFun(6, 3, { labelText: "定制", distance: 0.7 }),
  ],
}
// 自定义html
Shape.HTML.register({
  shape: "custom-html",
  width: 170,
  height: 55,
  effect: ["data"],
  html(cell) {
    const { label, type, icon, isHidden } = cell.getData()

    const div = document.createElement("div")
    div.className = "custom-html"
    // 显示隐藏
    div.classList.add(isHidden ? "hide" : "show")
    // 颜色类型
    if (type) {
      div.classList.add(type)
    }
    const img = document.createElement("img")
    loadImage(`./img/${icon}.png`).then(res => {
      img.src = res
    })
    img.width = 36
    img.height = 45

    const div2 = document.createElement("div")
    div2.className = "custom-html-label"

    const div3 = document.createElement("div")
    div3.className = "label"
    div3.innerText = label

    div2.appendChild(div3)
    div.appendChild(div2)
    div.appendChild(img)
    return div
  },
})
// 加载图片函数
async function loadImage(path) {
  const imgUrl = (await import(path)).default
  return imgUrl
}
// 线条生成函数
function edgesFun(
  source,
  target,
  options = {
    labelText: "", //线条内容
    type: "", //类型线条
    vertices: [], //拐点
    flow: false, //是否流动
    distance: 0.5, //内容相对位置
  }
) {
  let labelsStroke = "green"
  let attrsStroke = "green"
  const isFlow = options.flow
  // 线条颜色
  if (options.type === "warn") {
    labelsStroke = "#FFAC54"
    attrsStroke = "#FFAC54"
  }
  // 属性
  let attrs = {
    line: {
      zIndex: -2,
      sourceMarker: "",
      targetMarker: "",
      stroke: attrsStroke,
      strokeWidth: 1,
      strokeDasharray: 0,
    },
  }
  if (isFlow) {
    attrs = {
      line: {
        zIndex: -2,
        sourceMarker: "",
        targetMarker: "",
        stroke: attrsStroke,
        strokeWidth: 5,
        strokeDasharray: `20 ${options.dasharray || 210}`,
        strokeDashoffset: 0,
        strokeLinejoin: "round",
        strokeLinecap: "round",
        filter: `drop-shadow(0 0 5px white)`,
        style: {
          animation: "ant-line 8s infinite linear running",
        },
      },
    }
  }

  const res = {
    source,
    target,
    vertices: options.vertices || [],
    zIndex: -2,
    // 线条样式
    attrs: attrs,
    // 线条上的内容
    labels: [
      {
        attrs: {
          label: {
            text: options.labelText || "",
            stroke: labelsStroke || "green",
            fontSize: 12,
            fontWeight: "100",
            letterSpacing: 2.5,
          },
          rect: {
            fill: "transparent",
          },
        },
        position: {
          distance: options.distance || 0.5,
          offset: 0,
          options: {
            keepGradient: true,
          },
        },
      },
    ],
  }
  return res
}

DAMO开发者矩阵,由阿里巴巴达摩院和中国互联网协会联合发起,致力于探讨最前沿的技术趋势与应用成果,搭建高质量的交流与分享平台,推动技术创新与产业应用链接,围绕“人工智能与新型计算”构建开放共享的开发者生态。
更多推荐
 8
8 0
0- 0


 已为社区贡献1条内容

所有评论(0)