sql distinct 是取第一条吗_数据分析之SQL入门
上周我们聊了互联网运营同学应该掌握的数据常识 -- 数据从哪儿来、数据构成的二要素、三种数据分析思维,这周我们介绍如何用SQL做数据分析。如何通俗的理解SQL?SQL的全称是 Structured Query Language,注意L代表的意思 -- 语言。没错,SQL可以理解成类似于英文的一种表达语言。仔细想想,我们使用各种语言,无非就是使用合适的词汇、在大家认定的语法下,去传达我们的想法。SQ

上周我们聊了互联网运营同学应该掌握的数据常识 -- 数据从哪儿来、数据构成的二要素、三种数据分析思维,这周我们介绍如何用SQL做数据分析。
如何通俗的理解SQL?
SQL的全称是 Structured Query Language,注意L代表的意思 -- 语言。没错,SQL可以理解成类似于英文的一种表达语言。仔细想想,我们使用各种语言,无非就是使用合适的词汇、在大家认定的语法下,去传达我们的想法。SQL,就是一种计算机语言,用于人类和数据库的沟通,同样在认定的语法下、用合适的词汇(命令),让数据库返回我们想要的东西,当然,如果你的语法或词汇用的不对,数据库听不懂,也就会报错。
SQL查询语句学习
SQL最核心的框架如下,翻译成中文就是:从“表名”中,选择“列名”,表名和列名可变,select和from是命令。
select 列名 from 表名;一张数据库表长什么样子呢?和你平时用的excel表类似,n行*n列,每一个格子都是一个值。
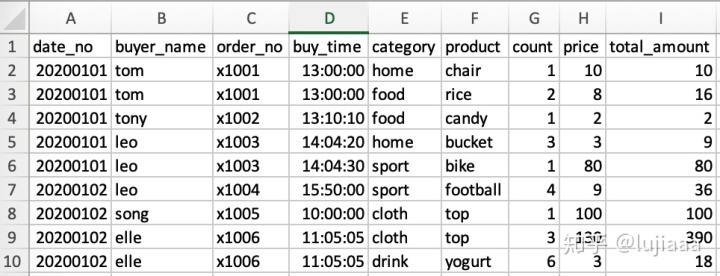
这是一张电商订单表(order_table),从A到I列的解释依次是:日期、买家名、订单号、下单时间、种类、产品、个数、单价、总价格。譬如你想看所有的订单、买的产品、买了多少件,很简单,就是从这张订单表中选择出订单、产品、个数这三列数据:
select order_no, product, count
from order_table
下面往这条SQL中加入where -- 筛选条件:
-- 从order_table表中,筛选2020年1月1号的订单、产品、个数
select order_no, product, count
from order_table
where date_no = '20200101';

-- 从order_table表中,筛选2020年1月1号、种类是sport或cloth的订单、产品、个数
select order_no, product, count
from order_table
where category in ('sport','cloth')
and date_no = '20200101';

-- 从order_table表中,筛选下单个数在1到6之间的订单、产品、个数
select order_no, product, count
from order_table
where count between 1 and 6;
注意,以上筛选出来的结果都是明细数据,只是切出order_table表中的某个部分,没有做任何计算和处理,通常我们是不会用明细数据进行分析的,而是从在某个维度上进行聚合,譬如每天每个产品的下单次数和金额,此时需要再认识一个命令 -- group by,后面跟日期、产品两个维度(还记得上周谈的指标和维度吗?select后面是指标、group by后面就是维度)。
-- 从order_table表中,统计每日每种产品类型下单次数
select date_no, category, sum(count) as total_count
from order_table
group by date_no, category;

-- 从order_table表中,统计2020年1月1号,每种产品类型、每种产品的下单次数
select date_no, category, product, sum(count) as total_count
from order_table
where date_no = '20200101'
group by date_no, category, product;
统计出来是什么效果呢?跟excel的数据透视表一个效果,我们这里用excel展示下:
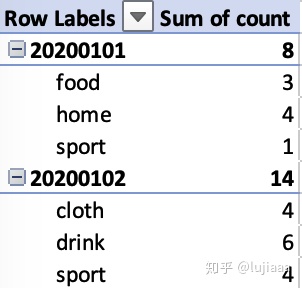

所以看到了吗,统计中最重要的是指标和维度,而时间是比较重要的一个维度,上面这条SQL如果group by后面没有date_no,这个时间维度,那么出来的数据就是累积的了。
介绍完最基本的SQL语句后,说几个最常用的命令:
-- 最大值(max)、最小值(min)、平均值(avg)

select
min(count) as min_count,
max(count) as max_count,
avg(count) as average_count
from order_table;


-- 筛选出每个产品最多、最小、累积下单个数

select
product,
min(count) as min_count,
max(count) as max_count,
sum(count) as cumulated_count
from order_table
group by product;


-- 0-5元、6-10元、10元以上的产品个数统计
-- count(distinct xxx)中distinct表示去重
-- case when ... else ... end 结构将值进行重新分组

select
     case when price between 0 and 5 then '0-5'
          when price between 6 and 10 then '6-10'
          when price > 10 then '>10'
     else 'other' end as price_group,
     count(distinct product) as product_dcnt
from order_table
group by
     case when price between 0 and 5 then '0-5'
          when price between 6 and 10 then '6-10'
          when price > 10 then '>10'
     else 'other' end;


-- 每个买家首次购买的产品是什么?
-- row_number() over(partition by column1 order by column2 asc/desc)
-- column1是要根据什么来分组,这里是根据买家来分组,column2是根据什么来排序,这里是根据时间(首次购买),最后分好组排好序,就从1开始给每条记录一个标记
-- 由于只要首次购买的产品,需要用到一个子查询,筛选出排序好的第一条记录

select
   t.buyer_name,
   t.product
from (
   select
   buyer_name,
   product,
   row_number() over((partition by buyer_name order by buy_time asc) as rn
   from order_table
) t
where t.rn = 1;


-- 截止到每天,累积的购买金额(日期是维度,结果应该是有两列,日期、截止当天累积下单金额)

select
   date_no,
   sum(total_amount) over(ORDER BY date_no) as cumulated_amount
from order_table
group by date_no;
tips:
** 善用“子查询”:有些查询写一层逻辑不好直接筛选出自己想要的数据,可以通过子查询解决,他的本质是先加工出一张临时表,然后查这张临时表,比如上面每个买家的首次购买产品,原表中没有第几次购买这个指标,那么我们就要先添加上这个指标,然后在这个新的表中,去获取自己想要的数据。

DAMO开发者矩阵,由阿里巴巴达摩院和中国互联网协会联合发起,致力于探讨最前沿的技术趋势与应用成果,搭建高质量的交流与分享平台,推动技术创新与产业应用链接,围绕“人工智能与新型计算”构建开放共享的开发者生态。
更多推荐

 0
0 0
0- 0


 已为社区贡献3条内容

所有评论(0)