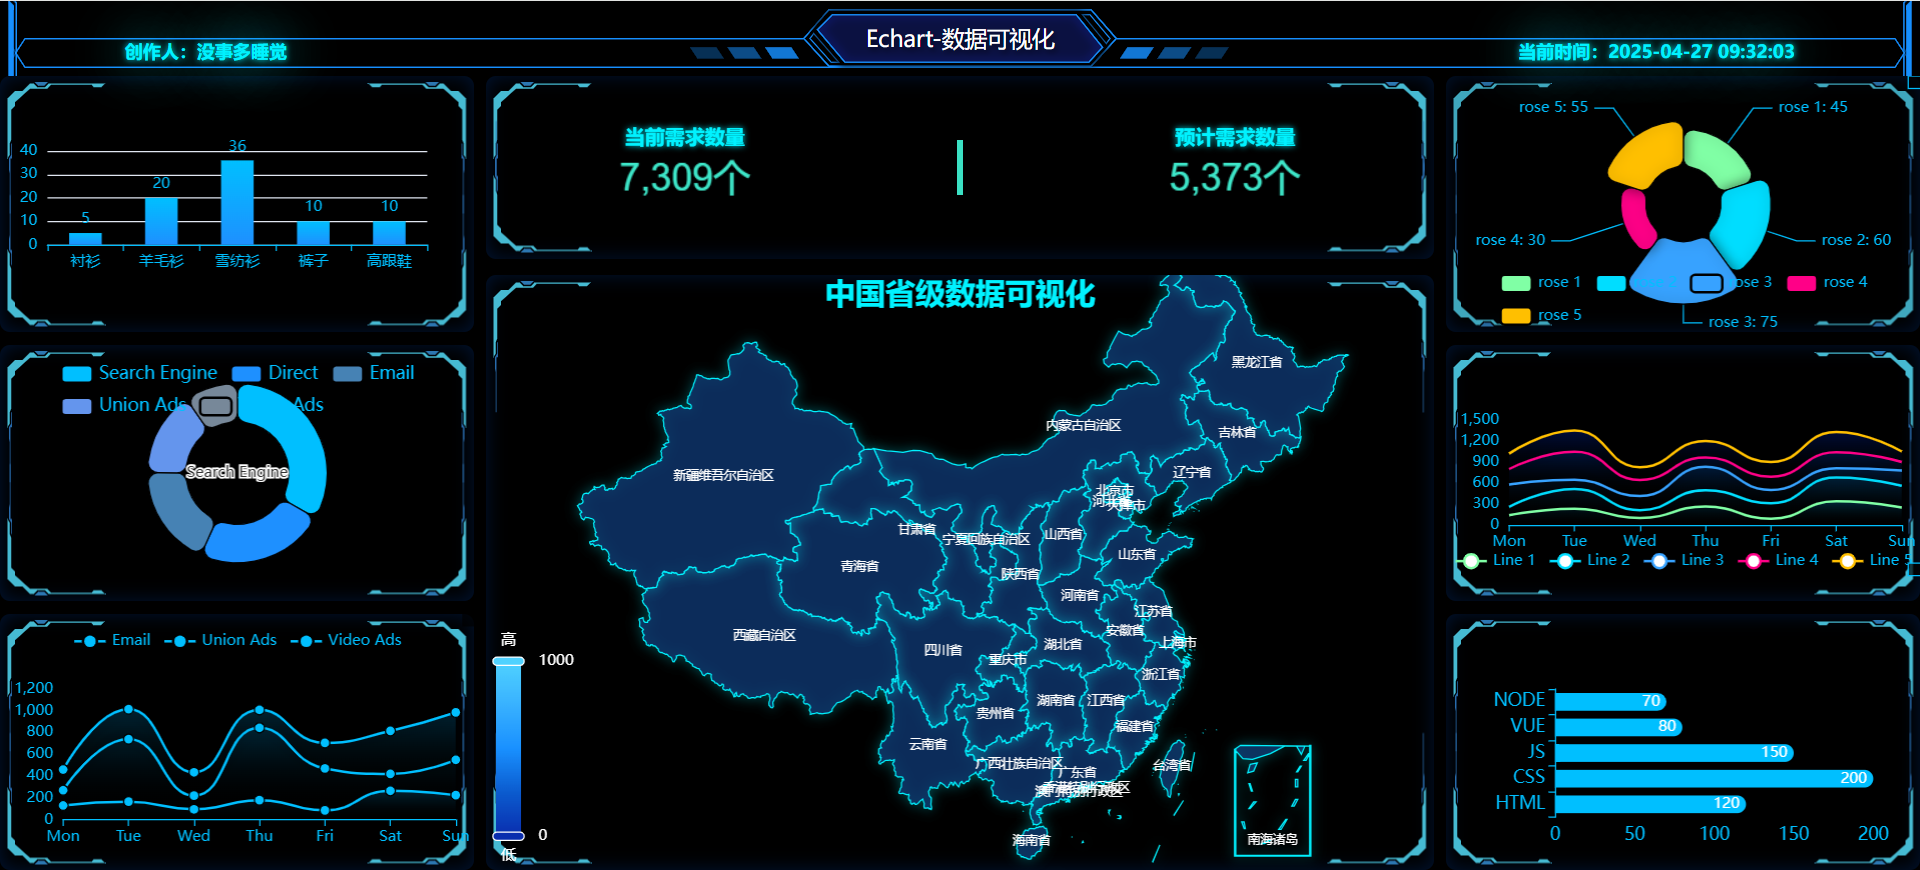
《Vue3 + ECharts + DataV 打造数据大屏可视化》(附源码)
前端框架:Vue 3可视化库:ECharts + DataV构建工具:Vite部署平台:GitHub Pages。
·
一、项目概述
技术栈:
-
前端框架:Vue 3
-
可视化库:ECharts + DataV
-
构建工具:Vite
-
部署平台:GitHub Pages
展示效果
二、环境搭建
安装Vue3脚手架
npm init vue@latest安装Echarts和DataV
#  使用npm
npm install echarts @kjgl77/datav-vue3

# 本项目使用pnpm

pnpm add echarts @kjgl77/datav-vue3

# 使用yarn
yarn add echarts @kjgl77/datav-vue3
安装china.json文件(也可以自己下载其他的)
# 下载json地图文件

npm install echarts-china-cities-js --save
目录结构
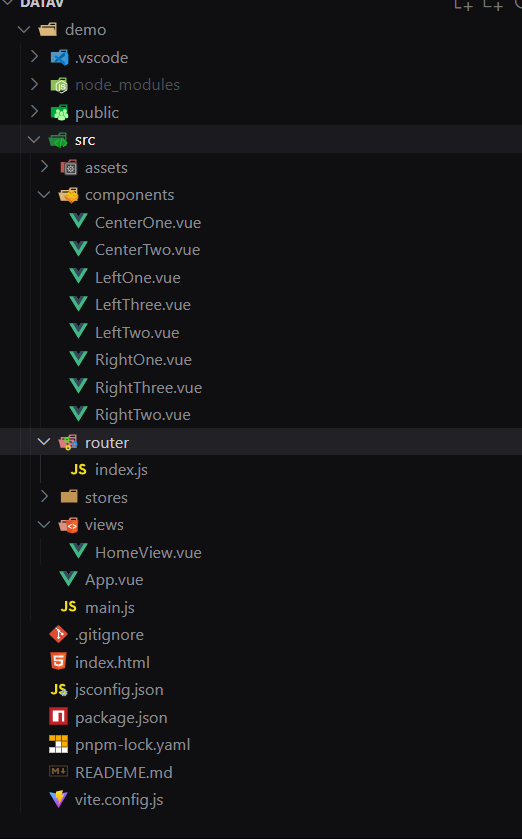
准备工作
1、在router目录写注路由
# index.js

import { createRouter, createWebHashHistory } from 'vue-router'
import HomeView from '../views/HomeView.vue'
const router = createRouter({
  history: createWebHashHistory(),

  routes: [
    {
      path: '/',
      name: 'home',
      component: HomeView
    }
  ],
})

export default router
2、在main.js中引入
# main.js

import './assets/main.css'

import { createApp } from 'vue'
import { createPinia } from 'pinia'

import App from './App.vue'
import router from './router'
import DataVVue3 from '@kjgl77/datav-vue3'
const app = createApp(App)

app.use(createPinia())
app.use(router)
app.use(DataVVue3)

app.mount('#app')
三、代码展示
1、HomeView.vue
# HomeView.vue

<script setup>
import { ref, onMounted, onBeforeUnmount } from "vue";
import LeftOne from "@/components/LeftOne.vue";
import LeftTwo from "@/components/LeftTwo.vue";
import LeftThree from "@/components/LeftThree.vue";
import CenterOne from "@/components/CenterOne.vue";
import CenterTwo from "@/components/CenterTwo.vue";
import RightOne from "@/components/RightOne.vue";
import RightTwo from "@/components/RightTwo.vue";
import RightThree from "@/components/RightThree.vue";

// 定义一个响应式变量来存储当前时间
const currentTime = ref(getCurrentDateTime());

function getCurrentDateTime() {
  const now = new Date();
  const year = now.getFullYear();
  const month = (now.getMonth() + 1).toString().padStart(2, "0");
  const day = now.getDate().toString().padStart(2, "0");
  const hours = now.getHours().toString().padStart(2, "0");
  const minutes = now.getMinutes().toString().padStart(2, "0");
  const seconds = now.getSeconds().toString().padStart(2, "0");
  return `${year}-${month}-${day} ${hours}:${minutes}:${seconds}`;
}

let timer = null;

// 在组件挂载时启动定时器
onMounted(() => {
  timer = setInterval(() => {
    currentTime.value = getCurrentDateTime();
  }, 1000);
});

// 在组件卸载时清除定时器
onBeforeUnmount(() => {
  clearInterval(timer);
});
</script>

<template>
  <div class="home">
    <header class="top">
      <dv-border-box-11
        title="Echart-数据可视化"
        class="top-nav"
        :color="['#188ffe']"
      >
        <div class="name">创作人:没事多睡觉</div>
        <div class="time">当前时间:{{ currentTime }}</div>
      </dv-border-box-11>
    </header>

    <main class="bottom">
      <div class="left">
        <dv-border-box-1 class="left-item">
          <LeftOne />
        </dv-border-box-1>
        <dv-border-box-1 class="left-item">
          <LeftTwo />
        </dv-border-box-1>
        <dv-border-box-1 class="left-item">
          <LeftThree />
        </dv-border-box-1>
      </div>

      <div class="center">
        <dv-border-box-1 class="center-top">
          <div class="center-top-item">
            <div class="center-top-item-span">
              <span>当前需求数量</span>
              <CenterOne />
            </div>

            <div class="line"></div>

            <div class="center-top-item-span">
              <span>预计需求数量</span>
              <CenterOne />
            </div>
          </div>
        </dv-border-box-1>
        <dv-border-box-1 class="center-bottom">
          <CenterTwo />
        </dv-border-box-1>
      </div>

      <div class="right">
        <dv-border-box-1 class="right-item">
          <RightOne />
        </dv-border-box-1>

        <dv-border-box-1 class="right-item">
          <RightTwo />
        </dv-border-box-1>

        <dv-border-box-1 class="right-item">
          <RightThree />
        </dv-border-box-1>
      </div>
    </main>
  </div>
</template>

<style scoped lang="less">
html,
body {
  margin: 0;
  padding: 0;
  height: 100%;
  overflow: hidden;
}

.home {
  display: flex;
  flex-direction: column;
  width: 100vw;
  height: 100vh;
  background-color: #000;
  color: #fff;
}

.top {
  display: grid;
  height: 60px;
  .top-nav {
    width: 100%;
    height: 100%;
    position: relative;
    text-shadow: 2px 2px 4px rgba(0, 0, 0, 0.5);
    .name {
      position: absolute;
      left: 100px;
      top: 50%;
      color: #00f2ff;
      text-shadow: 0 0 5px #00f2ff, 0 0 40px #00f2ff;
      font-weight: 700;
      // 发光
      font-size: 0.9rem;
    }
    .time {
      position: absolute;
      right: 100px;
      top: 50%;
      font-weight: 700;
      color: #409eff;
      color: #00f2ff; /* 霓虹蓝 */
      text-shadow: 0 0 5px #00f2ff, /* 内层光晕 */ 0 0 40px #00f2ff; /* 最外层扩散 */
      font-size: 0.9rem;
    }
  }
}

.bottom {
  flex: 1;
  display: grid;
  grid-template-columns: 3fr 6fr 3fr;
  gap: 10px;
}

.left {
  display: grid;
  grid-template-rows: repeat(3, 1fr);
  gap: 10px;
  .left-item {
    width: 100%;
    border-radius: 8px;
    height: 100%;
    box-shadow: inset 0 0 15px rgba(0, 98, 255, 0.2);
  }
}

.center {
  display: flex;
  flex-wrap: wrap;
  width: 100%;
  height: 100%;
  flex-direction: column;

  flex-direction: column;
  justify-content: space-between;
  .center-top {
    display: flex;
    width: 100%;
    height: 23%;
    background-color: #000;
    border-radius: 8px;
    box-shadow: inset 0 0 15px rgba(0, 98, 255, 0.2);

    .center-top-item {
      display: flex;
      width: 100%;
      height: 100%;
      justify-content: space-around;
      align-items: center;

      .line {
        display: flex;
        width: 5px;
        height: 30%;
        background-color: #3be1c4;
      }

      .center-top-item-span {
        display: flex;
        height: 100%;
        align-items: center;
        justify-content: center;
        flex-wrap: wrap;
        flex-direction: column;
        span {
          display: flex;
          width: 100%;
          justify-content: center;
          align-items: center;
          font-weight: 700;
          color: #00f2ff;
          text-shadow: 0 0 5px #00f2ff;
        }
      }
    }
  }

  .center-bottom {
    display: flex;
    width: 100%;
    height: 75%;
    background-color: #000;
    border-radius: 8px;
    box-shadow: inset 0 0 15px rgba(0, 98, 255, 0.2);
  }
}

.right {
  display: grid;
  grid-template-rows: repeat(3, 1fr);
  gap: 10px;
  .right-item {
    width: 100%;
    height: 100%;
    border-radius: 8px;
    box-shadow: inset 0 0 15px rgba(0, 98, 255, 0.2);
  }
}
</style>
2、左边部分
2.1、LeftOne.vue(左边第一个图表组件)
# LeftOne.vue

<template>
  <div ref="chartRef1" style="width: 100%; height: 100%"></div>
</template>

<script setup>
import * as echarts from "echarts";
import { ref, onMounted, onUnmounted, watch } from 'vue';
import { useWindowSize } from '@vueuse/core'; // 使用 vueuse 来获取窗口大小

const chartRef1 = ref(null);
let chartInstance = null;
let intervalId = null;

const { width, height } = useWindowSize();

const data = ["衬衫", "羊毛衫", "雪纺衫", "裤子", "高跟鞋", "袜子", "裤子1", "鞋子2", "鞋子3", "鞋子4"];
const dataSeries = [5, 20, 36, 10, 10, 20, 100, 50, 60, 70];

const groupedData = [];
const groupedDataSeries = [];

for (let i = 0; i < data.length; i += 5) {
  groupedData.push(data.slice(i, i + 5));
  groupedDataSeries.push(dataSeries.slice(i, i + 5));
}

let currentGroupIndex = 0;

const initChart1 = () => {
  chartInstance = echarts.init(chartRef1.value);
  updateChart();
  resizeChart();
  startDataSwitching();
};

const updateChart = () => {
  const option = {
    color: ["#80FFA5", "#00DDFF", "#37A2FF", "#FF0087", "#FFBF00"],
    tooltip: {},
    xAxis: {
      data: groupedData[currentGroupIndex],
      axisLine: {
        lineStyle: {
          color: '#00bfff'
        }
      },
      axisLabel: {
        color: '#00bfff'
      }
    },
    yAxis: {
      axisLine: {
        lineStyle: {
          color: '#00bfff'
        }
      },
      axisLabel: {
        color: '#00bfff'
      }
    },
    series: [
      {
        name: "销量",
        type: "bar",
        data: groupedDataSeries[currentGroupIndex],
        barWidth: 26,
        itemStyle: {
          color: new echarts.graphic.LinearGradient(0, 0, 0, 1, [
            { offset: 0, color: '#00bfff' },
            { offset: 1, color: '#1e90ff' }
          ])
        },
        label: {
          show: true,
          position: 'top',
          color: '#00bfff',
          formatter: '{c}'
        }
      },
    ],
    graphic: [
      {
        type: 'group',
        right: 20,
        top: 20,
        children: [
          {
            type: 'rect',
            shape: {
              width: 30,
              height: 30,
            },
            style: {
              lineWidth: 1,
              cursor: 'pointer',
              shadowBlur: 5,
              shadowColor: 'rgba(0, 0, 0, 0.3)',
            },
            onclick: () => {
              toggleFullScreen(chartRef1.value);
            },
          },
          {
            type: 'text',
            style: {
              // text: '👀',
              textAlign: 'center',
              fontSize: 20,
              color: '#00bfff',
              cursor: 'pointer',
            },
            onclick: () => {
              toggleFullScreen(chartRef1.value);
            },
          },
        ],
      },
    ],
  };
  chartInstance.setOption(option);
};

const resizeChart = () => {
  if (chartInstance) {
    chartInstance.resize();
  }
};

const toggleFullScreen = (element) => {
  if (!document.fullscreenElement) {
    element.requestFullscreen().then(() => {
      element.classList.add('echarts-fullscreen');
    }).catch(err => {
      console.error(`Error attempting to enable full-screen mode: ${err.message} (${err.name})`);
    });
  } else {
    if (document.exitFullscreen) {
      document.exitFullscreen().then(() => {
        element.classList.remove('echarts-fullscreen');
      });
    }
  }
};

const startDataSwitching = () => {
  intervalId = setInterval(() => {
    currentGroupIndex = (currentGroupIndex + 1) % groupedData.length;
    updateChart();
  }, 2000);
};

onMounted(() => {
  initChart1();
  window.addEventListener('resize', resizeChart);
});

onUnmounted(() => {
  window.removeEventListener('resize', resizeChart);
  if (chartInstance) {
    chartInstance.dispose();
  }
  clearInterval(intervalId);
});

watch([width, height], () => {
  resizeChart();
});
</script>

<style scoped lang="less">
/* 添加一些基本样式以确保图表容器能够正确显示 */
.chart-container {
  width: 100%;
  height: 100%;
}

/* 全屏时的样式 */
:deep(.echarts-fullscreen) {
  position: fixed;
  top: 0;
  left: 0;
  width: 100%;
  height: 100%;
  z-index: 9999;
  background-color: #000;
  display: flex;
  justify-content: center;
  align-items: center;
  padding: 0; /* 移除内边距 */
  margin: 0; /* 移除外边距 */
}

:deep(.echarts-fullscreen .chart) {
  width: 100%;
  height: 100%;
  box-shadow: 0 0 20px rgba(0, 0, 0, 0.5);
}
</style>
2.2、LeftTwo.vue(左边第二个图表组件)
# LeftTwo.vue

<template>
  <div ref="chartRef" style="width: 100%; height: 100%"></div>
</template>

<script setup>
import * as echarts from "echarts";
import { ref, onMounted, onUnmounted, onBeforeUnmount, watch } from "vue";

const chartRef = ref(null);
let chartInstance = null;
let intervalId = null;

const dataGroups = [
  [
    { value: 1048, name: "Search Engine" },
    { value: 735, name: "Direct" },
    { value: 580, name: "Email" },
    { value: 484, name: "Union Ads" },
    { value: 300, name: "Video Ads" },
  ],
  [
    { value: 800, name: "Social Media" },
    { value: 600, name: "Referral" },
    { value: 450, name: "Affiliate" },
    { value: 350, name: "Newsletter" },
    { value: 250, name: "Other" },
  ],
];

let currentGroupIndex = 0;

const initChart = () => {
  chartInstance = echarts.init(chartRef.value);
  updateChart();
  startDataSwitching();
};

const updateChart = () => {
  const isSmallScreen = window.innerWidth < 768;

  const option = {
    color: ['#00bfff', '#1e90ff', '#4682b4', '#6495ed', '#778899'],
    tooltip: {
      trigger: "item",
      formatter: '{a} <br/>{b}: {c} ({d}%)'
    },
    legend: {
      top: isSmallScreen ? "10%" : "5%",
      left: "center",
      textStyle: {
        color: '#00bfff',
        fontSize: isSmallScreen ? 12 : 14, // 根据屏幕大小调整字体大小
      },
    },
    series: [
      {
        name: "Access From",
        type: "pie",
        radius: ["40%", "70%"],
        avoidLabelOverlap: false,
        label: {
          show: !isSmallScreen,
          position: "center",
          fontSize: isSmallScreen ? 10 : 12, // 根据屏幕大小调整标签字体大小
        },
        emphasis: {
          label: {
            show: true,
            fontSize: isSmallScreen ? 16 : 20, // 根据屏幕大小调整强调标签字体大小
            fontWeight: "bold",
            color: '#00bfff'
          },
        },
        labelLine: {
          show: !isSmallScreen, // 在小屏幕上隐藏标签线
        },
        itemStyle: {
          borderRadius: 8,
          borderColor: '#000',
          borderWidth: 1
        },
        data: dataGroups[currentGroupIndex],
      },
    ],
    graphic: [
      {
        type: 'group',
        right: isSmallScreen ? 10 : 20, // 根据屏幕大小调整全屏按钮的位置
        top: isSmallScreen ? 10 : 20, // 根据屏幕大小调整全屏按钮的位置
        children: [
          {
            type: 'rect',
            shape: {
              width: 30,
              height: 30,
            },
            style: {
              lineWidth: 1,
              cursor: 'pointer',
              shadowBlur: 5,
              shadowColor: 'rgba(0, 0, 0, 0.3)',
            },
            onclick: () => {
              toggleFullScreen(chartRef.value);
            },
          },
          {
            type: 'text',
            style: {
              // text: '👀',
              textAlign: 'center',
              fontSize: isSmallScreen ? 16 : 20, // 根据屏幕大小调整全屏按钮文字大小
              color: '#00bfff',
              cursor: 'pointer',
            },
            onclick: () => {
              toggleFullScreen(chartRef.value);
            },
          },
        ],
      },
    ],
  };
  chartInstance.setOption(option);
};

const startDataSwitching = () => {
  intervalId = setInterval(() => {
    currentGroupIndex = (currentGroupIndex + 1) % dataGroups.length;
    updateChart();
  }, 2000);
};

const toggleFullScreen = (element) => {
  if (!document.fullscreenElement) {
    element.requestFullscreen().then(() => {
      element.classList.add('echarts-fullscreen');
    }).catch(err => {
      console.error(`Error attempting to enable full-screen mode: ${err.message} (${err.name})`);
    });
  } else {
    if (document.exitFullscreen) {
      document.exitFullscreen().then(() => {
        element.classList.remove('echarts-fullscreen');
      });
    }
  }
};

onMounted(() => {
  initChart();
  window.addEventListener('resize', updateChart); // 监听窗口大小变化并更新图表
});

onBeforeUnmount(() => {
  window.removeEventListener('resize', updateChart); // 移除事件监听器
});

onUnmounted(() => {
  clearInterval(intervalId);
  if (chartInstance) {
    chartInstance.dispose();
  }
});
</script>

<style scoped lang="less">
/* 添加一些基本样式以确保图表容器能够正确显示 */
.chart-container {
  width: 100%;
  height: 100%;
}

/* 全屏时的样式 */
:deep(.echarts-fullscreen) {
  position: fixed;
  top: 0;
  left: 0;
  width: 100%;
  height: 100%;
  z-index: 9999;
  background-color: #000;
  display: flex;
  justify-content: center;
  align-items: center;
  padding: 0; /* 移除内边距 */
  margin: 0; /* 移除外边距 */
}

:deep(.echarts-fullscreen .chart) {
  width: 100%;
  height: 100%;
  box-shadow: 0 0 20px rgba(0, 0, 0, 0.5);
}
</style>
2.3、LeftThree.vue(左边第三个图表组件)
# LeftThree.vue

<template>
  <div ref="chartRef" style="width: 100%; height: 100%"></div>
</template>

<script setup>
import * as echarts from "echarts";
import { ref, onMounted, onUnmounted } from "vue";

const chartRef = ref(null);
let chartInstance = null;
let intervalId = null;

const dataGroups = [
  [
    { name: "Email", data: [300, 350, 180, 380, 160, 150, 100] },
    { name: "Union Ads", data: [250, 200, 150, 300, 280, 350, 300] },
    { name: "Video Ads", data: [180, 260, 180, 160, 220, 380, 420] },
  ],
  [
    { name: "Email", data: [100, 140, 90, 160, 70, 240, 190] },
    { name: "Union Ads", data: [230, 160, 170, 250, 270, 340, 290] },
    { name: "Video Ads", data: [160, 250, 170, 150, 210, 370, 410] },
  ],
  [
    { name: "Email", data: [130, 165, 95, 179, 85, 265, 225] },
    { name: "Union Ads", data: [140, 575, 125, 665, 385, 155, 325] },
    { name: "Video Ads", data: [190, 275, 215, 165, 235, 395, 435] },
  ]
];

let currentGroupIndex = 0;

const initChart = () => {
  chartInstance = echarts.init(chartRef.value);
  updateChart();
  startDataSwitching();
};

const updateChart = () => {
  const isSmallScreen = window.innerWidth < 768;

  const option = {
    color: ["#80FFA5", "#00DDFF", "#37A2FF", "#FF0087", "#FFBF00"],
    title: {
      textStyle: {
        color: '#00bfff', // 设置标题文字颜色为科技感蓝色
      },
    },
    tooltip: {
      trigger: "axis",
      backgroundColor: 'rgba(0, 0, 0, 0.7)',
      borderColor: '#00bfff',
      borderWidth: 1,
      textStyle: {
        color: '#fff'
      }
    },
    legend: {
      data: dataGroups[currentGroupIndex].map(item => item.name),
      textStyle: {
        color: '#00bfff', // 设置图例文字颜色为科技感蓝色
      },
      top: isSmallScreen ? "10%" : "5%",
      left: "center",
    },
    grid: {
      left: "3%",
      right: "4%",
      bottom: "10%",
      containLabel: true,
      backgroundColor: 'rgba(0, 0, 0, 0.1)', // 设置背景颜色为半透明黑色
      borderColor: '#00bfff', // 设置网格边框颜色为科技感蓝色
      borderWidth: 1
    },
    toolbox: {
      iconStyle: {
        color: '#00bfff', // 设置工具箱图标颜色为科技感蓝色
      },
      backgroundColor: 'rgba(0, 0, 0, 0.7)', // 设置工具箱背景颜色为半透明黑色
      borderColor: '#00bfff', // 设置工具箱边框颜色为科技感蓝色
    },
    xAxis: {
      type: "category",
      boundaryGap: false,
      data: ["Mon", "Tue", "Wed", "Thu", "Fri", "Sat", "Sun"],
      axisLine: {
        lineStyle: {
          color: '#00bfff' // 设置X轴线颜色为科技感蓝色
        }
      },
      axisLabel: {
        color: '#00bfff', // 设置X轴标签颜色为科技感蓝色
        rotate: isSmallScreen ? 45 : 0, // 小屏幕时旋转标签
      },
      splitLine: {
        lineStyle: {
          color: 'rgba(0, 0, 0, 0.3)' // 设置X轴分割线颜色为半透明黑色
        }
      }
    },
    yAxis: {
      type: "value",
      axisLine: {
        lineStyle: {
          color: '#00bfff' // 设置Y轴线颜色为科技感蓝色
        }
      },
      axisLabel: {
        color: '#00bfff', // 设置Y轴标签颜色为科技感蓝色
      },
      splitLine: {
        lineStyle: {
          color: 'rgba(0, 0, 0, 0.3)' // 设置Y轴分割线颜色为半透明黑色
        }
      }
    },
    series: dataGroups[currentGroupIndex].map(item => ({
      name: item.name,
      type: "line",
      stack: "Total",
      data: item.data,
      smooth: true, // 使折线平滑
      symbol: 'circle', // 设置数据点符号
      symbolSize: isSmallScreen ? 6 : 8, // 小屏幕时减小数据点大小
      lineStyle: {
        width: isSmallScreen ? 1.5 : 2, // 小屏幕时减小线条宽度
        shadowColor: 'rgba(0, 0, 0, 0.5)',
        shadowBlur: 10
      },
      itemStyle: {
        color: '#00bfff', // 设置数据点颜色
        borderColor: '#000',
        borderWidth: 1
      },
      areaStyle: {
        color: new echarts.graphic.LinearGradient(0, 0, 0, 1, [
          { offset: 0, color: 'rgba(0, 175, 255, 0.3)' },
          { offset: 1, color: 'rgba(0, 0, 0, 0)' }
        ])
      }
    })),
  };
  chartInstance.setOption(option);
};

const startDataSwitching = () => {
  intervalId = setInterval(() => {
    currentGroupIndex = (currentGroupIndex + 1) % dataGroups.length;
    updateChart();
  }, 2000);
};

onMounted(() => {
  initChart();
  window.addEventListener('resize', resizeChart);
});

onUnmounted(() => {
  clearInterval(intervalId);
  if (chartInstance) {
    chartInstance.dispose();
  }
  window.removeEventListener('resize', resizeChart);
});

const resizeChart = () => {
  if (chartInstance) {
    chartInstance.resize();
  }
};
</script>

<style scoped lang="less">
/* 添加一些基本样式以确保图表容器能够正确显示 */
.chart-container {
  width: 100%;
  height: 100%;
}

/* 全屏时的样式 */
:deep(.echarts-fullscreen) {
  position: fixed;
  top: 0;
  left: 0;
  width: 100%;
  height: 100%;
  z-index: 9999;
  background-color: #000;
  display: flex;
  justify-content: center;
  align-items: center;
  padding: 0; /* 移除内边距 */
  margin: 0; /* 移除外边距 */
}

:deep(.echarts-fullscreen .chart) {
  width: 100%;
  height: 100%;
  box-shadow: 0 0 20px rgba(0, 0, 0, 0.5);
}
</style>
3、中间部分
3.1、CenterOne.vue(中间顶部组件)
# CenterOne.vue

<template>
  <dv-digital-flop
    :config="config"
    class="animate__animated animate__fadeIn myData"
  />
</template>

<script setup>
import { ref, onMounted, onUnmounted } from "vue";
const formatter = (number) => {
  const numbers = number.toString().split("").reverse();
  const segs = [];

  while (numbers.length) segs.push(numbers.splice(0, 3).join(""));

  return segs.join(",").split("").reverse().join("");
};

const config = ref({
  number: [123456],
  content: "{nt}个",
  formatter,
});

let intervalId;

onMounted(() => {
  intervalId = setInterval(() => {
    // 生成1000-10000随机数字
    config.value.number = [Math.floor(Math.random() * 9000) + 1000];
  }, 2000);
});

onUnmounted(() => {
  clearInterval(intervalId);
});
</script>

<style scoped lang="less">
.myData{
  display: flex;
  width: 200px;
  height: 50px;
}
</style>
3.2、CenterTwo.vue(中间顶部地图组件)记得存放china.json文件在assets目录下
# CenterTwo.vue

<template>
  <div ref="chartRef" class="tech-map-container"></div>
</template>

<script setup>
import { ref, onMounted, onBeforeUnmount } from 'vue'
import * as echarts from 'echarts'
import chinaJson from '@/assets/china.json' // 导入 JSON 文件

const chartRef = ref(null)
let chartInstance = null

onMounted(async () => {
  await initChart()
  window.addEventListener('resize', resizeChart)
})

onBeforeUnmount(() => {
  window.removeEventListener('resize', resizeChart)
  chartInstance?.dispose()
})

const initChart = async () => {
  try {
    // 初始化图表
    chartInstance = echarts.init(chartRef.value, 'tech')

    // 注册地图数据
    echarts.registerMap('china', chinaJson)

    // 设置图表配置
    chartInstance.setOption(getChartOption())

    // 添加点击事件
    chartInstance.on('click', handleMapClick)

  } catch (error) {
    console.error('地图初始化失败:', error)
  }
}

const handleMapClick = (params) => {
  if (params.componentType === 'series' && params.seriesType === 'map') {
    const provinceName = params.name
    emit('province-click', provinceName)

    // 高亮选中的省份
    chartInstance.dispatchAction({
      type: 'highlight',
      seriesIndex: 0,
      name: provinceName
    })
  }
}

const getChartOption = () => {
  return {
    backgroundColor: 'transparent',
    title: {
      text: '中国省级数据可视化',
      left: 'center',
      textStyle: {
        color: '#00f2ff',
        fontSize: getResponsiveFontSize(window.innerWidth, 24, 16), // 根据屏幕宽度调整字体大小
        fontWeight: 'bold',
        textShadow: '0 0 10px rgba(0, 242, 255, 0.7)'
      }
    },
    tooltip: {
      trigger: 'item',
      formatter: params => {
        return `
          <div style="font-weight:bold; color: #00f2ff;">${params.name}</div>
        `
      },
      backgroundColor: 'rgba(0, 20, 50, 0.9)',
      borderColor: '#00f2ff',
      padding: 10,
      textStyle: {
        color: '#fff'
      }
    },
    visualMap: {
      min: 0,
      max: 1000,
      text: ['高', '低'],
      realtime: false,
      calculable: true,
      inRange: {
        color: ['#0a2dae', '#0b5bce', '#1990ff', '#38b1ff', '#50d2ff']
      },
      textStyle: {
        color: '#fff'
      }
    },
    series: [
      {
        name: '数据',
        type: 'map',
        map: 'china',
        roam: true,
        zoom: 1.2,
        label: {
          show: true,
          color: '#fff',
          fontSize: getResponsiveFontSize(window.innerWidth, 10, 8) // 根据屏幕宽度调整字体大小
        },
        itemStyle: {
          areaColor: '#0c2c5a',
          borderColor: '#00f2ff',
          borderWidth: 1,
          shadowColor: 'rgba(0, 242, 255, 0.3)',
          shadowBlur: 10
        },
        emphasis: {
          label: {
            color: '#fff',
            fontSize: getResponsiveFontSize(window.innerWidth, 12, 10), // 根据屏幕宽度调整字体大小
            fontWeight: 'bold'
          },
          itemStyle: {
            areaColor: '#1990ff',
            borderWidth: 2,
            shadowBlur: 15
          }
        },
        select: {
          label: {
            color: '#ff0',
            fontSize: getResponsiveFontSize(window.innerWidth, 12, 10), // 根据屏幕宽度调整字体大小
            fontWeight: 'bold'
          },
          itemStyle: {
            areaColor: '#ff0',
            borderColor: '#ff0'
          }
        },
      }
    ]
  }
}

const resizeChart = () => {
  chartInstance?.resize()
  chartInstance.setOption(getChartOption()) // 重新设置选项以应用响应式调整
}

// 根据屏幕宽度调整字体大小
const getResponsiveFontSize = (width, largeSize, smallSize) => {
  return width < 768 ? smallSize : largeSize
}

// 注册科技感主题
echarts.registerTheme('tech', {
  backgroundColor: 'rgba(0, 10, 30, 0.8)',
  color: ['#00f2ff', '#1990ff', '#0b5bce', '#0a2dae'],
  title: {
    textStyle: {
      color: '#00f2ff'
    }
  }
})
</script>

<style scoped>
.tech-map-container {
  width: 100%;
  height: 100%;
  overflow: hidden !important;
}
</style>
4、右边部分
4.1、RightOne.vue(右边第一个图表组件)
# RightOne.vue

<template>
  <div ref="chartRef" style="width: 100%; height: 100%"></div>
</template>

<script setup>
import { ref, onMounted, onBeforeUnmount } from "vue";
import * as echarts from "echarts";

const chartRef = ref(null);
let chartInstance = null;
let timer = null;
let currentGroupIndex = 0;

// 定义固定的数据
const allData = [
  { value: 45, name: "rose 1" },
  { value: 60, name: "rose 2" },
  { value: 75, name: "rose 3" },
  { value: 30, name: "rose 4" },
  { value: 55, name: "rose 5" },
  { value: 80, name: "rose 6" },
  { value: 25, name: "rose 7" },
  { value: 90, name: "rose 8" },
  { value: 10, name: "rose 9" },
  { value: 65, name: "rose 10" }
];

// 将数据分成两个数组,每个数组包含5条数据
const dataGroups = [
  allData.slice(0, 5),
  allData.slice(5, 10),
];

const initChart = () => {
  chartInstance = echarts.init(chartRef.value);
  updateChart();
};

const updateChart = () => {
  const option = {
    color: ["#80FFA5", "#00DDFF", "#37A2FF", "#FF0087", "#FFBF00"],
    legend: {
      top: "bottom",
      textStyle: {
        color: '#00bfff', // 设置图例文字颜色为科技感蓝色
      },
    },
    toolbox: {
      iconStyle: {
        color: '#00bfff', // 设置工具箱图标颜色为科技感蓝色
      },
      backgroundColor: 'rgba(0, 0, 0, 0.7)', // 设置工具箱背景颜色为半透明黑色
      borderColor: '#00bfff', // 设置工具箱边框颜色为科技感蓝色
      borderWidth: 1
    },
    series: [
      {
        name: "Nightingale Chart",
        type: "pie",
        radius: [30, 80],
        center: ["50%", "50%"],
        roseType: "area",
        itemStyle: {
          borderRadius: 8,
          borderColor: '#000',
          borderWidth: 1,
          shadowBlur: 10,
          shadowColor: 'rgba(0, 0, 0, 0.5)'
        },
        label: {
          show: true,
          formatter: '{b}: {c}',
          color: '#00bfff', // 设置标签文字颜色为科技感蓝色
        },
        labelLine: {
          show: true,
          lineStyle: {
            color: '#00bfff' // 设置标签线颜色为科技感蓝色
          }
        },
        data: dataGroups[currentGroupIndex],
      },
    ],
    backgroundColor: 'rgba(0, 0, 0, 0.1)', // 设置图表背景颜色为半透明黑色
  };
  chartInstance.setOption(option);
};

const startDataSwitching = () => {
  timer = setInterval(() => {
    currentGroupIndex = (currentGroupIndex + 1) % dataGroups.length;
    updateChart();
  }, 2000);
};

onMounted(() => {
  initChart();
  startDataSwitching();
});

onBeforeUnmount(() => {
  chartInstance?.dispose();
  clearInterval(timer);
});
</script>

<style scoped lang="less">
/* 添加一些基本样式以确保图表容器能够正确显示 */
.chart-container {
  width: 100%;
  height: 100%;
}

/* 全屏时的样式 */
:deep(.echarts-fullscreen) {
  position: fixed;
  top: 0;
  left: 0;
  width: 100%;
  height: 100%;
  z-index: 9999;
  background-color: #000;
  display: flex;
  justify-content: center;
  align-items: center;
  padding: 0; /* 移除内边距 */
  margin: 0; /* 移除外边距 */
}

:deep(.echarts-fullscreen .chart) {
  width: 100%;
  height: 100%;
  box-shadow: 0 0 20px rgba(0, 0, 0, 0.5);
}
</style>
4.2、RightTwo.vue(右边第二个图表组件)
# RightTwo.vue

<template>
  <div ref="chartRef" style="width: 100%; height: 100%"></div>
</template>

<script setup>
import { ref, onMounted, onBeforeUnmount } from "vue";
import * as echarts from "echarts";

const chartRef = ref(null);
let chartInstance = null;
let timer = null;
let currentGroupIndex = 0;

// 定义固定的数据
const allData = [
  [140, 232, 101, 264, 90, 340, 250],
  [120, 282, 111, 234, 220, 340, 310],
  [320, 132, 201, 334, 190, 130, 220],
  [220, 402, 231, 134, 190, 230, 120],
  [220, 302, 181, 234, 210, 290, 150],
  [180, 252, 151, 284, 120, 320, 230],
  [160, 272, 131, 304, 100, 300, 210],
  [190, 262, 141, 294, 110, 330, 240],
  [210, 242, 121, 274, 90, 310, 220],
  [230, 222, 111, 254, 80, 290, 200]
];

// 将数据分成两个数组,每个数组包含5条数据
const dataGroups = [
  allData.slice(0, 5),
  allData.slice(5, 10),
];

const initChart = () => {
  chartInstance = echarts.init(chartRef.value);
  updateChart();
  startDataSwitching();
};

const updateChart = () => {
  const option = {
    color: ["#80FFA5", "#00DDFF", "#37A2FF", "#FF0087", "#FFBF00"],
    tooltip: {
      trigger: "axis",
      axisPointer: {
        type: "cross",
        label: {
          backgroundColor: "rgba(0, 0, 0, 0.7)",
          borderColor: "#00bfff",
          borderWidth: 1,
          color: "#fff",
        },
      },
    },
    legend: {
      data: ["Line 1", "Line 2", "Line 3", "Line 4", "Line 5"],
      bottom: "10%", // 将图例位置调低
      textStyle: {
        color: "#00bfff", // 设置图例文字颜色为科技感蓝色
      },
    },
    toolbox: {
      iconStyle: {
        color: "#00bfff", // 设置工具箱图标颜色为科技感蓝色
      },
      backgroundColor: "rgba(0, 0, 0, 0.7)", // 设置工具箱背景颜色为半透明黑色
      borderColor: "#00bfff", // 设置工具箱边框颜色为科技感蓝色
      borderWidth: 1,
      bottom: "10%", // 将工具箱位置调低
    },
    grid: {
      left: "3%",
      right: "4%",
      bottom: "20%", // 增加底部空间以容纳图例和工具箱
      containLabel: true,
      backgroundColor: "rgba(0, 0, 0, 0.1)", // 设置背景颜色为半透明黑色
      borderColor: "#00bfff", // 设置网格边框颜色为科技感蓝色
      borderWidth: 1,
    },
    xAxis: [
      {
        type: "category",
        boundaryGap: false,
        data: ["Mon", "Tue", "Wed", "Thu", "Fri", "Sat", "Sun"],
        axisLine: {
          lineStyle: {
            color: "#00bfff", // 设置X轴线颜色为科技感蓝色
          },
        },
        axisLabel: {
          color: "#00bfff", // 设置X轴标签颜色为科技感蓝色
        },
        splitLine: {
          lineStyle: {
            color: "rgba(0, 0, 0, 0.3)", // 设置X轴分割线颜色为半透明黑色
          },
        },
      },
    ],
    yAxis: [
      {
        type: "value",
        axisLine: {
          lineStyle: {
            color: "#00bfff", // 设置Y轴线颜色为科技感蓝色
          },
        },
        axisLabel: {
          color: "#00bfff", // 设置Y轴标签颜色为科技感蓝色
        },
        splitLine: {
          lineStyle: {
            color: "rgba(0, 0, 0, 0.3)", // 设置Y轴分割线颜色为半透明黑色
          },
        },
      },
    ],
    series: [
      {
        name: "Line 1",
        type: "line",
        stack: "Total",
        smooth: true,
        lineStyle: {
          width: 2, // 设置线条宽度
          shadowColor: "rgba(0, 0, 0, 0.5)",
          shadowBlur: 10,
        },
        showSymbol: false,
        areaStyle: {
          opacity: 0.8,
          color: new echarts.graphic.LinearGradient(0, 0, 0, 1, [
            { offset: 0, color: "rgba(0, 175, 255, 0.3)" },
            { offset: 1, color: "rgba(0, 0, 0, 0)" },
          ]),
        },
        emphasis: {
          focus: "series",
        },
        data: dataGroups[currentGroupIndex][0],
      },
      {
        name: "Line 2",
        type: "line",
        stack: "Total",
        smooth: true,
        lineStyle: {
          width: 2, // 设置线条宽度
          shadowColor: "rgba(0, 0, 0, 0.5)",
          shadowBlur: 10,
        },
        showSymbol: false,
        areaStyle: {
          opacity: 0.8,
          color: new echarts.graphic.LinearGradient(0, 0, 0, 1, [
            { offset: 0, color: "rgba(0, 145, 255, 0.3)" },
            { offset: 1, color: "rgba(0, 0, 0, 0)" },
          ]),
        },
        emphasis: {
          focus: "series",
        },
        data: dataGroups[currentGroupIndex][1],
      },
      {
        name: "Line 3",
        type: "line",
        stack: "Total",
        smooth: true,
        lineStyle: {
          width: 2, // 设置线条宽度
          shadowColor: "rgba(0, 0, 0, 0.5)",
          shadowBlur: 10,
        },
        showSymbol: false,
        areaStyle: {
          opacity: 0.8,
          color: new echarts.graphic.LinearGradient(0, 0, 0, 1, [
            { offset: 0, color: "rgba(0, 115, 255, 0.3)" },
            { offset: 1, color: "rgba(0, 0, 0, 0)" },
          ]),
        },
        emphasis: {
          focus: "series",
        },
        data: dataGroups[currentGroupIndex][2],
      },
      {
        name: "Line 4",
        type: "line",
        stack: "Total",
        smooth: true,
        lineStyle: {
          width: 2, // 设置线条宽度
          shadowColor: "rgba(0, 0, 0, 0.5)",
          shadowBlur: 10,
        },
        showSymbol: false,
        areaStyle: {
          opacity: 0.8,
          color: new echarts.graphic.LinearGradient(0, 0, 0, 1, [
            { offset: 0, color: "rgba(0, 85, 255, 0.3)" },
            { offset: 1, color: "rgba(0, 0, 0, 0)" },
          ]),
        },
        emphasis: {
          focus: "series",
        },
        data: dataGroups[currentGroupIndex][3],
      },
      {
        name: "Line 5",
        type: "line",
        stack: "Total",
        smooth: true,
        lineStyle: {
          width: 2, // 设置线条宽度
          shadowColor: "rgba(0, 0, 0, 0.5)",
          shadowBlur: 10,
        },
        showSymbol: false,
        label: {
          show: true,
          position: "top",
          color: "#00bfff", // 设置标签文字颜色为科技感蓝色
        },
        areaStyle: {
          opacity: 0.8,
          color: new echarts.graphic.LinearGradient(0, 0, 0, 1, [
            { offset: 0, color: "rgba(0, 55, 255, 0.3)" },
            { offset: 1, color: "rgba(0, 0, 0, 0)" },
          ]),
        },
        emphasis: {
          focus: "series",
        },
        data: dataGroups[currentGroupIndex][4],
      },
    ],
  };

  // 应用配置
  chartInstance.setOption(option);
};

const startDataSwitching = () => {
  timer = setInterval(() => {
    currentGroupIndex = (currentGroupIndex + 1) % dataGroups.length;
    updateChart();
  }, 2000);
};

onMounted(() => {
  // 初始化图表
  initChart();
});

onBeforeUnmount(() => {
  // 组件卸载时销毁图表实例
  chartInstance?.dispose();
  // 清除定时器
  clearInterval(timer);
});
</script>

<style scoped lang="less">
/* 添加一些基本样式以确保图表容器能够正确显示 */
.chart-container {
  width: 100%;
  height: 100%;
}

/* 全屏时的样式 */
:deep(.echarts-fullscreen) {
  position: fixed;
  top: 0;
  left: 0;
  width: 100%;
  height: 100%;
  z-index: 9999;
  background-color: #000;
  display: flex;
  justify-content: center;
  align-items: center;
  padding: 0; /* 移除内边距 */
  margin: 0; /* 移除外边距 */
}

:deep(.echarts-fullscreen .chart) {
  width: 100%;
  height: 100%;
  box-shadow: 0 0 20px rgba(0, 0, 0, 0.5);
}
</style>
4.3、RightThree.vue(右边第三个图表组件)
# RightThree.vue

<template>
  <div ref="chartRef" class="chart-container"></div>
</template>

<script setup>
import { ref, onMounted, onBeforeUnmount } from "vue";
import * as echarts from "echarts";

const chartRef = ref(null);
let chartInstance = null;
let timer = null;
let currentGroupIndex = 0;

// 定义固定的数据
const allData = [
  120, 200, 150, 80, 70, 180, 250, 220, 190, 160
];

// 将数据分成两个数组,每个数组包含5条数据
const dataGroups = [
  allData.slice(0, 5),
  allData.slice(5, 10),
];

const initChart = () => {
  chartInstance = echarts.init(chartRef.value);
  updateChart();
  startDataSwitching();
};

const updateChart = () => {
  const option = {
    color: ["#00bfff"], // 设置柱状图的颜色为科技感蓝色
    tooltip: {
      trigger: "axis",
      axisPointer: {
        type: "shadow",
      },
    },
    yAxis: {
      type: "category",
      data: ["HTML", "CSS", "JS", "VUE", "NODE"],
      axisLine: {
        lineStyle: {
          color: "#00bfff",
        },
      },
      axisLabel: {
        color: "#00bfff",
        fontSize: getResponsiveFontSize(window.innerWidth, 14, 12) // 根据屏幕宽度调整字体大小
      },
    },
    xAxis: {
      type: "value",
      axisLine: {
        lineStyle: {
          color: "#00bfff",
        },
      },
      axisLabel: {
        color: "#00bfff",
        fontSize: getResponsiveFontSize(window.innerWidth, 14, 12) // 根据屏幕宽度调整字体大小
      },
      splitLine: {
        lineStyle: {
          color: "rgba(0, 0, 0, 0.3)",
        },
      },
    },
    series: [
      {
        data: dataGroups[currentGroupIndex],
        type: "bar",
        label: {
          show: true,
          position: "insideRight",
          color: "#fff",
          fontSize: getResponsiveFontSize(window.innerWidth, 12, 10) // 根据屏幕宽度调整字体大小
        },
        itemStyle: {
          borderRadius: [0, 10, 10, 0],
        },
      },
    ],
    grid: {
      left: "10%",
      right: "10%",
      bottom: "10%",
      containLabel: true,
    },
  };

  // 应用配置
  chartInstance.setOption(option);
};

const startDataSwitching = () => {
  timer = setInterval(() => {
    currentGroupIndex = (currentGroupIndex + 1) % dataGroups.length;
    updateChart();
  }, 2000);
};

const getResponsiveFontSize = (width, largeSize, smallSize) => {
  return width < 768 ? smallSize : largeSize;
};

onMounted(() => {
  // 初始化图表
  initChart();
});

onBeforeUnmount(() => {
  // 组件卸载时销毁图表实例和清除定时器
  if (chartInstance) {
    chartInstance.dispose();
  }
  if (timer) {
    clearInterval(timer);
  }
});
</script>

<style scoped lang="less">
/* 添加一些基本样式以确保图表容器能够正确显示 */
.chart-container {
  width: 100%;
  height: 100%;
}

/* 全屏时的样式 */
:deep(.echarts-fullscreen) {
  position: fixed;
  top: 0;
  left: 0;
  width: 100%;
  height: 100%;
  z-index: 9999;
  background-color: #000;
  display: flex;
  justify-content: center;
  align-items: center;
  padding: 0; /* 移除内边距 */
  margin: 0; /* 移除外边距 */
}

:deep(.echarts-fullscreen .chart) {
  width: 100%;
  height: 100%;
  box-shadow: 0 0 20px rgba(0, 0, 0, 0.5);
}
</style>
四、项目预览效果
预览地址:Vite App![]() https://lxxyslf.github.io/echarts/#/
https://lxxyslf.github.io/echarts/#/
五、完整代码获取
Git仓库:msdsj/vue-echarts-datav

DAMO开发者矩阵,由阿里巴巴达摩院和中国互联网协会联合发起,致力于探讨最前沿的技术趋势与应用成果,搭建高质量的交流与分享平台,推动技术创新与产业应用链接,围绕“人工智能与新型计算”构建开放共享的开发者生态。
更多推荐


 31
31 0
0- 0


 已为社区贡献1条内容

所有评论(0)